REVIEW 3 major objections 5 minor 40 references
Approach to predicting extreme events in time series of chaotic dynamical systems using machine learning techniques
T0 review · 3 major / 5 minor · reviewed 2026-08-06 · deepseek-v4-flash
Pith's one-line read For the Hénon map, a CNN trained on reconstructed attractor windows classifies pre-extreme transition windows with accuracy near 1 and recall above 80% for horizons up to three steps.
desk verdict A cleanly written CNN study of Hénon extreme-event precursors whose headline recall is real only on a curated near-event subset, so practical forecasting skill remains unproven. read the letter →
The pith
A machine-rendered reading of the paper's core claim, the machinery that carries it, and where it could break.
The reading
What carries the argument
The central object is the delay-coordinate window: each training sample is a W-step segment of the scalar observable y_n rebuilt as a two-dimensional array (y_n, y_{n-1}), so that the CNN treats temporal context as a small image. This reconstruction converts the question 'will an extreme event happen in τ steps?' into a pattern-classification question in the reconstructed attractor, where pre-event points at larger τ spread into several clusters rather than one. The load-bearing labeling identity is the TR/N assignment: a window is a transition window if it is exactly τ steps before a crossing of y*, and normal if it is far from any crossing; the near-extreme-event parameter Δ and the minimum regime size filter which windows enter the comparison. The classifier's output is a binary sigmoid decision, and performance is judged primarily by recall because transition windows are the minority class.
What would settle it
Train the model as described, then run it on the full, unfiltered y_n stream of a fresh Hénon orbit with different initial conditions (same a and b), classifying every window and counting how many y* crossings are preceded by a transition classification at τ=1,2,3 and how many false alarms occur; if the model misses most events or alarms constantly on the continuous stream, the above-80% recall does not extend beyond the curated near-event dataset.
Extended reading notes
Core claim
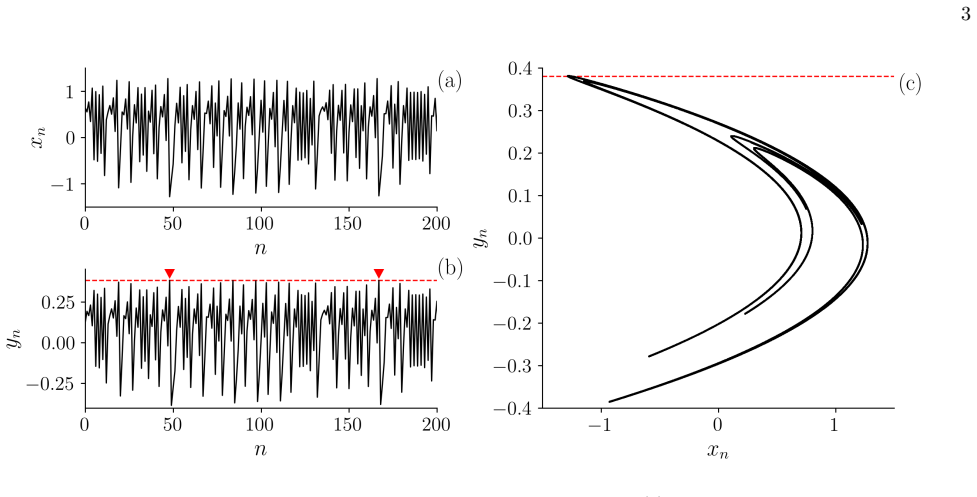
On the Hénon map with a=1.4 and b=0.3, an extreme event is taken as a crossing of the threshold y*=0.38, set through the mean plus eight standard deviations of segment maxima. The authors build each sample as a window of length W of the scalar series y_n, embedded in delay coordinates as the two-column array (y_n, y_{n-1}); the window is labeled transition if it lies τ steps before a threshold crossing and normal if it is far from any crossing, with events closer than 50 steps discarded and only windows inside a near-extreme-event region Δ=300 retained. A CNN with convolutional, dropout, pooling, flatten, and dense layers classifies the windows. With default W=50 and τ=1, classification accuracy stays close to 1 while average recall stays above 80% for τ up to 3; recall degrades for τ>3 and worsens as W grows beyond about 180 because large windows mix transition information with normal-regime data. The authors take this as evidence that indicators of an approaching extreme event are present in the reconstructed attractor a few steps ahead, and that a CNN can extract them without access to the dynamical equations.
Load-bearing premise
The load-bearing assumption is that the curated windows—drawn only from a single 400,000-step orbit, restricted to the near-extreme-event region Δ=300, and stripped of events spaced closer than 50 steps—represent the actual task of predicting extreme events in the Hénon map.
Editorial extensions
If this is right
- Precursors of Hénon-map extremes are learnable from a single observable a few steps ahead of the event, since recall above 80% is achieved for τ up to 3.
- Window size and forecast horizon are coupled: larger W degrades recall by blending transition information with normal-regime behavior, and for τ>4 detection is poor across all window sizes tested.
- Because the CNN uses only delay-coordinate reconstructions of y_n, the same pipeline can in principle be applied to any scalar time series, without knowing the governing equations.
- Accuracy is not the right metric for this problem; the paper's near-unity accuracy coexists with a large class imbalance, and recall is the limiting quantity for event detection.
- The authors report preliminary tests on the Ikeda map and a stochastic neuronal model showing the same qualitative drop of recall with W and τ, suggesting the behavior is not unique to the Hénon map.
Reading between the lines
- If the curated-window recall reflects genuine dynamics rather than the filtering, the three-step horizon is an artifact of the CNN's receptive field, not of the system: the authors' own Fig. 3 shows at least six clusters of pre-event points at τ=4, so longer-range structure exists and a wider or deeper model might push the useful horizon further.
- A decisive untested case is the continuous stream: the paper never scores the trained network on all windows of a fresh orbit, on the excluded gray-zone segments, or under other initial conditions, so the claimed above-80% recall has not yet been shown to translate into a practical alarm system with controlled false positives.
- Because the threshold y* = μ+8σ is defined statistically, the method transfers to new systems only if the event definition itself is adapted; coupling the CNN to an adaptive threshold, as the authors suggest for nonstationary data, would turn it from a post-hoc classifier into a monitoring tool.
- A cheap practical extension would use the high-recall τ=1 and τ=2 stages as a gate that triggers a more expensive model or simulation only in the final steps before a suspected event, leveraging the CNN's low false-negative performance.
Signed reviews
Editorial analysis
A structured set of objections, weighed in public.
Referee Report
Summary. The paper proposes a CNN-based classifier to distinguish transition (TR) windows preceding extreme events in the Hénon map from normal (N) windows. Extreme events are defined by a fixed threshold y* = 0.38, and inputs are time-delay reconstructions (y_n, y_{n-1}) of windows of length W. The dataset is built from a single 400,000-step orbit with a fixed initial condition, using a curated near-extreme-event region Δ = 300 and a minimum inter-event interval of 50. An adapted 5-fold temporal cross-validation is used, and the authors report accuracy near 1 and recall above 80% for lead times τ up to 3, with recall declining for larger τ and W. The conclusion generalizes the result to a demonstration of machine-learning-based extreme-event prediction in chaotic systems without full knowledge of the dynamics.
Significance. If supported by full-stream evaluation and proper baselines, this would be a useful demonstration that CNN classifiers can exploit pre-event signatures in a chaotic map, consistent with the earlier work of Lellep et al. The temporal holdout protocol is a real strength and avoids the classic leakage error, and the parametric study of W, τ, and Δ is informative. However, the current evaluation restricts the test set to curated near-event windows and does not compare against trivial deterministic baselines; therefore the headline claim of predicting extreme events up to 3 steps ahead is not yet established. The stress-test concern about the curated subset is confirmed by the dataset construction in Sec. II.B.
major comments (3)
- [Sec. II.B, Table I, Fig. 4] The reported recall is measured only on the curated near-event subset: all samples lie within Δ = 300 of an extreme event, gray-zone segments and events closer than the regime-minimum size are discarded, and the extreme points themselves are excluded. No evaluation is reported on the full 400,000-step series, on the excluded gray-zone segments, or on a second orbit. Because the N class consists of near-event normal windows rather than the long stretches of ordinary dynamics, accuracy near 1 and recall above 80% on this subset do not establish extreme-event forecasting on a continuous stream and leave false alarms unmeasured. Please add a continuous-stream evaluation with event-wise true/false positive counts, and evaluate on at least one additional orbit or set of initial conditions.
- [Sec. III, Fig. 8(b)] No baseline comparison is provided. For the Hénon map, y_n = b - (a/b) y_{n-1}^2 + b y_{n-2} follows directly from Eqs. (1)-(2), so an extreme event at time n is an exact algebraic threshold on the two previous y values; a trivial two-lag classifier should achieve near-perfect recall at τ = 1 without any learning. The near-perfect τ = 1 recall in Fig. 8(b) is therefore expected and cannot by itself demonstrate learned precursors. The authors should compare against this deterministic baseline and against Lellep et al. [16], and should state what additional skill the CNN provides beyond the map's own invertibility.
- [Sec. III, Figs. 8-9] The results are reported as single 5-fold averages with no error bars, and the paper omits precision, false-positive rate, and F1. Given the strong class imbalance (Table I: 148,857 N versus 1,915 TR samples at regime size 50), accuracy near 1 is almost uninformative, and recall alone cannot exclude a high false-alarm rate. Please report fold-to-fold variability and the full confusion-matrix metrics for the headline parameter values.
minor comments (5)
- [Algorithm 1, Step 6] The text says 'Sigmoid activation (regression output)', but the task is binary classification; this should read 'classification output'.
- [Fig. 9] The caption states the panels are 'not in scale'; please add a color bar and specify the color scale so the reader can interpret the reported α and β values.
- [Sec. IV] The conclusion states that the approach was tested on the Ikeda map and a stochastic neuronal model with 'qualitatively similar behavior', but no results for these systems are shown anywhere; either present the results or remove the claim.
- [Introduction] References [12]-[14] are cited without author names in the text ('[12] utilizes LSTMs...'); please add proper author-year citations.
- [Data availability] The statement 'The data will be made available upon request' would be strengthened by releasing code and hyperparameters; as written, the CNN architecture and training details cannot be fully reproduced.
Circularity Check
The tau=1 transition-regime 'prediction' reduces to a deterministic threshold on the CNN's input coordinates; headline recall is measured on a curated near-event subset.
-
self definitional
[Sec. II.A Eqs. (1)-(2), Sec. II.B dataset definition, Sec. III results and Fig. 9]
"TR segments are defined as windows that precede an extreme event by a specific delay, τ ... Extreme events are identified when theyn variable crosses the threshold y∗ = 0 .38. ... xn+1 = 1 − ax2 n + yn, (1) yn+1 = bxn, (2) ... For each segment, we reconstruct the attractor, generating a 2-dimensional array composed of (yn, yn−1)."
From Eqs. (1)-(2), y_{n+1}=b x_n=b(1-a x_{n-1}^2+y_{n-1})=b-(a/b)y_n^2+b y_{n-1}, since y_n=b x_{n-1}. The extreme-event indicator at n+1, 1{y_{n+1}>0.38}, is therefore a deterministic algebraic threshold on the last two input coordinates (y_n,y_{n-1}). A TR segment at tau=1 is, by definition, a window whose next value crosses the fitted threshold, so its label equals that threshold applied to the CNN input. The near-100% recall reported for tau=1 is thus the learned evaluation of the map's defining equation, not evidence of a discovered precursor; the 'prediction' is the label construction itself.
full rationale
The paper's central derivation is otherwise self-contained: the CNN is trained and temporally cross-validated on samples from a single Hénon orbit, and no load-bearing result is imported from the authors' prior work. The one self-citation ([37], a stochastic neuronal model mentioned in the conclusion) is not load-bearing. The main non-circular concerns are external-validity limitations: all samples come from one 400,000-step orbit with fixed parameters; only windows within Delta=300 of an extreme event are retained; extreme-event points and gray-zone segments are excluded; and no evaluation is reported on the continuous stream, a second orbit, or far-from-event normal segments. These affect whether the >80% recall transfers to real forecasting, but they are not circular. The circular step is the tau=1 result: because the Hénon map defines y_{n+1} as an exact function of (y_n,y_{n-1}), and the CNN input is exactly the (y_n,y_{n-1}) reconstruction, the transition label at tau=1 is the defining threshold applied to the input by construction. The paper provides no analytic baseline or comparison with Lellep et al. [16], so the tau=1 headline overstates the method's novel predictive content. The tau=2 and tau=3 results retain independent content, which is why the score is partial rather than total.
Assumptions & free parameters
free parameters (8)
- c (threshold rarity coefficient) =
8 (hand-chosen; y* = mu + 8 sigma = 0.38)
- W (window size) =
50 by default; varied across the study
- tau (lead time before extreme event) =
1 by default; varied up to and beyond 4
- Delta (near-extreme-event region) =
300 by default; varied
- minimum regime size (inter-event separation filter) =
50 (discards 427 TR samples)
- h (segment length for threshold estimation) =
not reported; threshold y* = 0.38 depends on it
- CNN hyperparameters =
not reported
- K (cross-validation folds) =
5
assumptions (5)
- domain assumption A single 400,000-step orbit of the map adequately samples the natural measure for threshold statistics.
- domain assumption Rare events defined by y > mu + c sigma with c = 8 are the meaningful extreme events.
- ad hoc to paper Curation (Delta = 300, gray-zone exclusion, minimum inter-event size 50) does not bias the reported skill.
- ad hoc to paper The recall decline for tau > 3 is caused by chaos-limited predictability.
- domain assumption Results transfer to other initial conditions and other systems.
Cite this review
Pith. "Pith review of Approach to predicting extreme events in time series of chaotic dynamical systems using machine learning techniques." pith.science (2026). https://pith.science/paper/CJCQIOII
@misc{pith2026250707834,
  author       = {Pith},
  title        = {Pith review of: Approach to predicting extreme events in time series of chaotic dynamical systems using machine learning techniques},
  year         = {2026},
  howpublished = {\url{https://pith.science/paper/CJCQIOII}},
  note         = {Machine review of arXiv:2507.07834}
}
read the original abstract
This work proposes an innovative approach using machine learning to predict extreme events in time series of chaotic dynamical systems. The research focuses on the time series of the H\'enon map, a two-dimensional model known for its chaotic behavior. The method consists of identifying time windows that anticipate extreme events, using convolutional neural networks to classify the system states. By reconstructing attractors and classifying (normal and transitional) regimes, the model shows high accuracy in predicting normal regimes, although forecasting transitional regimes remains challenging, particularly for longer intervals and rarer events. The method presents a result above 80% of success for predicting the transition regime up to 3 steps before the occurrence of the extreme event. Despite limitations posed by the chaotic nature of the system, the approach opens avenues for further exploration of alternative neural network architectures and broader datasets to enhance forecasting capabilities.
Figures


Figures from the paper (5 more)


Reference graph
Works this paper leans on
- [16]
-
[1]
G. Nearing, D. Cohen, V. Dube, M. Gauch, O. Gilon, S. Harrigan, A. Hassidim, D. Klotz, F. Kratzert, A. Metzger, S. Nevo, F. Pappenberger, C. Prudhomme, G. Shalev, S. Shenzis, T. Y. Tekalign, D. Weitzner, and Y. Matias, Global prediction of extreme floods in un- gauged watersheds, Nature627, 559 (2024)
work page 2024
-
[2]
C.-L. Chang, Extreme events, economic uncertainty and speculation on occurrences of price bubbles in crude oil futures, Energy Economics130, 107318 (2024)
work page 2024
-
[3]
H. R. Tiedmann, K. M. Faust, and L. Sela, Looking be- yond individual failures: A system-wide assessment of water infrastructure resilience to extreme events, Relia- bility Engineering & System Safety 244, 109910 (2024)
work page 2024
-
[4]
M. Ghil, P. Yiou, S. Hallegatte, B. D. Malamud, P. Naveau, A. Soloviev, P. Friederichs, V. Keilis-Borok, D. Kondrashov, V. Kossobokov, O. Mestre, C. Nicolis, H. W. Rust, P. Shebalin, M. Vrac, A. Witt, and I. Za- liapin, Extreme events: Dynamics, statistics and predic- tion, Nonlinear Processes in Geophysics18, 295 (2011)
work page 2011
-
[5]
I. Pavithran, V. R. Unni, and R. I. Sujith, Critical tran- sitions and their early warning signals in thermoacoustic systems, The European Physical Journal Special Topics 230, 3411 (2021)
work page 2021
-
[6]
P. Durairaj, S. Kanagaraj, S. Kumarasamy, and K. Ra- jagopal, Emergence of extreme events in a quasiperiodic oscillator, Physical Review E107, L022201 (2023)
work page 2023
-
[7]
E.G.Altmann, S.Hallerberg,andH.Kantz,Reactionsto extremeevents: Movingthresholdmodel,PhysicaA:Sta- tistical Mechanics and its Applications364, 435 (2006)
work page 2006
Show all 40 references
-
[8]
Yuan and A
Y. Yuan and A. Lozano-Durán, Limits to extreme event forecasting in chaotic systems, Physica D: Nonlinear Phe- nomena 467, 134246 (2024). 9
2024
-
[9]
Schweigler and J
T. Schweigler and J. Davidsen, Clustering of extreme and recurrent events in deterministic chaotic systems, Physi- cal Review E84, 016202 (2011)
2011
-
[10]
Mehrabbeik, S
M. Mehrabbeik, S. Jafari, and F. Parastesh, Extreme events in a chaotic map-based higher-order neuronal model, International Journal of Bifurcation and Chaos 35, 2550056 (2025)
2025
-
[11]
Wang, Using machine learning to analyze the changes in extreme precipitation in southern China, Atmospheric Research 302, 107307 (2024)
B. Wang, Using machine learning to analyze the changes in extreme precipitation in southern China, Atmospheric Research 302, 107307 (2024)
2024
-
[12]
Additionally, [14] combines CNNs, LSTMs, and deep neural networks (DNNs) to forecast the behavior of the two-dimensional damped harmonic oscillator
utilizes LSTMs to analyze the five-degree-of-freedom Duffing oscillator system, while [13] employs deep learn- ing to predict the quasi-cyclical climate phenomenon El Niño. Additionally, [14] combines CNNs, LSTMs, and deep neural networks (DNNs) to forecast the behavior of the...
1976 arXiv
-
[13]
Y. Guo, X. Cao, B. Liu, and K. Peng, El Niño Index prediction using deep learning with Ensemble empirical mode decomposition, Symmetry12, 893 (2020)
2020
-
[14]
Teng and L
Q. Teng and L. Zhang, Data driven nonlinear dynami- cal systems identification using multi-step CLDNN, AIP Advances 9 (2019)
2019
-
[15]
Y.Sun, L.Zhang,andM.Yao,Chaotictimeseriespredic- tionofnonlinearsystemsbasedonvariousneuralnetwork models, Chaos, Solitons& Fractals 175, 113971 (2023)
2023
-
[17]
Transition
and Rayet al. [29], a fixed threshold for identifying extreme events is determined as follows: First, we analyze a long time series ofyn, with a fixed length L = 400 000, divided intom non-overlapping seg- ments of equal length h. For each segment, we extract the maximum point...
-
[18]
Hénon, A two-dimensional mapping with a strange attractor, Communications in Mathematical Physics50, 69 (1976)
M. Hénon, A two-dimensional mapping with a strange attractor, Communications in Mathematical Physics50, 69 (1976)
1976
-
[19]
Setyonegoro, M
W. Setyonegoro, M. Hanif, S. Khoiridah, M. Ramd- han, F. Fauzi, S. Karima, V. Isnaniawardhani, S. Prib- adi, M. M. Muqqodas, P. Supendi, and S. Ardhyastuti, Exploring tsunami generation and propagation: A case study of the 2018 Palu earthquake and tsunami, Kuwait Journal of Sc...
2024
-
[20]
Mishra, S
A. Mishra, S. Leo Kingston, C. Hens, T. Kapitaniak, U. Feudel, and S. K. Dana, Routes to extreme events in dynamical systems: Dynamical and statistical character- istics, Chaos: An Interdisciplinary Journal of Nonlinear Science 30, 063114 (2020)
2020
-
[21]
Tinti, E
E. Tinti, E. Casarotti, T. Ulrich, T. Taufiqurrahman, D. Li, and A.-A. Gabriel, Constraining families of dy- namic models using geological, geodetic and strong ground motion data: The Mw 6.5, October 30th, 2016, Norcia earthquake, Italy, Earth and Planetary Science Letters 576...
2021
-
[22]
Kaveh and H
H. Kaveh and H. Salarieh, A new approach to extreme event prediction and mitigation via Markov-model-based chaos control, Chaos, Solitons & Fractals 136, 109827 (2020)
2020
-
[23]
López-Reyes, On the impact of initial conditions in the forecast of Hurricane Leslie extratropical transition, Atmospheric Research 295, 107020
M. López-Reyes, On the impact of initial conditions in the forecast of Hurricane Leslie extratropical transition, Atmospheric Research 295, 107020. (2023)
2023
-
[24]
S. H. Strogatz, Nonlinear Dynamics and Chaos: With Applications to Physics, Biology, Chemistry, and Engi- neering (Westview Press, 2015)
2015
-
[25]
X.-Q. Lu, J. Tian, Q. Liao, Z.-W. Xu, and L. Gan, CNN- LSTM based incremental attention mechanism enabled phase-space reconstruction for chaotic time series predic- tion, Journal of Electronic Science and Technology22, 100256 (2024)
2024
-
[26]
Abumohsen, A
M. Abumohsen, A. Y. Owda, M. Owda, and A. Abu- mihsan, Hybrid machine learning model combining of CNN-LSTM-RF for time series forecasting of solar power generation, e-Prime - Advances in Electrical Engineering, Electronics and Energy9, 100636 (2024)
2024
-
[27]
Salim and A
M. Salim and A. Djunaidy, Development of a CNN- LSTM approach with images as time-series data repre- sentation for predicting gold prices, Procedia Computer Science 234, 333 (2024)
2024
-
[28]
Joseph, S
D. Joseph, S. Kumarasamy, A. Karthikeyan, and K. Ra- jagopal, Extreme and dragon-king events in a discrete neuron model, International Journal of Bifurcation and Chaos 34, 2450135 (2024)
2024
-
[29]
K. T. Alligood, T. D. Sauer, and J. A. Yorke,Chaos: An Introduction to Dynamical Systems (Springer, 1996)
1996
-
[30]
L. H. Broska, W.-R. Poganietz, and S. Vögele, Extreme events defined—A conceptual discussion applying a com- plex systems approach, Futures115, 102490 (2020)
2020
-
[31]
M.A.F.Sanjuán,Artificialintelligence, chaos, prediction and understanding in science, International Journal of Bifurcation and Chaos31, 2150173 (2021)
2021
-
[32]
A. Ray, S. Rakshit, D. Ghosh, and S. K. Dana, Intermit- tent large deviation of chaotic trajectory in Ikeda map: Signature of extreme events, Chaos: An Interdisciplinary Journal of Nonlinear Science29, 043131 (2019)
2019
-
[33]
Kantz and T
H. Kantz and T. Schreiber,Nonlinear Time Series Anal- ysis (Cambridge University Press, 2003)
2003
-
[34]
Samitas, E
A. Samitas, E. Kampouris, and D. Kenourgios, Machine learning as an early warning system to predict finan- cial crisis, International Review of Financial Analysis71, 101507 (2020)
2020
-
[35]
Venkatesan and B
R. Venkatesan and B. Li,Convolutional Neural Networks in Visual Computing: A Concise Guide , Data-Enabled Engineering (CRC Press, 2017)
2017
-
[36]
S. P. Chatzis, V. Siakoulis, A. Petropoulos, E. Stavroulakis, and N. Vlachogiannakis, Forecast- ing stock market crisis events using deep and statistical machine learning techniques, Expert Systems with Applications 112, 353 (2018)
2018
-
[37]
B. R. R. Boaretto, E. E. N. Macau, and C. Masoller, Noise-induced extreme events in Hodgkin–Huxley neural networks, Chaos, Solitons&Fractals 194, 116133 (2025)
2025
-
[38]
Y. Tang, J. Kurths, W. Lin, E. Ott, and L. Kocarev, In- troduction to focus issue: When machine learning meets complex systems: Networks, chaos, and nonlinear dy- namics,Chaos: AnInterdisciplinaryJournalofNonlinear Science 30 (2020)
2020
-
[39]
Ott, Chaos in Dynamical Systems (Cambridge Uni- versity Press, 2002)
E. Ott, Chaos in Dynamical Systems (Cambridge Uni- versity Press, 2002)
2002
-
[180]
Panel (c) shows an initial decrease in β followed by a plateau, highlighting the sensitivity of detection to variations in∆
Panel (b) shows a decline inβ as τ increases, with values dropping below90% for τ >3. Panel (c) shows an initial decrease in β followed by a plateau, highlighting the sensitivity of detection to variations in∆. Overall, α remains close to 1 across all parameter ranges, confirm...
Reviewed August 6, 2026 · model on record in the stance chip above.
Discussion (0). Continue with ORCID to comment.