REVIEW 3 major objections 4 minor 58 references
Multiscale patterns of migration flows in Austria: regionalization, administrative barriers, and urban-rural divides
T0 review · 3 major / 4 minor · reviewed 2026-08-06 · deepseek-v4-flash
Pith's one-line read The paper claims that administrative boundaries at the district and federal-state level act as effective barriers to internal migration in Austria, producing regionalization and an urban-rural divide that the standard gravity model cannot…
desk verdict The boundary-alignment result is real and the synthetic gravity control is a nice piece of evidence; the main caveat is that the null is a one-size-fits-all power law, so a more flexible distance-decay baseline is the natural next check. read the letter →
The pith
A machine-rendered reading of the paper's core claim, the machinery that carries it, and where it could break.
The reading
What carries the argument
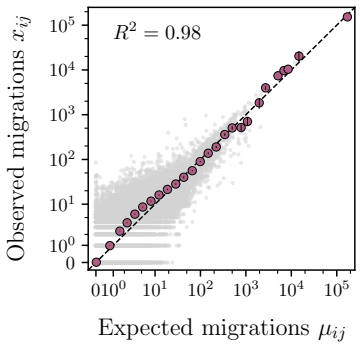
The argument is carried by a weighted stochastic block model (WSBM), a generative network model that groups municipalities into clusters and lets each cluster pair have its own migration-count distribution, with no imposed dependence on distance or population. The inference is nonparametric and hierarchical: nested levels of clustering describe migration at coarse and fine geographic scales simultaneously, selected by the minimum-description-length principle to avoid overfitting. Against this, the paper fits a Poisson gravity model with global parameters via Hamiltonian Monte Carlo, then measures discrepancies with z-scores at the cluster level and compares boundary recall between empirical and synthetic gravity-model data. The WSBM supplies the data-driven regionalization; the gravity model supplies the null baseline whose failure defines the claimed effect.
What would settle it
Refit the same comparison with a gravity model whose distance exponent varies smoothly with distance, or with a nonparametric distance profile. If the excess within-boundary and deficit across-boundary moves largely disappear under this flexible baseline, the barrier interpretation would be undermined. Alternatively, examine migration around an administrative reform such as the 2015 municipal mergers in Styria: if the old boundaries stop structuring inferred clusters after the reform, current administration is the active barrier; if they persist, the boundaries trace older cultural or economic divides.
Extended reading notes
Core claim
The paper's central discovery is that a model-free hierarchical partition of Austrian migration flows, inferred only from who moves where, recovers administrative geography without being told about it. Around 45% of district boundaries and 72% of federal-state boundaries coincide exactly with inferred community boundaries in the full network, rising to 78% and 95% when only the presence of any move is considered. Comparisons against a fitted Poisson gravity model show that moves within administrative boundaries occur more often, and moves across them less often, than the model expects; the same holds for rural-versus-urban moves. The paper argues that these deviations are systematic and persistent across two decades, and that samples generated by the gravity model do not reproduce the inferred regional structure, implying a structural limitation of the gravity ansatz rather than random noise. The authors note explicitly that this alignment alone does not establish whether borders cause the pattern, since district lines may also trace pre-existing cultural and economic structures.
Load-bearing premise
The argument's load-bearing premise is that a single power-law decline of migration with distance, with the same exponent everywhere, is an adequate null model; if the true distance decay is steeper over short distances and flatter over long ones, part of the apparent administrative-boundary effect could be an artifact of that misspecified baseline.
Editorial extensions
If this is right
- Gravity-based forecasts of internal migration will keep undercounting cross-boundary moves and overcounting within-boundary moves, so planning based on such forecasts will misallocate housing and service provision.
- Administrative borders, not just distance, separate migration communities; any mechanistic model of internal mobility should include boundary costs or regional affinity terms.
- The urban-rural divide is stronger than population-product effects imply, meaning rural areas are more demographically self-contained and cities act as disproportionate hubs.
- The regional structure is stable across two decades, so the barrier effect is a durable feature of the migration system rather than a short-lived anomaly.
- Binarized flows reveal border effects more sharply than weighted flows, so the decision to move anywhere across a border is more constrained than the volume of moves between larger regions.
Reading between the lines
- Reapplying the same pipeline to countries with different degrees of fiscal or administrative decentralization would test whether the boundary effect scales with institutional autonomy; this is an extension the paper does not make.
- The 2015 municipal merger reform in Styria offers a natural experiment: if freshly dissolved internal borders continue to appear in inferred clusters, the boundaries trace cultural identity rather than current administrative friction.
- Coupling these migration communities with commuting data could separate housing-driven from job-driven regionalization, a distinction the analysis does not attempt.
- A gravity model whose distance decay is allowed to vary nonparametrically with distance would sharpen the attribution: residual boundary effects remaining under that flexible baseline would strengthen the causal reading.
Signed reviews
Editorial analysis
A structured set of objections, weighed in public.
Referee Report
Summary. The paper analyzes 20 years of municipality-level internal migration flows in Austria (2002–2021). It fits a Poisson gravity model with parameters inferred by Hamiltonian Monte Carlo, then infers a nested weighted stochastic block model (WSBM) with minimum-description-length model selection. The WSBM partitions are found to align strongly with district and federal-state administrative boundaries, and the urban–rural pattern of flows deviates from gravity-model predictions. The authors further generate synthetic migration networks from the fitted gravity model and show that the administrative alignment and urban–rural correlation observed in the data are not reproduced in those synthetic samples. They conclude that administrative boundaries act as effective barriers to internal migration and that standard gravity models systematically miss this mesoscale regionalization.
Significance. If the central claim is robust, the paper is a valuable contribution to the internal-migration and human-mobility literature: it provides quantitative evidence over two decades that gravity models miss a first-order mesoscale feature—administrative-barrier-induced regionalization—and it demonstrates a transferable inferential workflow (HMC-based gravity fit plus nonparametric WSBM plus synthetic control). Notable strengths are the use of open registry data, the explicit 20-year stability analysis, the MDL-based model selection that guards against overfitting, and the synthetic-control comparison against the fitted gravity model. The authors also candidly state in Sec. III that the analysis cannot determine whether boundaries are causal barriers or merely reflect pre-existing demographic and cultural structures; this limitation is appropriately flagged, though the abstract's wording is stronger than that caveat. The main vulnerability is that the entire barrier interpretation rests on the adequacy of one specific gravity null, which is not tested against more flexible distance-decay baselines.
major comments (3)
- [Sec. V.a, Eq. (5)] The central 'administrative barrier' conclusion depends on the power-law gravity model with a single global distance exponent beta being an adequate null baseline. Pairs of municipalities within the same district are systematically closer than pairs across districts, so any misspecification of the distance-decay shape—for example, a true decay that is steeper at short distances and flatter at long distances, or a decay better described by road-network travel time than by great-circle distance—would produce exactly the observed pattern of excess within-boundary and deficit cross-boundary flows relative to the fitted power law. The synthetic samples in Fig. 8d are drawn from this same null and therefore inherit its misspecification; the fact that they do not reproduce the administrative alignment does not rule out this alternative explanation. I request an additional baseline analysis: at minimum, test a more flexible distance-decay function (e.g., exponential, power law with a distance threshold, or a radiation/intervening-opportunities model) and/or an alternative distance metric, and show whether the boundary recall and urban-rural correlations remain anomalous relative to those baselines.
- [Sec. II, Eq. (3), Figs. 3c–d] The z-scores defined in Eq. (3) are computed using the fitted gravity means mu_ij as if they were known exactly, ignoring posterior uncertainty in the parameters K, alpha, beta, C, and delta. In addition, the group-level partition b used to aggregate x_rs and mu_rs is itself inferred from the same data via the WSBM, so the same data are used both to select the partition and to test deviations from the gravity model. The stated threshold |z|>3 is therefore not a calibrated significance level; under the null it can be expected to produce large-magnitude z-scores because of parameter estimation and partition selection. I request a posterior predictive calibration: sample parameters and then count data from the fitted gravity model, apply the same WSBM inference to those synthetic networks, compute z-scores on the resulting partitions, and compare the empirical z-scores to this null distribution.
- [Abstract and Sec. III] The abstract states that administrative boundaries 'act as effective barriers' and that this produces 'unexpected biases' leading to regionalization, while Sec. III correctly notes that the analysis cannot determine whether boundaries are causal barriers or merely coincide with natural migration patterns. Given that the barrier interpretation is sensitive to the gravity-null assumption raised above, the abstract's causal-sounding phrasing should be aligned with the stated limitation, or the additional evidence requested above should be provided to support the stronger claim.
minor comments (4)
- [Fig. 8 caption and panel labels] The caption for Fig. 8 describes panels (a) and (c) as containing 'Left' and 'Right' sub-panels, but the displayed figure labels show (a) as 'Migration volumes in relation to districts' and (b) as 'Inferred groups from a gravity model sample'. This inconsistency between the caption structure and the actual panel layout makes the figure harder to interpret and should be corrected.
- [Throughout] There are several typographical and grammatical issues: the abstract says 'internal migrations that leads to' (subject-verb disagreement); 'Voralberg' in Fig. 3 and the text should be 'Vorarlberg'; and reference [40] contains a malformed author list ('Yin, S. , Aiman, Y. , Dandong, and S. and Wang'). These should be cleaned up.
- [Sec. II, Fig. 2] The negative R² values in Fig. 2 are informative, but the text could state more explicitly that negative R² here reflects comparison with the same global model and therefore indicates that the overall mean of the stratified subset is a better predictor than the global gravity fit. This is currently implicit and would benefit from one clarifying sentence.
- [Data availability] The manuscript states that the migration and population data are publicly available from Statistik Austria, but it does not mention whether the analysis code is available. For reproducibility of the HMC sampling, the WSBM inference, and the synthetic-control procedure, a statement on code availability would be valuable.
Circularity Check
No significant circularity: the administrative-barrier finding is an out-of-model residual against a fitted gravity null, not a construction.
full rationale
The central claim is established by comparing a gravity model fitted only to population and distance with a WSBM partition inferred only from migration counts. The administrative-boundary alignment is emergent, since no boundary information enters either fit. The key control is posterior-predictive: synthetic networks sampled from the fitted gravity model are re-analyzed with the same WSBM, and they do not reproduce the boundary recall (Fig. 8d). This is a legitimate external benchmark, not a re-description of inputs. The z-score residuals are explicitly in-sample residuals from the same fitted model, not out-of-sample predictions. No equation reduces to another by construction, and no fitted parameter is renamed as a prediction. Self-citations to Peixoto's SBM formalism are methodological, not load-bearing in the empirical claim, and the finding is externally falsifiable against synthetic gravity samples. The possible misspecification of the power-law gravity null is a model-adequacy concern, not circularity, because the null is fitted independently of the boundary structure it is used to test. Score 0: no significant circularity.
Assumptions & free parameters
free parameters (5)
- K =
not reported in paper
- alpha =
not reported in paper
- beta =
not reported in paper
- C =
not reported in paper
- delta =
not reported in paper
assumptions (4)
- domain assumption Power-law gravity form with global K, alpha, beta adequately describes baseline migration rates (Eqs. 5-7)
- domain assumption Migration counts between municipality pairs are independent Poisson variables (Eq. 6)
- domain assumption The registry dataset (MIGSTAT-Wanderungsstatistik) records all changes of main residence in Austria 2002-2021
- standard math MDL model selection and null-temperature MCMC recover the statistically adequate partition (Sec. V.b)
Cite this review
Pith. "Pith review of Multiscale patterns of migration flows in Austria: regionalization, administrative barriers, and urban-rural divides." pith.science (2026). https://pith.science/paper/ESQQ4TGR
@misc{pith2026250711503,
  author       = {Pith},
  title        = {Pith review of: Multiscale patterns of migration flows in Austria: regionalization, administrative barriers, and urban-rural divides},
  year         = {2026},
  howpublished = {\url{https://pith.science/paper/ESQQ4TGR}},
  note         = {Machine review of arXiv:2507.11503}
}
read the original abstract
Migration is central in various societal problems related to socioeconomic development. While much of the existing research has focused on international migration, migration patterns within a single country remain relatively unexplored. In this work we study internal migration patterns in Austria for a period of over 20 years, obtained from open and high-granularity administrative records. We employ inferential network methods to characterize the flows between municipalities and extract their clustering according to similar target and destination rates. Our methodology reveals significant deviations from commonly assumed relocation patterns modeled by the gravity law. At the same time, we observe unexpected biases of internal migrations that leads to less frequent movements across boundaries at both district and state levels than predictions suggest. This leads to significant regionalization of migration at multiple geographical scales and augmented division between urban and rural areas. These patterns appear to be remarkably persistent across decades of migration data, demonstrating systematic limitations of conventionally used gravity models in migration studies. Our approach presents a robust methodology that can be used to improve such evaluations, and can reveal new phenomena in migration networks.
Figures


Figures from the paper (6 more)


Reference graph
Works this paper leans on
-
[1]
D. G. Papademetriou and P. L. Martin,The unsettled relationship: Labor migration and economic development, 33 (Greenwood Publishing Group, 1991)
work page 1991
-
[2]
M. Czaika and C. Reinprecht, inIntroduction to migration studies: An interactive guide to the literatures on migration and diversity(Springer International Publishing Cham, 2022) pp. 49–82
work page 2022
-
[3]
P. Scholten, A. Pisarevskaya, and N. Levy, inIntroduction to Migration Studies: An Interactive Guide to the Literatures on Migration and Diversity(Springer, 2022) pp. 3–24
work page 2022
-
[4]
H. Barbosa, M. Barthelemy, G. Ghoshal, C. R. James, M. Lenormand, T. Louail, R. Menezes, J. J. Ramasco, F. Simini, and M. Tomasini, Physics Reports734, 1 (2018), human mobility: Models and applications
work page 2018
- [5]
-
[6]
M. C. Gonzalez, C. A. Hidalgo, and A.-L. Barabasi, nature453, 779 (2008)
work page 2008
-
[7]
C. Song, T. Koren, P. Wang, and A.-L. Barab´ asi, Nature physics6, 818 (2010)
work page 2010
-
[8]
G. K. Zipf, American Sociological Review11, 677 (1946)
work page 1946
Show all 58 references
-
[9]
J. J. Lewer and H. Van den Berg, Economics letters99, 164 (2008)
2008
-
[10]
Prieto Curiel, L
R. Prieto Curiel, L. Pappalardo, L. Gabrielli, and S. R. Bishop, PloS one13, e0199892 (2018)
2018
-
[11]
Cabanas-Tirapu, L
O. Cabanas-Tirapu, L. Dan´ us, E. Moro, M. Sales-Pardo, and R. Guimer` a, Nature Communications16, 1336 (2025)
2025
-
[12]
Mazzoli, A
M. Mazzoli, A. Molas, A. Bassolas, M. Lenormand, P. Colet, and J. J. Ramasco, Nature communications 10, 3895 (2019)
2019
-
[13]
O.-H. Kwon, I. Hong, W.-S. Jung, and H.-H. Jo, EPJ Data Science12, 57 (2023)
2023
-
[14]
Y. Liu, Z. Sui, C. Kang, and Y. Gao, PloS one9, e86026 (2014)
2014
-
[15]
R. Li, S. Gao, A. Luo, Q. Yao, B. Chen, F. Shang, R. Jiang, and H. E. Stanley, Physical Review E 103, 012312 (2021). 15
2021
-
[16]
Expert, T
P. Expert, T. S. Evans, V. D. Blondel, and R. Lambiotte, Proceedings of the National Academy of Sciences108, 7663 (2011)
2011
-
[17]
J. Poot, O. Alimi, M. P. Cameron, and D. C. Mar´ e, Investigaciones Regionales-Journal of Regional Research , 63 (2016)
2016
-
[18]
S. A. Stouffer, American Sociological Review5, 845 (1940)
1940
-
[19]
Akwawua and J
S. Akwawua and J. Pooler, inGeography Research Forum(Ben-Gurion University of the Negev Press,
-
[20]
Simini, M
F. Simini, M. C. Gonz´ alez, A. Maritan, and A.-L. Barab´ asi, Nature484, 96 (2012)
2012
-
[21]
Lenormand, A
M. Lenormand, A. Bassolas, and J. J. Ramasco, Journal of Transport Geography51, 158 (2016)
2016
-
[22]
Y. Yang, C. Herrera, N. Eagle, and M. C. Gonz´ alez, Scientific reports4, 5662 (2014)
2014
-
[23]
Burger, F
M. Burger, F. Van Oort, and G.-J. Linders, Spatial economic analysis4, 167 (2009)
2009
-
[24]
A. P. Masucci, J. Serras, A. Johansson, and M. Batty, Physical Review E—Statistical, Nonlinear, and Soft Matter Physics88, 022812 (2013)
2013
-
[25]
R. M. Beyer, J. Schewe, and H. Lotze-Campen, Humanities and Social Sciences Communications9, 1 (2022)
2022
-
[26]
T. P. Peixoto, inAdvances in Network Clustering and Blockmodeling(John Wiley & Sons, Ltd, 2019) pp. 289–332, arXiv:1705.10225
2019 arXiv
-
[27]
T. P. Peixoto, Physical Review E97, 012306 (2018)
2018
-
[28]
P. D. Gr¨ unwald,The Minimum Description Length Principle(The MIT Press, Cambridge, MA, 2007)
2007
-
[29]
Rissanen,Information and Complexity in Statistical Modeling, 1st ed
J. Rissanen,Information and Complexity in Statistical Modeling, 1st ed. (Springer, New York, 2010)
2010
-
[30]
T. P. Peixoto, Physical Review X4, 011047 (2014), arXiv:1310.4377
2014 arXiv
-
[31]
Hamiltonian monte carlo for hierarchical models,
M. J. Betancourt and M. Girolami, “Hamiltonian monte carlo for hierarchical models,” (2013), arXiv:1312.0906 [stat.ME]
2013 arXiv
-
[32]
Bayesian data analysis,
A. Gelman, J. B. Carlin, H. S. Stern, D. B. Dunson, A. Vehtari, and D. B. Rubin, “Bayesian data analysis,” (Chapman and Hall/CRC, 2013) Chap. 12
2013
-
[33]
T. P. Peixoto, Elements in the Structure and Dynamics of Complex Networks (2023), 10.1017/9781009118897, arXiv:2112.00183
2023 arXiv
-
[34]
Zhang and T
L. Zhang and T. P. Peixoto, Physical Review Research2, 043271 (2020), arXiv:2006.14493
2020 arXiv
-
[35]
Holten, IEEE Transactions on Visualization and Computer Graphics12, 741 (2006)
D. Holten, IEEE Transactions on Visualization and Computer Graphics12, 741 (2006)
2006
-
[36]
T. P. Peixoto, Physical Review X11, 021003 (2021), arXiv:2005.13977
2021 arXiv
-
[37]
Available athttps://data.statistik.gv.at/
-
[38]
Ratti, S
C. Ratti, S. Sobolevsky, F. Calabrese, C. Andris, J. Reades, M. Martino, R. Claxton, and S. H. Strogatz, PloS one5, e14248 (2010)
2010
-
[39]
Menyh´ ert, E
M. Menyh´ ert, E. Bok´ anyi, R. Corten, E. M. Heemskerk, Y. Kazmina, and F. W. Takes, EPJ Data Science14, 8 (2025)
2025
-
[40]
J. Yin, S. , Aiman, Y. , Dandong, and S. and Wang, International Journal of Geographical Information Science31, 1293 (2017)
2017
-
[41]
Thiemann, F
C. Thiemann, F. Theis, D. Grady, R. Brune, and D. Brockmann, PLOS ONE5, e15422 (2010)
2010
-
[42]
De Montis, S
A. De Montis, S. Caschili, and A. Chessa, The European Physical Journal Special Topics215, 75 (2013)
2013
-
[43]
Wei and X
Y. Wei and X. Zhao, IEEE Access12, 159635 (2024)
2024
-
[44]
Quantifying Barriers of Urban Mobility,
G. Pint´ er and B. Lengyel, “Quantifying Barriers of Urban Mobility,” (2024), arXiv:2312.11343 [physics]
2024 arXiv
-
[45]
Pitoski, T
D. Pitoski, T. J. Lampoltshammer, and P. Parycek, Digital Government: Research and Practice2, 25:1 (2021)
2021
-
[46]
Pitoski, T
D. Pitoski, T. J. Lampoltshammer, and P. Parycek, Computational Social Networks8, 1 (2021)
2021
-
[47]
G¨ ursoy and B
F. G¨ ursoy and B. Badur, Social Network Analysis and Mining12, 150 (2022). 16
2022
-
[48]
Sarra, D
A. Sarra, D. D’Ingiullo, A. Evangelista, E. Nissi, D. Quaglione, and T. Di Battista, Socio-Economic Planning Sciences100, 102225 (2025)
2025
-
[49]
Jeong, Environment and Planning B: Urban Analytics and City Science51, 1227 (2024)
J. Jeong, Environment and Planning B: Urban Analytics and City Science51, 1227 (2024)
2024
-
[50]
¨ONB-ALEX - Reichsgesetzblatt 1849-1918,
“ ¨ONB-ALEX - Reichsgesetzblatt 1849-1918,”
1918
-
[51]
Xu, Papers in Regional Science97, 785 (2018)
Z. Xu, Papers in Regional Science97, 785 (2018)
2018
-
[52]
R. C. d. Carvalho and E. Charles-Edwards, Population, Space and Place26, e2332 (2020)
2020
-
[53]
Flowerdew and M
R. Flowerdew and M. Aitkin, Journal of regional science22(1982), https://doi.org/10.1111/j.1467- 9787.1982.tb00744.x
1982
-
[54]
Carpenter, A
B. Carpenter, A. Gelman, M. D. Hoffman, D. Lee, B. Goodrich, M. Betancourt, M. Brubaker, J. Guo, P. Li, and A. Riddell, Journal of Statistical Software76, 1 (2017)
2017
-
[55]
T. P. Peixoto, Physical Review X4(2014), 10.1103/physrevx.4.011047
2014 doi
-
[56]
Karrer and M
B. Karrer and M. E. J. Newman, Physical Review E83, 016107 (2011)
2011
-
[57]
T. P. Peixoto, Phys. Rev. E95, 012317 (2017)
2017
-
[58]
T. P. Peixoto, Phys. Rev. E89, 012804 (2014). 17 Results on binary network In Fig. 9 we show the results equivalent to Fig. 4, but considering only a binarized version of the network, characterized by the adjacency matrix Aij = ( 1,ifx ij >0 0,otherwise. (16) (a) Inferred grou...
2014
Reviewed August 6, 2026 · model on record in the stance chip above.
Discussion (0). Continue with ORCID to comment.