REVIEW 3 major objections 5 minor 36 references
Alfv\'en wave propagation, reflection and trapping in the solar wind
T0 review · 3 major / 5 minor · reviewed 2026-08-06 · deepseek-v4-flash
Pith's one-line read Wave interference, not density contrast, sets the best scale for Alfvén wave reflection.
desk verdict A genuinely new, no-fit semi-analytical interference model explains the known Alfvén reflection scale-selectivity and its contrast dependence; the qualitative mechanism is solid, but the model's quantitative extrapolations to high contrast and long wave trains are unvalidated and the paper overstates them. read the letter →
The pith
A machine-rendered reading of the paper's core claim, the machinery that carries it, and where it could break.
The reading
What carries the argument
The semi-analytical interference model is the central device. It discretizes the density enhancement into neighboring pairs of points $(x_1, x_2)$ and computes local reflection and transmission coefficients from the impedance mismatch, $R = (Z(x_1)-Z(x_2))/(Z(x_1)+Z(x_2))$ and $T = 2Z(x_1)/(Z(x_1)+Z(x_2))$, with impedance $Z(x) = \rho(x)\,(v_{\rm bg}(x)+v_{\rm A}(x))$. Each point emits a reflected wavelet scaled by these coefficients, and the wavelets are superposed with phase delays corresponding to their travel times back to the observer; the integrated Poynting flux of the summed signal yields the reflection spectrum. The model reproduces the MHD simulation peak and, because it is cheap to evaluate, allows scans over density contrast, enhancement width, and wave-train length that would be expensive in full MHD.
What would settle it
Run the same density-enhancement setup with a full-wave solver that includes multiple scattering (or with a density contrast of 200% and a long chain of enhancements) and check whether the reflection peak moves away from $\lambda_s/\lambda_d \approx 0.57$ and whether the reflected energy exceeds the single-scattering prediction.
Extended reading notes
Core claim
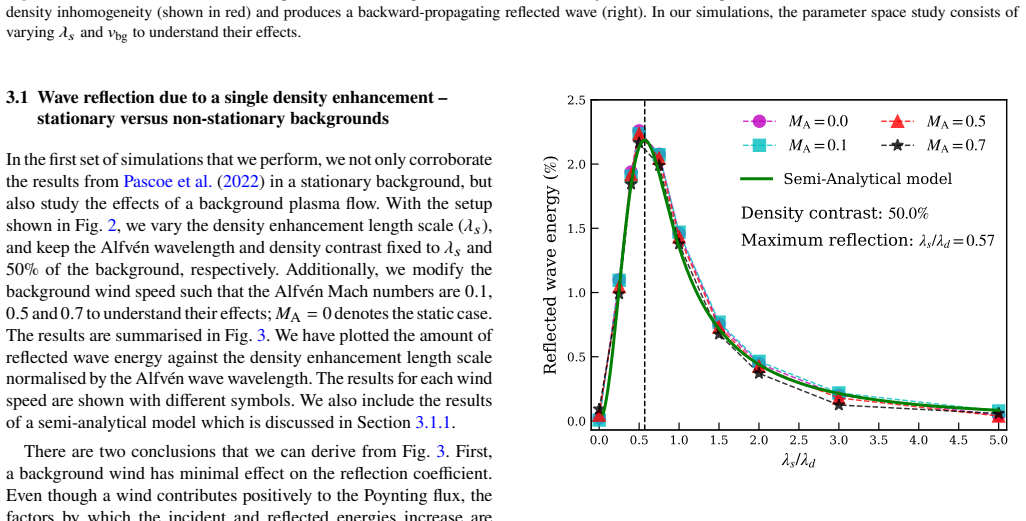
The paper's central claim is that wave interference, not the magnitude of the density contrast, is the dominant effect that makes some density length scales reflect Alfvén waves better than others. Each point in a density enhancement is treated as a source of a reflected wavelet whose amplitude is set by the local impedance mismatch, and these wavelets superpose with phase shifts accumulated from their different travel times; constructive interference peaks when the enhancement width is about half the incident wavelength, and destructive interference suppresses reflections at other widths. For a stand-alone 50% density enhancement the maximum reflected energy is about 2.2% at $\lambda_s/\lambda_d = 0.57$, and for a train of enhancements the reflected energy first grows, then saturates and even drops for many blocks because additional reflected waves arrive out of phase. The authors conclude that 'the dominant effect causing some length scales to reflect more can be understood in terms of the interference of reflected waves.'
Load-bearing premise
The interference model assumes each point in the density enhancement reflects the wave only once, so the reflected wavelets never scatter again as they travel back through the medium.
Editorial extensions
If this is right
- In a medium with a varying Alfvén wavelength, only density structures comparable to half the local wavelength will efficiently reflect and trap wave energy.
- A sub-Alfvénic background wind does not change the reflection coefficient, but it slows the back-propagating reflected waves, increasing their travel time and the opportunities for dissipation.
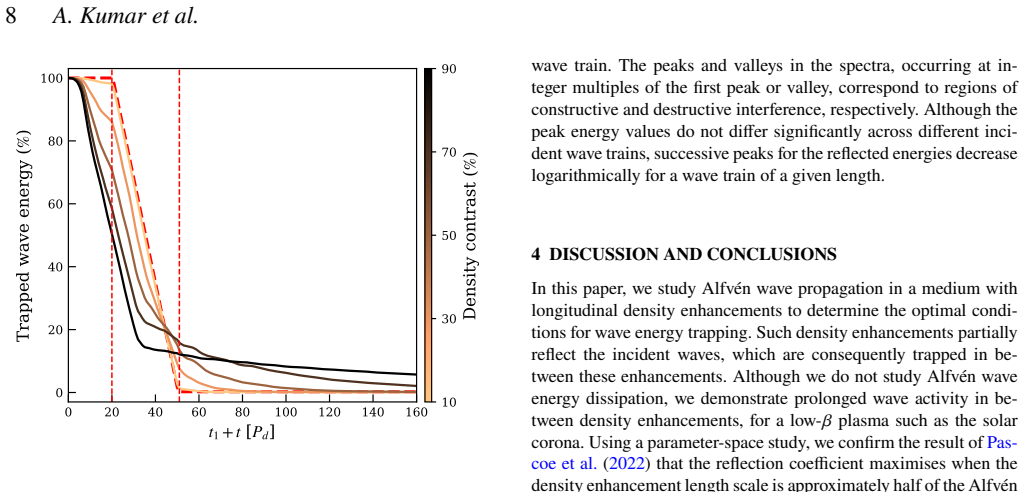
- The reflected energy from a series of density enhancements saturates because later enhancements receive less energy and their reflected contributions fall out of phase once the number of blocks exceeds roughly ten.
- The semi-analytical model can predict reflection coefficients for arbitrary density profiles without running expensive MHD simulations.
Reading between the lines
- If interference is the controlling mechanism, then any periodic density modulation should produce a similar resonance at half the Alfvén wavelength; this could be checked against in-situ solar wind measurements of reflection coefficients.
- The single-scattering assumption implies that at high density contrasts or with long chains of enhancements, multiple scattering should shift the reflection peak or change its amplitude; full-wave benchmarks would quantify where the Born-like approximation fails.
- The same phase-matching argument could apply to other wave modes, such as fast magnetoacoustic waves, unifying the scale-selectivity observed by Yuan et al. with the Alfvén wave result.
- Because the optimum enhancement width depends on the local impedance profile, the model suggests that a non-sinusoidal density structure (e.g., a Gaussian bump) would have a different peak location, offering a direct test of the interference explanation.
Editorial analysis
A structured set of objections, weighed in public.
Referee Report
Summary. The paper studies the reflection and trapping of Alfvén waves by field-aligned density enhancements in a 1.5-D ideal MHD model, motivated by coronal heating and solar wind acceleration. A parameter study confirms earlier results that reflection is maximized when the density structuring length scale is about half the Alfvén wavelength, with a peak near λ_s/λ_d ≈ 0.57 for a 50% density enhancement. The authors introduce a semi-analytical model in which each point in the density profile acts as a weak reflection source, and the reflected waves superpose with phase differences determined by travel times. This model matches the MHD simulations for the baseline single-enhancement case, supporting the interpretation that wave interference, rather than the density contrast alone, selects the favoured structuring scales. The model is then used to predict the effects of larger density contrasts and longer incident wave trains, and the results are discussed in the context of wave-energy trapping in the solar wind.
Significance. If the interference explanation is correct, the paper provides a simple physical picture for scale-selective Alfvén wave reflection, which is relevant to models of wave-driven solar wind acceleration and coronal heating. The semi-analytical model is computationally inexpensive and could be a useful tool for estimating reflection coefficients in more complex density profiles. A notable strength is that the central claim is supported by explicit agreement between the reduced-physics model and 1.5-D MHD simulations for the baseline case (Fig. 3), and the paper does not introduce free parameters into the model. However, the quantitative reach of the model is currently unvalidated outside this baseline, which limits the strength of the conclusions as they stand.
major comments (3)
- [Section 3.1.1 and Fig. 6] The semi-analytical model is used to predict that increasing the density contrast increases the maximum reflected energy and shifts the optimal λ_s/λ_d to smaller values, reaching about 14% reflected energy for 200% contrast. This parameter range is not validated against MHD simulations: the only direct model-simulation comparison is for a 50% density contrast (Fig. 3). Because the model explicitly neglects multiple scattering and wave trapping (Section 4), the quantitative predictions for high contrasts are not yet established. Please add MHD simulations for at least a few higher density contrasts (e.g., 100% and 200%) to confirm the predicted trend, or restrict the claims to the validated range.
- [Section 3.3 and Fig. 12] The reflected-energy spectra for wave trains up to 9λ_d shown in Fig. 12 are computed with the semi-analytical model only; no MHD simulation is presented for this case. For long wave trains, the interaction time with the density enhancement spans many wave periods, so multiple internal reflections—which the model neglects because each reflection site reflects only once (Section 4)—could significantly alter the interference pattern and the quoted logarithmic decrease of successive peaks. To make this prediction convincing, provide MHD cross-checks for selected train lengths (e.g., 3, 5, and 9 λ_d) with a single enhancement. If that is not feasible, the discussion should explicitly present Fig. 12 as an unverified model prediction.
- [Section 3.1.1] The construction of the semi-analytical model is underspecified regarding how the local transmission coefficient is applied to waves reflected from interior points. The text says that reflected waves are scaled by the local R and T coefficients and Fig. 4 shows R(x)T(x), but it is not stated explicitly whether the model accumulates the transmission attenuation from the leading edge to each scattering point. Please give the recurrence relation or algorithm used to compute the amplitude and phase of each reflected contribution, including how the incident wave amplitude at each point is obtained.
minor comments (5)
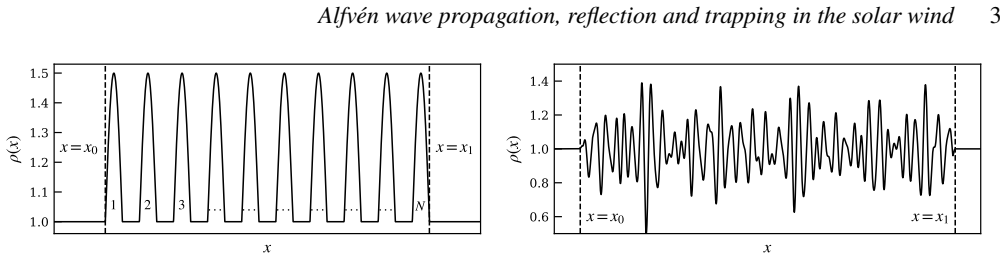
- [Section 2, Eq. (6)] The notation λ_s is used for the period of the half-sinusoidal density blocks, so the width of each individual enhancement is λ_s/2. Please state this explicitly after Eq. (6) to avoid confusion with the 'density enhancement width' terminology used later.
- [Section 3.1.1, Eq. (21)] The reduction from the Poynting flux expression (11) to the energy integral E = ∫ v⊥² dt is not shown. Please include the intermediate algebra, especially the cancellation of the second term in Eq. (11) in the static background case.
- [Section 4] The claim that the semi-analytical model 'is able to predict reflection coefficients accurately' is broader than the evidence presented, since validation is shown only for a single density contrast and a single-wave-pulse case. Suggest adding a qualifier such as 'in the parameter range tested here.'
- [Fig. 12] The colour bar appears to be on a logarithmic scale, but the units and the colour-to-value mapping are not described in the caption. Please specify that reflected energy is in percent and note the logarithmic scale.
- [References] Several in-text citations have missing spaces or non-ASCII ligatures (e.g., 'Yuanetal.(2015)' and 'Van Ballegooijen et al.'). These should be corrected to the journal's typesetting conventions.
Circularity Check
No significant circularity: the semi-analytical model is an independent impedance-mismatch superposition validated against MHD simulations, with no fitted parameters.
full rationale
The paper's central chain is: (1) 1.5-D MHD simulations measure reflected energy via time-integrated Poynting flux (Eqs 11-17); (2) a semi-analytical model in Sec. 3.1.1 discretizes the density enhancement and applies the standard impedance-mismatch coefficients R=(Z1-Z2)/(Z1+Z2) and T=2Z1/(Z1+Z2) (Eqs 18-19) at each point, then sums the reflected waves with geometric phase delays and computes energy as the time integral of the squared wave component (Eq. 21); (3) the model is plotted against MHD results in Fig. 3 and agrees without any fitted parameter. The scale-selectivity peak at lambda_s/lambda_d = 0.57 is an emergent consequence of the phase sum, not an input. The paper does cite Pascoe et al. (2022), whose authors overlap with the present authors, for the prior observation of maximum reflection near lambda_s ~ lambda_d/2, but this citation is not load-bearing: the present paper independently reproduces the effect in its own MHD runs and semi-analytical model. The Discussion explicitly notes that the model does not take into account the effects of wave trapping, as each reflection site reflects only once; this is a limitation on extrapolation (e.g., Fig. 6 to 200% density contrast and Fig. 12 to long wave trains) but not a circular reduction. No fitted parameter is renamed as a prediction, and no claim is justified solely by a self-citation chain. Therefore no significant circularity is present; the quantitative extrapolation concerns are correctness risks, not circularity.
Assumptions & free parameters
assumptions (5)
- domain assumption Ideal MHD equations (1)-(4) with ideal gas closure (5) govern the plasma.
- domain assumption Wave amplitudes are tiny (A0 = 10^-8 v_A), so waves are linear and the background is not modified.
- domain assumption The local reflection and transmission coefficients R = (Z1 - Z2)/(Z1 + Z2) and T = 2Z1/(Z1 + Z2) apply at each point within a continuous density enhancement.
- ad hoc to paper Reflected waves from each point superpose linearly with phase shifts from travel times, without further scattering (single-scattering approximation).
- domain assumption The characteristic impedance for Alfvén waves in a flowing plasma is Z = ρ(v_bg + v_A) (eq. 20).
Cite this review
Pith. "Pith review of Alfv\'en wave propagation, reflection and trapping in the solar wind." pith.science (2026). https://pith.science/paper/HFON5Z5J
@misc{pith2026250713809,
  author       = {Pith},
  title        = {Pith review of: Alfv\'en wave propagation, reflection and trapping in the solar wind},
  year         = {2026},
  howpublished = {\url{https://pith.science/paper/HFON5Z5J}},
  note         = {Machine review of arXiv:2507.13809}
}
read the original abstract
Alfv\'en waves are known to be important carriers of magnetic energy that could play a role in coronal heating and/or solar wind acceleration. As these waves are efficient energy carriers, how they are dissipated still remains one of the key challenges. Using a series of 1.5-D magnetohydrodynamic (MHD) simulations, we explore wave energy trapping associated with field-aligned density enhancements. We examine the parameters which govern the wave reflection and trapping. The goal of our simulations is to find optimal conditions for wave trapping, which would ultimately promote the energisation of the solar atmosphere. In agreement with previous studies, we find that maximum wave reflections happen only for a narrow range of density enhancement widths, namely when it is comparable to the Alfv\'en wave wavelength. In our paper, we explain this scale-selectivity using a semi-analytical model that demonstrates the importance of wave interference effects. As expected, we find that spatially extended regions of density inhomogeneities favour enhanced wave reflection and trapping. However, wave interference causes saturation of the reflected energy for very extended regions of varying density.
Figures

Figures from the paper (8 more)




Reference graph
Works this paper leans on
-
[1]
write newline
" write newline "" before.all 'output.state := FUNCTION fin.entry write newline FUNCTION new.block output.state before.all = 'skip after.block 'output.state := if FUNCTION new.sentence output.state after.block = 'skip output.state before.all = 'skip after.sentence 'output.state := if if FUNCTION not #0 #1 if FUNCTION and 'skip pop #0 if FUNCTION or pop #1...
-
[2]
write newline
" write newline "" before.all 'output.state := FUNCTION fin.entry write newline FUNCTION new.block output.state before.all = 'skip after.block 'output.state := if FUNCTION new.sentence output.state after.block = 'skip output.state before.all = 'skip after.sentence 'output.state := if if FUNCTION not #0 #1 if FUNCTION and 'skip pop #0 if FUNCTION or pop #1...
-
[3]
Asgari-Targhi M., Asgari-Targhi A., Hahn M., Savin D., 2021, @doi [The Astrophysical Journal] 10.3847/1538-4357/abe9b4 , 911, 63
-
[4]
Bale S. D., Kellogg P., Mozer F., Horbury T., Reme H., 2005, @doi [Physical Review Letters] https://doi.org/10.1103/PhysRevLett.94.215002 , 94, 215002
-
[5]
Bale S., et al., 2019, @doi [Nature] https://doi.org/10.1038/s41586-019-1818-7 , 576, 237
-
[6]
Bandyopadhyay R., et al., 2020, @doi [The Astrophysical Journal Supplement Series] 10.3847/1538-4365/ab5dae , 246, 48
-
[7]
Banerjee D., P \'e rez-Su \'a rez D., Doyle J., 2009, @doi [Astronomy & Astrophysics] 10.1051/0004-6361/200912242 , 501, L15
-
[8]
Banerjee D., et al., 2021, @doi [Space Science Reviews] 10.1007/s11214-021-00849-0 , 217, 1
Show all 36 references
-
[9]
W., Davis Jr L., 1971, @doi [Journal of Geophysical Research] https://doi.org/10.1029/JA076i016p03534 , 76, 3534
Belcher J. W., Davis Jr L., 1971, @doi [Journal of Geophysical Research] https://doi.org/10.1029/JA076i016p03534 , 76, 3534
1971 doi
-
[10]
D., Hollweg J
Chandran B. D., Hollweg J. V., 2009, @doi [The Astrophysical Journal] 10.1088/0004-637X/707/2/1659 , 707, 1659
2009 doi
-
[11]
Cirtain J., et al., 2007, @doi [Science] 10.1126/science.1147050 , 318, 1580
2007 doi
-
[12]
R., 2009, @doi [Living reviews in solar physics] https://doi.org/10.12942/lrsp-2009-3 , 6, 3
Cranmer S. R., 2009, @doi [Living reviews in solar physics] https://doi.org/10.12942/lrsp-2009-3 , 6, 3
2009 doi
-
[13]
R., Van Ballegooijen A., 2005, @doi [The Astrophysical Journal Supplement Series] 10.1086/426507 , 156, 265
Cranmer S. R., Van Ballegooijen A., 2005, @doi [The Astrophysical Journal Supplement Series] 10.1086/426507 , 156, 265
2005 doi
-
[14]
R., Van Ballegooijen A
Cranmer S. R., Van Ballegooijen A. A., Edgar R. J., 2007, @doi [The Astrophysical Journal Supplement Series] 10.1086/518001 , 171, 520
2007 doi
-
[15]
De Pontieu B., et al., 2007, @doi [Science] 10.1126/science.1151747 , 318, 1574
2007 doi
-
[16]
R., 1983, Astronomy and Astrophysics, vol
Heyvaerts J., Priest E. R., 1983, Astronomy and Astrophysics, vol. 117, no. 2, Jan. 1983, p. 220-234., https://ui.adsabs.harvard.edu/abs/1983A&A...117..220H 117, 220
1983
-
[17]
S., et al., 2020, @doi [The Astrophysical Journal Supplement Series] 10.3847/1538-4365/ab5b15 , 246, 45
Horbury T. S., et al., 2020, @doi [The Astrophysical Journal Supplement Series] 10.3847/1538-4365/ab5b15 , 246, 45
2020 doi
-
[18]
Howson T., 2022, @doi [Symmetry] 10.3390/sym14020384 , https://ui.adsabs.harvard.edu/abs/2022Symm...14..384H 14, 384
2022 doi
-
[19]
A., 1978, @doi [Astrophysical Journal, Part 1, vol
Ionson J. A., 1978, @doi [Astrophysical Journal, Part 1, vol. 226, Dec. 1, 1978, p. 650-673.] 10.1086/156648 , 226, 650
1978 doi
-
[20]
Jess D., Morton R., Verth G., Fedun V., Grant S., Giagkiozis I., 2015, @doi [Space Science Reviews] 10.1007/s11214-015-0141-3 , 190, 103
2015 doi
-
[21]
A., 2024, The Problem of Coronal Heating: A Rosetta Stone for Electrodynamic Coupling in Cosmic Plasmas
Judge P., Ionson J. A., 2024, The Problem of Coronal Heating: A Rosetta Stone for Electrodynamic Coupling in Cosmic Plasmas. Springer, @doi 10.1007/978-3-031-46273-3
2024 doi
-
[22]
C., et al., 2019, @doi [Nature] https://doi.org/10.1038/s41586-019-1813-z , 576, 228
Kasper J. C., et al., 2019, @doi [Nature] https://doi.org/10.1038/s41586-019-1813-z , 576, 228
2019 doi
-
[23]
W., De Pontieu B., Carlsson M., Hansteen V., Boerner P., Goossens M., 2011, @doi [Nature] https://doi.org/10.1038/nature10235 , 475, 477
McIntosh S. W., De Pontieu B., Carlsson M., Hansteen V., Boerner P., Goossens M., 2011, @doi [Nature] https://doi.org/10.1038/nature10235 , 475, 477
2011 doi
-
[24]
e., Zanni C., Ferrari A., 2007, @doi [The Astrophysical Journal Supplement Series] 10.1086/513316 , 170, 228
Mignone A., Bodo G., Massaglia S., Matsakos T., Tesileanu O. e., Zanni C., Ferrari A., 2007, @doi [The Astrophysical Journal Supplement Series] 10.1086/513316 , 170, 228
2007 doi
-
[25]
Morton R., Tomczyk S., Pinto R., 2015, @doi [Nature Communications] 10.1038/ncomms8813 , 6, 7813
2015 doi
-
[26]
Morton R., Sharma R., Tajfirouze E., Miriyala H., 2023, @doi [Reviews of Modern Plasma Physics] 10.1007/s41614-023-00118-3 , 7, 17
2023 doi
-
[27]
Nakariakov V., Ofman L., Arber T., 2000, Astronomy and Astrophysics, v. 353, p. 741-748 (2000), https://ui.adsabs.harvard.edu/abs/2000A
2000
-
[28]
J., De Moortel I., Pagano P., Howson T
Pascoe D. J., De Moortel I., Pagano P., Howson T. A., 2022, @doi [Monthly Notices of the Royal Astronomical Society] https://doi.org/10.1093/mnras/stac2294 , 516, 2181
2022 doi
-
[29]
C., Chandran B
Perez J. C., Chandran B. D., 2013, @doi [The Astrophysical Journal] 10.1088/0004-637X/776/2/124 , 776, 124
2013 doi
-
[30]
L., 2008, @doi [The Astrophysical Journal] 10.1086/593203 , 687, L115
Terradas J., Andries J., Goossens M., Arregui I., Oliver R., Ballester J. L., 2008, @doi [The Astrophysical Journal] 10.1086/593203 , 687, L115
2008 doi
-
[31]
Van Ballegooijen A., Asgari-Targhi M., 2016, @doi [The Astrophysical Journal] 10.3847/0004-637X/821/2/106 , 821, 106
2016 doi
-
[32]
Van Ballegooijen A., Asgari-Targhi M., Cranmer S., DeLuca E., 2011, @doi [The Astrophysical Journal] 10.1088/0004-637X/736/1/3 , 736, 3
2011 doi
-
[33]
Verdini A., Velli M., 2007, @doi [The Astrophysical Journal] 10.1086/510710 , 662, 669
2007 doi
-
[34]
Verwichte E., Nakariakov V., Longbottom A., 1999, @doi [Journal of plasma physics] 10.1017/S0022377899007771 , 62, 219
1999 doi
-
[35]
J., Nakariakov V
Yuan D., Pascoe D. J., Nakariakov V. M., Li B., Keppens R., 2015, @doi [The Astrophysical Journal] 10.1088/0004-637X/799/2/221 , 799, 221
2015 doi
-
[36]
V., Meng X., Jin M., Manchester IV W
van der Holst B., Sokolov I. V., Meng X., Jin M., Manchester IV W. B., Toth G., Gombosi T. I., 2014, @doi [The Astrophysical Journal] 10.1088/0004-637X/782/2/81 , 782, 81
2014 doi
Reviewed August 6, 2026 · model on record in the stance chip above.
Discussion (0). Continue with ORCID to comment.