REVIEW 5 major objections 5 minor 1 cited by
Automated Route-based Conflation Between Linear Referencing System Maps And OpenStreetMap Using Open-source Tools
T0 review · 5 major / 5 minor · reviewed 2026-08-06 · deepseek-v4-flash
Pith's one-line read An open-source pipeline automatically conflates Virginia's LRS basemap with OpenStreetMap, matching over 98% of roadway segments.
desk verdict A genuinely useful open-source conflation pipeline with released data, but the 98% success rate is built on a self-referential distance metric and needs reframing before it can be trusted as a correctness claim. read the letter →
The pith
A machine-rendered reading of the paper's core claim, the machinery that carries it, and where it could break.
The reading
What carries the argument
The central mechanism is the Hidden Markov Model (HMM) map-matching procedure implemented in Valhalla's Meili service, combined with Viterbi search for the most probable path. For a sequence of input points, the HMM treats each point as an emission from some hidden state (a road segment), and Viterbi decoding selects the sequence of OpenStreetMap segments that maximizes the joint probability of the observations and the transitions. The pipeline also relies on route-level pre-processing, namely decomposition of LRS geometry into X, Y, M values, interpolation to close gaps, and reversal of milepost ordering for non-prime, southbound, or westbound routes, to make each route a suitable input for the matcher.
What would settle it
Take a random sample of edges with mean distance below 12 meters, have human reviewers compare the full geometries to determine whether the matched OpenStreetMap segment represents the same physical roadway as the LRS edge, and count the proportion of topologically wrong matches; if that proportion exceeds about 2%, the claimed 98% success rate is falsified.
Extended reading notes
Core claim
The central discovery is that a GPS map-matching algorithm designed for noisy vehicle trajectories also works as a route-based conflation engine for two structured basemaps. The pipeline loads one LRS route at a time, decomposes its geometry into latitude, longitude, and milepost values, interpolates gaps larger than 12 meters at 10-meter intervals, orients points in the direction of travel (reversing the order for southbound and westbound routes in the state's convention), and submits the point sequence to Valhalla's trace_attributes endpoint with the map_snap option enabled. Valhalla's Hidden Markov Model and Viterbi search find the most likely sequence of OpenStreetMap segments, and the output is summarized into a conflation key mapping each LRS edge to an OpenStreetMap id with milepost ranges. The paper reports that 99.83% of edges processed successfully and 98.28% had a mean matching distance below 12 meters; manual review and visual sampling support the claim that the matching distances correspond to correct matches.
Load-bearing premise
The load-bearing premise is that the mean distance between original LRS points and matched OpenStreetMap points is a valid proxy for conflation correctness; if OpenStreetMap geometry is slightly offset, the distance can be small even when the route-to-segment mapping is wrong, so the 98% figure depends on this assumption.
Editorial extensions
If this is right
- Transportation agencies can use the released conflation key to transfer attributes collected on OpenStreetMap, such as curvature or speed limits, onto the LRS basemap without manual alignment.
- The method can be rerun whenever either basemap is updated, since the entire pipeline uses open-source tools and the authors publish the datasets.
- Because Valhalla can be deployed locally and routes are processed in parallel on a cluster, the approach scales to states with millions of road segments.
- The median match distance of 2.5 meters means that metrics not highly sensitive to sub-meter geometry can be transferred reliably, while edges with larger distances identify locations needing further review.
Reading between the lines
- An implication the authors leave implicit is that the same route-based conflation procedure transfers to other states' LRS basemaps only if their direction and milepost conventions are known; the -1 reversal is specific to the state's data and would need a mapping table elsewhere.
- The mean-distance quality metric could be supplemented by a topology-based check that verifies the sequence of OpenStreetMap ids along a route is connected in the routing graph, which would expose wrong-but-close matches such as reversible expressways and service-road slips.
- A testable extension is to rerun the pipeline on the next OpenStreetMap extract and the next LRS release and compare conflation-key stability; edges whose matched ids change across versions would reveal sensitivity to upstream map edits.
Signed reviews
Editorial analysis
A structured set of objections, weighed in public.
Referee Report
Summary. The paper describes an automated, open-source pipeline that conflates the Virginia Department of Transportation's linear referencing system (LRS) basemap with OpenStreetMap (OSM). The pipeline loads each LRS route, interpolates gaps larger than 12 meters, reorients points using milepost sign conventions, and submits the coordinates to Valhalla's HMM/Viterbi map-matching service with the map_snap option. The output is a conflation key mapping LRS edge-route keys to OSM segment identifiers. The authors report that 99.83% of 1.78 million edges were processed, and 98.28% of all edges (97.8% of master-route edges) have a mean pointwise distance below 12 meters. They also release the data, code, and an interactive visualization tool, and they claim this is the first published open-source conflation of an LRS basemap with OSM at state scale.
Significance. If the central success-rate claim were robust, this would be a practically significant contribution: a free, reproducible, and scalable conflation method for a state DOT basemap and OSM, with the conflation key and visualization released openly. The use of open-source tools, the large scale of the experiment, and the public data release are genuine strengths. However, the headline metric—mean pointwise distance between original and matched points—is computed from the output of the very matcher being evaluated, and the paper itself documents failure modes, such as highway-to-service-road misassignments and reversible-expressway mismatches, that are not captured by pointwise distance. The significance of the 'over 98%' claim is therefore conditional on additional independent validation or on a more cautious interpretation of the metric.
major comments (5)
- [Section IV, Table I] The central success metric is not an independent measure of conflation correctness. The mean distance x̄ is computed between the original LRS points and the points returned by Valhalla's map_snap matcher, i.e., between the input and the output of the same HMM/Viterbi algorithm. Because map-matching is designed to snap noisy points to nearby roadway segments, an incorrect match to a parallel frontage road, service road, or overlapping route can still produce a small x̄. The paper itself reports such failures: Section IV mentions conflation of highway points to service roadways, and Figure 7 shows a reversible-expressway route that did not conflate to the correct OSM segments. These are exactly cases where pointwise distance fails to detect topological error. The claim that 98.28% of edges have x̄ < 12 m therefore does not establish that 98% of matches are correct. The authors should validate on a labeled ground-truth sample with route-level topology checks (e.g., whether the matched OSM segments form a connected path along the intended route) and quantify the error rate on that sample, or reframe the headline claim as 'candidate matches with low pointwise offset' and report known failure-mode rates separately.
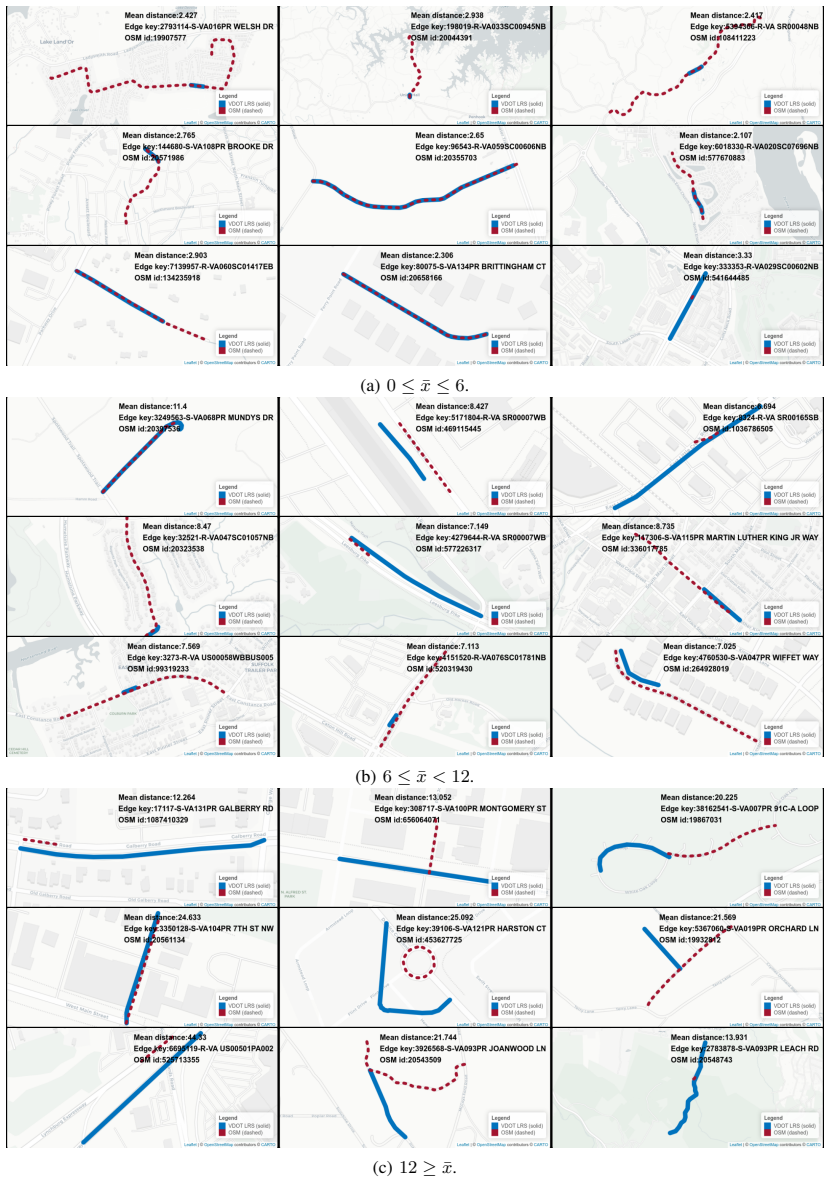
- [Section IV, Figure 4] The visual quality check is too small and too informal to support a 98% success-rate claim. Figure 4 samples only nine edges per x̄ bin, and the caption notes that map-scale differences make distances hard to compare and that some matches with x̄ ≥ 12 m 'may be acceptable.' Manual review of major routes is mentioned but not quantified: the reader is not told how many routes or edges were manually inspected, how many errors were found, or how disagreements were adjudicated. The authors should report the coverage and results of the manual review as a number (e.g., edges reviewed, errors found, error types), or state explicitly that the reported 98% is based only on the pointwise-distance criterion.
- [Section III and Table I] The success threshold and the interpolation gap are both 12 meters, and no sensitivity analysis is provided. Since Valhalla's map_snap returns a matched point for every submitted point, the fraction of edges below any threshold will depend monotonically on the threshold; the choice of 12 m appears arbitrary. The paper should report the success rate for a range of thresholds (e.g., 5 m, 10 m, 15 m, 20 m) and, ideally, show a cumulative distribution curve, so that the reader can judge how the headline percentage depends on this processing choice.
- [Section II.B and Section IV] The abstract and Section V claim that the 98% success rate is 'an improvement over most automated processes currently available for this type of conflation,' but no quantitative comparison with any existing conflation method (NetMatcher, DSO, SimMatching, the optimization-based methods cited in Section II.B) is presented. The background section lists methods but does not compare their accuracy on the same data or on comparable benchmarks. The authors should either add a comparison with at least one baseline method on a common subset of the Virginia data, or remove/qualify the improvement claim.
- [Section III, Algorithm 1] The direction-of-travel correction for non-prime, southbound, and westbound routes is a load-bearing heuristic, but the paper gives no validation that the rule is correct for all route categories. The rule assumes that non-prime routes always have mileposts ordered opposite to travel direction, which may not hold for every VDOT route type (e.g., overlapping routes, unsigned routes, or routes with unusual designations). The authors should report how many routes were affected by this rule and whether any post-processing checks confirmed that the reversed order produced correct matches; otherwise, a wrong direction assignment would silently corrupt the conflation key for those routes.
minor comments (5)
- [Section IV, Figure 4 caption] The phrase '12≥x̄' should be 'x̄ ≥ 12' for consistency, and the caption contains the typo 'illistrates' instead of 'illustrates.'
- [Section IV, Figure 3 caption] The vertical lines are labeled 'M' and 'M + s' in the caption, but the caption does not define these symbols; presumably they are the median and median plus standard deviation, which should be stated explicitly.
- [Section IV, Figure 5] The figure contains multiple panels with 'N = ...' counts and '< 12 m = ...%' values, but the text does not describe the panel layout or define the categories clearly; the category labels near the bottom of the figure are difficult to associate with individual panels. Please add a legend or a table that matches each route category to its N and percentage.
- [Table I] The header 'Edges<12¯x' is unclear; it should read 'Edges with x̄ < 12 m' and the units of x̄ should be stated in the table caption.
- [Data and Resources] The GitHub repository and interactive visualization are valuable, but the paper only gives URLs; for archival stability, the authors should provide a persistent identifier (e.g., a DOI or Zenodo record) for the conflation key and code.
Circularity Check
Headline 98.28% success is computed from Valhalla's own matched points, making the quantitative success metric partially self-confirming; no load-bearing circular derivation elsewhere.
-
other
[Section IV (Results), Table I; Section III (Methodology, map_snap output)]
"To ascertain the quality of the matches, three approaches were used. First, the mean distance, ¯x, between the original and the matched points was calculated for each edge. ... The output from the Valhalla API provides a matched coordinate along the centerline of an OSM roadway for every submitted coordinate."
The 'matched points' are Valhalla's own output for the very routes being scored. Valhalla's HMM/Viterbi inference is designed to place each submitted LRS point on a nearby OSM segment, so the mean distance from input to matched point is an in-sample convergence measure, not an independent ground-truth check. Table I's headline 'Edges<12 ¯x 1,752,341 (98.28%)' is therefore the fraction of edges whose Valhalla output happened to lie within 12 m of the input, not the fraction of edges verified to be the correct OSM segment. The paper itself documents wrong-but-close cases (reversible expressway mismatch; highway points conflated to service roadways), and the 12 m success threshold matches the preprocessing interpolation gap, so the statistic is shaped by the pipeline's own choices.
full rationale
The pipeline is self-contained: no load-bearing self-citations, imported uniqueness theorems, or ansatz smuggled via citation are present, and the conflation key is released openly. The identified concern is not a derivation that equals its input by construction, but a validation metric that is partially self-referential: the quantitative claim 'over 98% successful matches' is computed from distances between the LRS input points and the same Valhalla map-matching output being evaluated. Because Valhalla's HMM/Viterbi search is specifically designed to snap points to nearby roadways, low mean distance is partly an artifact of the algorithm's own objective rather than evidence of correct segment selection. The paper's documented failures (reversible expressways, highway-to-service-road conflation) show cases where the distance metric can miss topological errors. However, the paper also includes qualitative visual checks and manual review of major routes, and it does not hide its failure modes, so the circularity is moderate rather than complete. Score 4 reflects one partially self-confirming success metric without a full reduction of the contribution to its inputs.
Assumptions & free parameters
free parameters (2)
- 12-meter threshold for interpolation and success =
12 m
- 10-meter interpolation interval =
10 m
assumptions (4)
- domain assumption The LRS geometry can be treated as a sequence of noisy GPS-like observations for Valhalla's HMM map-matching.
- domain assumption The route direction rule (multiply M by -1 for non-prime southbound or westbound routes) correctly orients all VDOT LRS routes.
- domain assumption OSM contains the corresponding roadway for every LRS route that should be matched.
- ad hoc to paper The mean distance between original and matched points is a valid proxy for conflation quality.
Cite this review
Pith. "Pith review of Automated Route-based Conflation Between Linear Referencing System Maps And OpenStreetMap Using Open-source Tools." pith.science (2026). https://pith.science/paper/ND7I3XUY
@misc{pith2026250713939,
  author       = {Pith},
  title        = {Pith review of: Automated Route-based Conflation Between Linear Referencing System Maps And OpenStreetMap Using Open-source Tools},
  year         = {2026},
  howpublished = {\url{https://pith.science/paper/ND7I3XUY}},
  note         = {Machine review of arXiv:2507.13939}
}
read the original abstract
Transportation researchers and planners utilize a wide range of roadway metrics that are usually associated with different basemaps. Conflation is an important process for transferring these metrics onto a single basemap. However, conflation is often an expensive and time-consuming process based on proprietary algorithms that require manual verification. In this paper, an automated open-source process is used to conflate two basemaps: the linear reference system (LRS) basemap produced by the Virginia Department of Transportation and the OpenStreetMap (OSM) basemap for Virginia. This process loads one LRS route at a time, determines the correct direction of travel, interpolates to fill gaps larger than 12 meters, and then uses Valhalla's map-matching algorithm to find the corresponding points along OSM's segments. Valhalla's map-matching process uses a Hidden Markov Model (HMM) and Viterbi search-based approach to find the most likely OSM segments matching the LRS route. This work has three key contributions. First, it conflates the Virginia roadway network LRS map with OSM using an automated conflation method based on HMM and Viterbi search. Second, it demonstrates a novel open-source processing pipeline that could be replicated without the need for proprietary licenses. Finally, the overall conflation process yields over 98% successful matches, which is an improvement over most automated processes currently available for this type of conflation.
Figures


Figures from the paper (4 more)


Forward citations
Cited by 1 Pith paper
-
KRAFT: A Knowledge Graph-Based Framework for Automated Map Conflation
KRAFT represents maps as knowledge graphs, learns to match their objects with graph neural networks, and merges unmatched objects with mixed-integer programming while avoiding overlaps.
Reference graph
Works this paper leans on
-
[1]
All road network of linear referenced data reference manual,
J. Hausman, T. Roff, and J. Clarke, “All road network of linear referenced data reference manual,”Federal Highway Administration (FHWA), DOT Contract# GS-35F-0001P, 2014
work page 2014
-
[2]
Conflation automated map compilation,
A. Saalfeld, “Conflation automated map compilation,”International Journal of Geographical Information System, vol. 2, no. 3, pp. 217– 228, 1988. Publisher: Taylor & Francis
work page 1988
-
[3]
Matching networks with different levels of detail,
S. Musti `ere and T. Devogele, “Matching networks with different levels of detail,”GeoInformatica, vol. 12, pp. 435–453, 2008. Publisher: Springer
work page 2008
-
[4]
M. Zhang and L. Meng, “Delimited stroke oriented algorithm-working principle and implementation for the matching of road networks,” Geographic Information Sciences, vol. 14, no. 1, pp. 44–53, 2008. Publisher: Taylor & Francis
work page 2008
-
[5]
SimMatching: adaptable road net- work matching for efficient and scalable spatial data integration,
M. Sch ¨afers and U. W. Lipeck, “SimMatching: adaptable road net- work matching for efficient and scalable spatial data integration,” in Proceedings of the 1st ACM SIGSPATIAL PhD workshop, pp. 1–5, 2014
work page 2014
-
[6]
Matching spatial data sets: a statistical approach,
V . Walter and D. Fritsch, “Matching spatial data sets: a statistical approach,”International Journal of geographical information science, vol. 13, no. 5, pp. 445–473, 1999. Publisher: Taylor & Francis
work page 1999
-
[7]
An optimisation model for linear feature matching in geographical data conflation,
L. Li and M. F. Goodchild, “An optimisation model for linear feature matching in geographical data conflation,”International Journal of Image and Data Fusion, vol. 2, no. 4, pp. 309–328, 2011. Publisher: Taylor & Francis
work page 2011
-
[8]
A linear road object matching method for conflation based on optimization and logistic regression,
X. Tong, D. Liang, and Y . Jin, “A linear road object matching method for conflation based on optimization and logistic regression,” International Journal of Geographical Information Science, vol. 28, no. 4, pp. 824–846, 2014. Publisher: Taylor & Francis
work page 2014
Show all 16 references
-
[9]
Hidden Markov map matching through noise and sparseness,
P. Newson and J. Krumm, “Hidden Markov map matching through noise and sparseness,” inProceedings of the 17th ACM SIGSPATIAL international conference on advances in geographic information sys- tems, pp. 336–343, 2009
2009
-
[10]
Valhalla,
Valhalla Contributors, “Valhalla,” 2025. MIT License
2025
-
[11]
A practical guide to an open-source map- matching approach for big GPS data,
S. Saki and T. Hagen, “A practical guide to an open-source map- matching approach for big GPS data,”SN Computer Science, vol. 3, no. 5, p. 415, 2022. Publisher: Springer
2022
-
[12]
Extracting insights from large-scale telematics data for ITS appli- cations: Lessons and recommendations,
G. Ali, N. Feierabend, P. Doshi, C. Winkowski, and M. Fontaine, “Extracting insights from large-scale telematics data for ITS appli- cations: Lessons and recommendations,” inProceedings of the IEEE international conference on intelligent transportation systems (ITSC), (Gold Co...
2025
-
[13]
Characterizing Human Driving Behavior Through an Analysis of Naturalistic Driving Data,
G. Ali, “Characterizing Human Driving Behavior Through an Analysis of Naturalistic Driving Data,” Jan. 2023. Publisher: Virginia Tech
2023
-
[14]
The surface accelerations reference—a large-scale, interactive catalog of passenger vehicle ac- celerations,
G. Ali, S. McLaughlin, and M. Ahmadian, “The surface accelerations reference—a large-scale, interactive catalog of passenger vehicle ac- celerations,”IEEE Transactions on Intelligent Transportation Systems, vol. 24, no. 9, pp. 9031–9040, 2023
2023
-
[15]
Quantifying the effect of roadway, driver, vehicle, and location characteristics on the frequency of longitudinal and lateral accelerations,
G. Ali, S. McLaughlin, and M. Ahmadian, “Quantifying the effect of roadway, driver, vehicle, and location characteristics on the frequency of longitudinal and lateral accelerations,”Accident Analysis & Preven- tion, vol. 161, p. 106356, Oct. 2021
2021
-
[16]
Summarizing normative driving behavior from large-scale NDS datasets for vehicle system development,
G. Beale and G. Ali, “Summarizing normative driving behavior from large-scale NDS datasets for vehicle system development,” inProceed- ings of the IEEE international conference on intelligent transportation systems (ITSC), (Gold Coast, Australia), 2025
2025
Reviewed August 6, 2026 · model on record in the stance chip above.
Discussion (0). Continue with ORCID to comment.