REVIEW 5 major objections 6 minor 4 cited by
FinChart-Bench: Benchmarking Financial Chart Comprehension in Vision-Language Models
T0 review · 5 major / 6 minor · reviewed 2026-08-06 · deepseek-v4-flash
Pith's one-line read Vision-language models are not yet reliable readers of real-world financial charts, a new 7,016-question benchmark argues.
desk verdict FinChart-Bench is a genuinely useful finance-chart benchmark with a clean single-token eval design; the main caveat is that the human verification is author-only and unmeasured, so the 'LVLMs are unreliable' claim should be read as provisional. read the letter →
The pith
A machine-rendered reading of the paper's core claim, the machinery that carries it, and where it could break.
The reading
What carries the argument
The benchmark itself is the load-bearing object. Each chart is annotated with up to six questions whose answers are constrained to a single token: 'True' or 'False', a letter from A to D, or a bare number. This design makes Exact Match a sufficient metric, which the paper argues removes the ambiguity of free-form chart benchmarks and their reliance on expensive model-based grading. The pipeline that produced the benchmark is also part of the machinery: Qwen2.5-VL extracts chart candidates from PDF slides, GPT-4.1 generates candidate question-answer pairs, and two rounds of manual review filter charts and correct answers.
What would settle it
Re-annotate a random subset of the 7,016 questions with independent finance-literate readers who are blind to the published ground truth. If their exact-match agreement with the published answers is notably below ceiling, the benchmark's ground truth, and therefore every model score derived from it, would be called into question, and the paper's conclusion about model capability would not follow.
Extended reading notes
Core claim
The central claim is that FinChart-Bench supplies the first dedicated measurement of how well vision-language models read real-world financial charts, and that this measurement shows current models failing at the tasks that matter. Advanced closed-source models such as Claude Sonnet 4, o3, and Gemini 2.5 Pro average between 83 and 84 percent overall because True/False and Multiple Choice are easy for them, yet their best numerical reasoning scores sit near 60 percent. The same pattern appears across families: values that are printed next to bars or line points are read well, while values that require aligning a visual element with an axis are read poorly. The paper therefore claims that the bottleneck in financial chart comprehension is not symbol recognition but spatial reasoning, and that benchmark construction should not yet be delegated to these models.
Load-bearing premise
The benchmark's correctness rests on the authors' own manual review of every question-answer pair; no independent or second-annotator check is reported, so any systematic error that review missed would propagate into every model score and comparative finding.
Editorial extensions
If this is right
- Any pipeline that uses a vision-language model to generate or grade a new benchmark should budget for full human correction, because the paper shows even leading models fail on instruction following and spatial alignment.
- Chart-specialized fine-tuning can backfire: the five chart-finetuned models evaluated score near zero on multiple choice, suggesting aggressive specialization erodes general instruction-following.
- Benchmark designers can evaluate financial chart reasoning with single-token answers and exact match, avoiding costly and inconsistent model-based evaluation.
- For basic True/False and Multiple Choice on financial charts, strong open-source models now match closed-source models, so cost-sensitive deployments can choose smaller open models.
- Models that score well on charts with printed numeric labels cannot be assumed to reason about charts generally; scores drop sharply when values must be read from axes.
Reading between the lines
- A natural extension the authors do not run is to take the same charts and remove the printed numbers from 'Bar with num' and 'Line with num' charts; if accuracy collapses, their spatial-alignment diagnosis would be confirmed.
- The near-60-percent ceiling across very different model families suggests the QA task may be measuring a shared inductive bias rather than per-model skill; a per-question error analysis across families would reveal whether the same items are missed by all models.
- The paper's own numbers imply a practical rule for benchmark construction: question generation by a strong model plus full human correction can yield clean data, but only at a cost of roughly 80 reviewed pairs per annotator hour, which makes scaling to hundreds of thousands of items impractical.
Editorial analysis
A structured set of objections, weighed in public.
Referee Report
Summary. The paper introduces FinChart-Bench, a benchmark of 1,200 real-world financial chart images collected from corporate slide decks spanning 2015-2024, annotated with 7,016 True/False (TF), Multiple Choice (MC), and numerical Question Answering (QA) items whose ground-truth answers are designed to be single-token. The construction pipeline uses Qwen2.5-VL for chart extraction from PDFs, GPT-4.1 for QA generation, and two rounds of manual review by the authors. The paper evaluates 25 LVLMs (open-source, chart-finetuned, and closed-source) using Exact Match and reports several findings: narrowing open/closed-source performance gaps, performance degradation in some upgraded model families, weak instruction following in smaller models, a spatial-reasoning bottleneck on certain chart types, and the conclusion that current LVLMs are not reliable enough to serve as automated benchmark evaluators.
Significance. If the benchmark's ground truth is valid, FinChart-Bench fills a real gap: no prior chart benchmark focuses specifically on real-world financial charts, and the single-token answer design makes evaluation simpler and more reproducible than free-form chart QA benchmarks. The two-round manual review is a strength, and the breadth of the 25-model evaluation is useful. The paper's headline conclusions, however, are only as strong as the validation evidence for the ground-truth labels and the statistical support for the model comparisons; both are currently underreported. The dataset release and the detailed pipeline description are valuable contributions even if some of the interpretive claims need revision.
major comments (5)
- [§3.3 and §3.1 (QA Evaluation & Correction)] The validity of every model score depends on the ground truth, but §3.3 reports only that 'all manual annotations were conducted by the authors' and gives no inter-annotator agreement, no external audit, and no statistics on how many of the 7,200 GPT-4.1-generated QA pairs were corrected; only the 184 removals are reported in §3.1. Because the paper's central conclusion is that current LVLMs are not reliable evaluators, this is a load-bearing gap: if the author review missed systematic errors in GPT-4.1's questions or answers, all 25 model scores inherit those errors, and the 'unreliable models' claim is confounded with an 'unreliable benchmark' claim. Please report correction counts by task, double-annotate a sample and measure agreement, and include a human performance baseline on a subsample so that model scores around 60% can be interpreted.
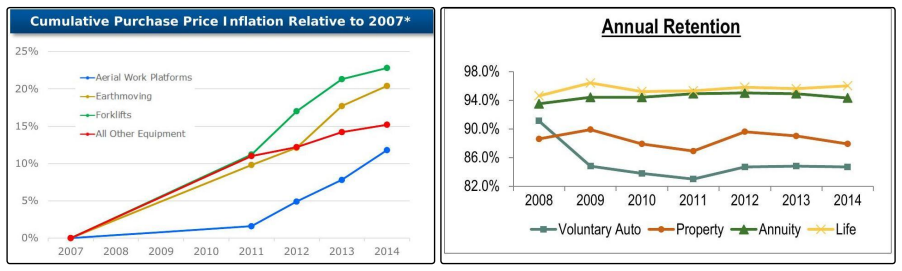
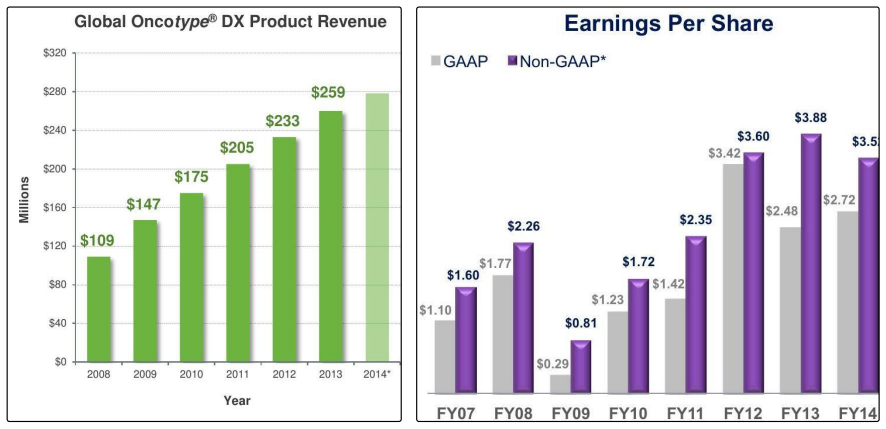
- [§5.4, Figures 2b and 3] The spatial-reasoning conclusion is based on per-chart-type accuracy differences, but several chart types contain only 1% of 1,200 charts (12 images each): 'Line with scatter', 'Bar with area', 'Horizontal bar', 'Histogram', 'Line with area', and 'Area'. With such small samples and no confidence intervals or statistical tests, the observed pattern (low QA accuracy on Line/Bar/Area charts, high accuracy on Line with num/Bar with num charts) may be noise. Report per-type sample sizes and either confidence intervals or a statistical comparison (e.g., stratified bootstrap) before claiming a shared spatial-reasoning bottleneck.
- [§5.3 and §4.3] The paper attributes the low TF/MC scores of small models and chart-finetuned models to weak instruction following, but it never reports the fraction of responses that violated the 'Result = [[answer]]' format or produced no parseable answer. Since Exact Match counts any format violation as wrong, the instruction-following failure rate is not separable from comprehension failure. Please report parse-failure rates per model and, as a sanity check, rescore a subset with a relaxed parser that accepts correct answers in arbitrary formats.
- [§5.1 and Table 2] Several headline comparisons and the 'performance bottleneck' claim rest on small average-score differences (e.g., Claude Sonnet 4 at 84.32% vs. o3 at 83.89% vs. Gemini 2.5 Pro at 83.73%; Mistral 3.1 at 74.37% vs. Qwen2.5 VL at 72.16%) without significance testing, confidence intervals, or repeated-run variance. These differences may be within noise for 7,016 questions spread across 25 models. A paired bootstrap or McNemar-style test on per-question responses is needed before concluding that closed-source models have converged to a performance bottleneck or that observed 'family gaps' are meaningful.
- [§3.1 (Chart Filtering)] The benchmark claims to represent real-world financial charts, but the final 1,200 images were manually selected as 'the highest-quality' charts per year after discarding borderline cases, and no analysis is given of how this selection changes the chart-type or difficulty distribution relative to the roughly 71,000 retained charts. The resulting type distribution is heavily skewed (40% 'Bar with num', 26% 'Bar with line'), so per-type findings may reflect curation choices rather than real-world frequency. Please report the pre-selection type distribution, state the selection criteria more operationally, and discuss this as a limitation.
minor comments (6)
- [§4.1] The text says there are 12 general-purpose open-source models, but the list contains 13 names and Table 2 also shows 13 open-source rows; the count should be corrected.
- [References and Table 2] The reference for 'Claude Sonnet 4' is given as 'Claude 3.5 sonnet' (Anthropic, 2025), which does not match the evaluated model; the reference and the model name should be aligned.
- [Table 1] The 'Quest Type' entry for FinChart-Bench says 'Free-form', which is inconsistent with the paper's single-token answer design; 'Mixed' or 'TF/MC/QA' would be more accurate.
- [§4.2, Eq. (1)] The variables X, Y, and Z in Eq. (1) are not defined in the surrounding text; please state explicitly that they are the numbers of TF, MC, and QA questions.
- [Figures 3 and 18] The TF/MC/QA color coding may be difficult to distinguish in grayscale or for color-blind readers; adding direct labels or distinct hatching patterns would improve readability.
- [Table 2 and §4.1] There are minor naming inconsistencies such as 'Sa2V A' instead of 'Sa2VA' and mixed capitalization of 'LLaMa'/'Llama'/'LLaVa'; please standardize throughout.
Circularity Check
No circular derivation: the benchmark is human-reviewed and the LVLM scores are direct measurements; the only concern is a minor, non-load-bearing self-citation.
full rationale
FinChart-Bench is a dataset-construction and evaluation paper rather than a formal derivation, and no load-bearing step reduces to its own input. Ground-truth QA pairs are initially produced by GPT-4.1, but Section 3.3 describes a second human pass in which 'each QA pair was individually assessed by a human' and 'For pairs with a correct question but an incorrect answer, we manually corrected the answer'; the 184 removed pairs and any corrected answers are not part of the original model output, so the final benchmark is not identical to the generator's output. The headline findings (QA accuracy near 60%, spatial-reasoning deficits, instruction-following failures) are direct Exact Match measurements on that human-reviewed benchmark and do not fit any parameter that is later renamed as a prediction. No uniqueness theorem or ansatz is imported from prior work; the only overlapping-author citation, Shu et al. (2025) in Section 2.1, is a background survey reference and is not load-bearing. The admitted author-only annotation (Section 3.3) is a validity limitation — no inter-annotator agreement or human test-time baseline is reported — but it concerns measurement quality, not circularity of the evaluation logic. Score 2 reflects the single minor background self-citation; the central empirical claims remain independent.
Assumptions & free parameters
free parameters (1)
- charts per year retained after manual selection =
120
assumptions (3)
- domain assumption Two-pass manual review by the authors is sufficient to guarantee accurate ground-truth answers.
- domain assumption The 1,200 hand-picked charts represent the broad category of real-world financial charts.
- domain assumption Strict exact match on single-token answers is a fair measure of model competence.
Cite this review
Pith. "Pith review of FinChart-Bench: Benchmarking Financial Chart Comprehension in Vision-Language Models." pith.science (2026). https://pith.science/paper/P6XGOTRK
@misc{pith2026250714823,
  author       = {Pith},
  title        = {Pith review of: FinChart-Bench: Benchmarking Financial Chart Comprehension in Vision-Language Models},
  year         = {2026},
  howpublished = {\url{https://pith.science/paper/P6XGOTRK}},
  note         = {Machine review of arXiv:2507.14823}
}
read the original abstract
Large vision-language models (LVLMs) have made significant progress in chart understanding. However, financial charts, characterized by complex temporal structures and domain-specific terminology, remain notably underexplored. We introduce FinChart-Bench, the first benchmark specifically focused on real-world financial charts. FinChart-Bench comprises 1,200 financial chart images collected from 2015 to 2024, each annotated with True/False (TF), Multiple Choice (MC), and Question Answering (QA) questions, totaling 7,016 questions. We conduct a comprehensive evaluation of 25 state-of-the-art LVLMs on FinChart-Bench. Our evaluation reveals critical insights: (1) the performance gap between open-source and closed-source models is narrowing, (2) performance degradation occurs in upgraded models within families, (3) many models struggle with instruction following, (4) both advanced models show significant limitations in spatial reasoning abilities, and (5) current LVLMs are not reliable enough to serve as automated evaluators. These findings highlight important limitations in current LVLM capabilities for financial chart understanding. The FinChart-Bench dataset is available at https://huggingface.co/datasets/Tizzzzy/FinChart-Bench.
Figures


Figures from the paper (15 more)





Forward citations
Cited by 4 Pith papers
-
PyFi: Toward Pyramid-like Financial Image Understanding for VLMs via Adversarial Agents
PyFi generates a 600K pyramid QA dataset for financial images using adversarial MCTS agents, allowing fine-tuned VLMs to decompose complex questions and achieve 19.52% and 8.06% accuracy gains on Qwen2.5-VL models.
-
IPO-Mine: A Toolkit and Dataset for Section-Structured Analysis of Long, Multimodal IPO Documents
IPO-Mine releases a toolkit and large multimodal dataset for structured analysis of IPO filings and shows state-of-the-art models diverge from human judgments on chart quality and misleadingness.
-
MoCA-Agent: A Market-of-Claims Code Agent for Financial and Numerical Reasoning
MoCA-Agent decomposes questions into typed atomic claims, clears them via trader-agent markets into confidence-weighted decisions, synthesizes and verifies executable Python code, and reports strong benchmark scores i...
-
AI Trading: Evaluating Large Language Models for Technical Market Analysis
A comparative evaluation claims GPT-4 Turbo and FinGPT outperformed the S&P 500 in a 2023 simulated backtest, but flawed baselines and missing code/data undermine the result.
Reference graph
Works this paper leans on
-
[5]
arXiv preprint arXiv:2410.21276
Gpt-4o system card. arXiv preprint arXiv:2410.21276. Kushal Kafle, Brian Price, Scott Cohen, and Christo- pher Kanan
-
[8]
arXiv preprint arXiv:2403.00231
Multimodal arxiv: A dataset for improving scientific comprehen- sion of large vision-language models. arXiv preprint arXiv:2403.00231. Shengzhi Li and Nima Tajbakhsh
-
[9]
arXiv preprint arXiv:2308.03349
Scigraphqa: A large-scale synthetic multi-turn question-answering dataset for scientific graphs. arXiv preprint arXiv:2308.03349. Fangyu Liu, Francesco Piccinno, Syrine Krichene, Chenxi Pang, Kenton Lee, Mandar Joshi, Yasemin Altun, Nigel Collier, and Julian Martin Eisen- schlos
-
[10]
https://huggingface.co/google/ matcha-chartqa
Matcha: Enhancing visual lan- guage pretraining with math reasoning and chart derendering. https://huggingface.co/google/ matcha-chartqa. Fuxiao Liu, Xiaoyang Wang, Wenlin Yao, Jianshu Chen, Kaiqiang Song, Sangwoo Cho, Yaser Yacoob, and Dong Yu. 2023a. Mmc: Advancing multimodal chart understanding with large-scale instruction tun- ing. arXiv preprint arXi...
-
[11]
arXiv preprint arXiv:2310.02255
Mathvista: Evaluating mathematical reasoning of foundation models in visual contexts. arXiv preprint arXiv:2310.02255. Ahmed Masry, Parsa Kavehzadeh, Xuan Long Do, Enamul Hoque, and Shafiq Joty
-
[12]
arXiv preprint arXiv:2305.14761
Unichart: A universal vision-language pretrained model for chart comprehension and reasoning. arXiv preprint arXiv:2305.14761. Ahmed Masry, Do Xuan Long, Jia Qing Tan, Shafiq Joty, and Enamul Hoque
-
[13]
arXiv preprint arXiv:2203.10244
Chartqa: A benchmark for question answering about charts with visual and logical reasoning. arXiv preprint arXiv:2203.10244. Ahmed Masry, Mehrad Shahmohammadi, Md Rizwan Parvez, Enamul Hoque, and Shafiq Joty. 2024a. Chartinstruct: Instruction tuning for chart compre- hension and reasoning. https://huggingface.co/ ahmed-masry/ChartInstruct-LLama2. Ahmed Ma...
-
[14]
arXiv preprint arXiv:2401.02384
Char- tassisstant: A universal chart multimodal language model via chart-to-table pre-training and multitask instruction tuning. arXiv preprint arXiv:2401.02384. Meta
Show all 22 references
-
[15]
https://platform.openai
Gpt-4o. https://platform.openai. com/docs/models/gpt-4o. OpenAI. 2025a. Introducing gpt-4.1 in the api. https: //platform.openai.com/docs/models/gpt-4.1. OpenAI. 2025b. Introducing gpt-4.1 in the api. https://platform.openai.com/docs/models/ gpt-4.1-mini. OpenAI. 2025c. Introd...
2025
-
[16]
arXiv preprint arXiv:2501.01346
Large vision-language model alignment and misalignment: A survey through the lens of explainability. arXiv preprint arXiv:2501.01346. Qwen Team
-
[17]
Qwen2.5-vl. Peng Wang, Shuai Bai, Sinan Tan, Shijie Wang, Zhi- hao Fan, Jinze Bai, Keqin Chen, Xuejing Liu, Jialin Wang, Wenbin Ge, Yang Fan, Kai Dang, Mengfei Du, Xuancheng Ren, Rui Men, Dayiheng Liu, Chang Zhou, Jingren Zhou, and Junyang Lin. 2024a. Qwen2-vl: Enhancing visio...
-
[18]
https://github.com/ huggingface/nanoVLM
nanovlm. https://github.com/ huggingface/nanoVLM. Yifan Wu, Lutao Yan, Leixian Shen, Yunhai Wang, Nan Tang, and Yuyu Luo. 2024a. Chartinsights: Evaluating multimodal large language models for low-level chart question answering. arXiv preprint arXiv:2405.07001. Zhiyu Wu, Xiaoka...
-
[19]
arXiv preprint arXiv:2402.12185
Chartx & chartvlm: A versatile benchmark and founda- tion model for complicated chart reasoning. arXiv preprint arXiv:2402.12185. Peng Xu, Wenqi Shao, Kaipeng Zhang, Peng Gao, Shuo Liu, Meng Lei, Fanqing Meng, Siyuan Huang, Yu Qiao, and Ping Luo
-
[20]
arXiv preprint arXiv:2312.15915
Chartbench: A bench- mark for complex visual reasoning in charts. arXiv preprint arXiv:2312.15915. Haobo Yuan, Xiangtai Li, Tao Zhang, Zilong Huang, Shilin Xu, Shunping Ji, Yunhai Tong, Lu Qi, Jiashi Feng, and Ming-Hsuan Yang
-
[21]
arXiv preprint arXiv:2406.12742
Benchmarking multi- image understanding in vision and language models: Perception, knowledge, reasoning, and multi-hop rea- soning. arXiv preprint arXiv:2406.12742. Deyao Zhu, Jun Chen, Xiaoqian Shen, Xiang Li, and Mohamed Elhoseiny
-
[22]
Qwen2.5- VL-7B-Instruct
Minigpt-4: Enhancing vision-language understanding with advanced large language models. arXiv preprint arXiv:2304.10592. A Examples of the Prompt Used A.1 Prompt Used in Chart Extraction As illustrated in Figure 1b, we use the “Qwen2.5- VL-7B-Instruct” model to extract all cha...
-
[2017]
arXiv preprint arXiv:1710.07300
Figureqa: An annotated fig- ure dataset for visual reasoning. arXiv preprint arXiv:1710.07300. Shankar Kantharaj, Rixie Tiffany Ko Leong, Xiang Lin, Ahmed Masry, Megh Thakkar, Enamul Hoque, and Shafiq Joty
-
[2021]
arXiv preprint arXiv:2110.11624
Scicap: Generating captions for scien- tific figures. arXiv preprint arXiv:2110.11624. Anwen Hu, Yaya Shi, Haiyang Xu, Jiabo Ye, Qinghao Ye, Ming Yan, Chenliang Li, Qi Qian, Ji Zhang, and Fei Huang
-
[2022]
arXiv preprint arXiv:2203.06486
Chart-to-text: A large-scale benchmark for chart summarization. arXiv preprint arXiv:2203.06486. Junnan Li, Dongxu Li, Caiming Xiong, and Steven Hoi
-
[2023]
arXiv preprint arXiv:2311.16483
Chartllama: A multimodal llm for chart understanding and generation. arXiv preprint arXiv:2311.16483. Ting-Yao Hsu, C Lee Giles, and Ting-Hao’Kenneth’ Huang
-
[2024]
arXiv preprint arXiv:2404.07214
Exploring the fron- tier of vision-language models: A survey of current methodologies and future directions. arXiv preprint arXiv:2404.07214. Google. 2025a. [link]. Google. 2025b. Medgemma hugging face. https:// huggingface.co/google/medgemma-4b-it. Yucheng Han, Chi Zhang, Xin...
- [2025]
Reviewed August 6, 2026 · model on record in the stance chip above.
Discussion (0). Sign in to comment.