REVIEW 3 major objections 6 minor 39 references
Saturn's G ring: insights from the dynamical evolution of dust particles from the G-ring arc
T0 review · 3 major / 6 minor · reviewed 2026-08-06 · deepseek-v4-flash
Pith's one-line read Dust escaping the G-ring arc can reproduce Saturn's G ring.
desk verdict A competent, clearly written dust-dynamics study whose headline I/F match is a fit, not a prediction; solid new numbers but the plasma erosion assumptions need a sensitivity sweep. read the letter →
The pith
A machine-rendered reading of the paper's core claim, the machinery that carries it, and where it could break.
The reading
What carries the argument
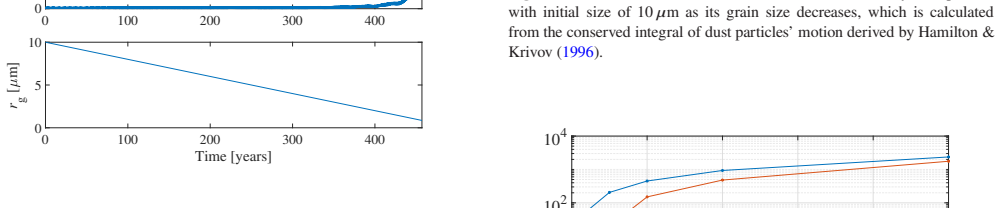
The central object is the swarm of 0.1–50 µm dust grains launched from the 7:6 corotation eccentricity resonance arc at the G ring's inner edge, initialized near Aegaeon's orbit and tracked until the grains are sputtered away, collide with a moon or the A ring, or leave the system. The argument is carried by the coupling of orbital drift and erosion: plasma sputtering shrinks every grain at the fixed rate $r_g(t)=r_{g0}-t/(50\times10^{-6})$ m/yr, plasma drag pushes grains outward after they escape the arc, and a conserved integral of the dust motion relates shrinking grain size to the maximum eccentricity that eventually drives grains into the A ring. The fitting identity is the power-law size distribution $n(r_g)\,dr_g = C_0\,r_g^{-q}\,dr_g$, whose simulated trajectories are converted into normal $I/F$, number density, and optical depth through scattering efficiencies computed for spherical dust grains and grid-cell counting.
What would settle it
Rerun the simulation with a size-dependent plasma sputtering yield and with molecular oxygen ions included in the plasma drag; if the resulting normal $I/F$ no longer matches the Cassini profiles for any power-law exponent, the arc-origin claim fails. An observational check is to resolve the edge-on ring: the peak optical depth should be near $3.9\times10^{-2}$ and the apparent thickness near 9,000 km at threshold $10^{-8}$.
Extended reading notes
Core claim
The paper's central claim is that dust produced in the G-ring arc and eroded by plasma sputtering can populate the entire G ring and match the brightness Cassini measured. The claim is made quantitative by a differential size distribution $n(r_g)\,dr_g = C_0\,r_g^{-q}\,dr_g$ with $q=2.8$ and $C_0=4.0$; with that distribution, the simulated normal $I/F$ matches the observed radial profiles in both arc and non-arc longitudes, and the simulated vertical number density matches Cassini's in-situ measurements near $2.7\,R_s$. The same simulated population yields a peak edge-on geometric optical depth of $3.9\times10^{-2}$, an apparent edge-on thickness of about $9{,}000$ km at an optical-depth threshold of $10^{-8}$, a dust production rate of $5.4\times10^{-2}$ kg/s, a ring age of $10^6$–$10^7$ years, and a remaining lifetime of order $10^4$ years.
Load-bearing premise
The load-bearing assumption is that plasma sputtering erodes every dust grain at the same rate, equal to Saturn's E-ring value, regardless of grain size, and that plasma drag comes only from water-group ions; that assumption controls how quickly grains shrink, when they leave the arc, and every derived ring property.
Editorial extensions
If this is right
- If the arc is the sole source, Aegaeon's own dust production (estimated at $10^{-7}$–$10^{-5}$ kg/s) is far too small to sustain the G ring, so the arc's larger debris, not the moonlet, must be the main dust factory.
- Because most grains leave the arc smaller than about 16 µm, and particles of 5–10 µm dominate the ring away from the arc, future observations should find few dust grains larger than roughly 20 µm in the main G ring.
- The predicted edge-on thickness of about 9,000 km at an optical-depth threshold of $10^{-8}$ is a resolvable shape that occultation or high-phase imaging can test directly.
- With a remaining lifetime near $10^4$ years, the G ring must be continuously resupplied from the arc; if the arc's debris were exhausted, the ring would fade on a geologically short timescale.
- The model implies that the G ring may vary seasonally, because molecular oxygen ions $\mathrm{O}_2^+$, neglected in the drag calculation, become important near Saturn's solstice and would change sputtering and transport.
Reading between the lines
- The same erosion-limited transport argument likely applies to the tenuous rings fed by the Anthe and Methone arcs, so those systems should show a similar power-law size exponent set by local sputtering and plasma drag rather than by the parent body's history.
- Integrating the fitted power law to a total dust mass and comparing it with independent estimates from occultations or thermal emission would test whether the arc really is the only significant source.
- The model does not include collisions between escaping grains and arc debris, so the true arc-to-ring mass transfer may be lower than $5.4\times10^{-2}$ kg/s; quantifying that loss would change the age and lifetime estimates.
- Because the drag and sputtering inputs are taken from Cassini-era plasma conditions, applying the same code to Jupiter's faint dust rings would test whether the fitted $q=2.8$ is a general feature of plasma-eroded arcs or specific to Saturn's G ring.
Editorial analysis
A structured set of objections, weighed in public.
Referee Report
Summary. The paper studies the dynamical evolution of micron-sized dust particles launched from Saturn's G-ring arc, under the combined action of Saturn's gravity, solar radiation pressure, Poynting-Robertson drag, Lorentz force, plasma drag, moon gravities, and plasma sputtering. Using a test-particle code, the authors integrate trajectories for nine grain sizes, classify their fates, and then synthesize the resulting ring's normal I/F, number density, edge-on optical depth, thickness, age, and lifetime by assuming a power-law size distribution. By matching the simulated peak normal I/F to Hedman et al. (2007) and the simulated vertical number density to Ye et al. (2016), they obtain a power-law exponent q = 2.8 and normalization C0 = 4.0. They report that the simulated radial I/F profiles agree with observations, and estimate the peak edge-on optical depth to be 3.9e-2, the apparent edge-on thickness about 9,000 km, the ring age 10^6-10^7 yr, and the remaining lifetime ~10^4 yr, concluding that the G ring may originate from the arc.
Significance. If the central result holds, the paper offers a coherent dynamical framework that connects the G-ring arc to the diffuse G ring and produces quantitative, falsifiable predictions for edge-on optical depth, vertical thickness, and mass-supply rate. The strengths of the manuscript are its detailed force model with parameters taken from published observations, the use of a previously tested numerical code, and the explicit acknowledgment of the O2+ plasma as an uncertainty. The main weakness is that the two key parameters q and C0 are fitted to the same observational profiles that are later presented as confirming the model, so the independent predictive content consists mainly of the profile shapes rather than their absolute normalizations; moreover, the results depend sensitively on uncertain plasma-sputtering and plasma-drag assumptions that are not yet quantified by a sensitivity study.
major comments (3)
- [Section 5, Eqs. (3)-(6), Figs. 6 and 8] The parameters q = 2.8 and C0 = 4.0 are not predicted by the dynamics; they are obtained by aligning the simulated normal I/F peak with Hedman et al. (2007) and the simulated vertical number density peak with Ye et al. (2016). Therefore the statement in the abstract that the model 'finds' a power-law exponent of 2.8 should be rephrased as 'constrained' or 'inferred.' More importantly, the agreement with observations is partly by construction: the independent content is the shape of the radial and vertical profiles, not their absolute values. To substantiate the claim that the profiles 'match well,' the authors should overlay the observed I/F profile in Fig. 6 and the observed number-density profile in Fig. 8 on the same axes and report quantitative residuals or a goodness-of-fit measure.
- [Section 2, Eq. (2), Fig. 3; Section 6] The plasma sputtering rate is assumed to be independent of grain size and equal to the E-ring value, and the plasma drag includes only W+ ions, with O2+ neglected even though Section 6 identifies O2+ as a significant plasma component near solstice. These assumptions control the grain escape size (r_escape < 16 micron in Fig. 3), the post-escape lifetimes, and hence the fitted q and all derived quantities. The authors should perform an explicit parameter sweep—varying the sputtering rate by a factor of 2-3 and adding an O2+ component—to demonstrate that q remains within the observationally allowed range and that the reported I/F and density profiles remain consistent with the data. Without such a sensitivity test, the central claim rests on unquantified plasma assumptions.
- [Section 5, Fig. 6] The simulated normal I/F in the longitude range passing through the arc peaks at 2.1e-5, about 30% higher than the observed value of 1.6e-5 quoted from Hedman et al. (2007). The paper attributes this discrepancy to neglected collisions with parent bodies in the arc. This explanation is plausible but should be backed by a simple quantitative estimate of the collision removal rate; otherwise the agreement in the arc region is not demonstrated and the statement that the simulated and observed profiles 'match well' is only partially supported.
minor comments (6)
- [Abstract and Section 5] The wording 'We find that the particle size distribution of the G ring follows a power law with an exponent of 2.8' should be changed to indicate that this exponent is inferred by fitting the model to observations, not derived from first principles.
- [Section 2, Eq. (2)] Equation (2) is typeset ambiguously; the denominator and units are unclear. The authors should write the sputtering rate explicitly as drg/dt = 2e-8 m/yr or equivalent, with rg and t in stated units, to avoid confusion.
- [Section 2 and Section 6] There is a typo: 'Poynting-Roberson drag' should be 'Poynting-Robertson drag.' Also, 'power-low distribution' in Section 5 should be 'power-law distribution.'
- [Section 5, Fig. 8] The figure caption refers to 'red line' and 'black dash line'; if the journal version is printed in grayscale, the curves should be distinguished by line styles or symbols as well.
- [Section 5, Eqs. (6)-(7)] The age and remaining-lifetime estimates depend on the assumed density of the progenitor satellite (radius 1.5-3 km), but the density is not stated. The authors should state the adopted bulk density and note how the derived age scales with it.
- [Section 5, Fig. 10] The black dash lines in Fig. 10 are described as representing the inner edge of the G ring, outer edge, and Mimas, but the caption text is incomplete; please provide the full legend in the caption.
Circularity Check
Size distribution is calibrated to the observed I/F and density peaks, and the same I/F agreement is then cited as support for the arc-origin scenario; profile shapes remain genuinely predictive.
-
fitted input called prediction
[Section 5, Eqs. (3)-(6), Figs. 6 and 8]
"By matching both the normal I/F estimated from Eq. (3) and the number density estimated from Eq. (5) with that inferred from the observations (Hedman et al. 2007; Ye et al. 2016), we get q = 2.8 and C0 = 4.0. ... With q = 2.8 and C0 = 4.0, the normal I/F profiles from our numerical simulations match well with that derived by Hedman et al. (2007), which supports that the G ring may originate from the arc."
Equation (6) assumes a power-law size distribution, and the parameters q and C0 are not derived from the dynamics but are chosen by matching the peak normal I/F of Hedman et al. (2007) and the peak vertical number density of Ye et al. (2016). The very same normal I/F observable is then exhibited as 'matching well' and used as evidence for the arc-origin claim. Thus the peak-amplitude part of the agreement is forced by construction; only the radial/vertical profile shapes and other derived quantities remain independent dynamical predictions conditional on the fitted q and C0.
full rationale
The central dynamical integration (Section 4) and the convolution in Eqs. (3)-(5) are not circular: the simulated trajectories of 0.1-50 micron grains under gravity, radiation pressure, Lorentz force, plasma drag and sputtering determine where grains go and how long they live, and these outputs are then combined with an assumed size distribution. The circular element is confined to the calibration step. The paper assumes the power-law form in Eq. (6) and sets q = 2.8 and C0 = 4.0 by fitting the peak normal I/F (Hedman et al. 2007) and the peak vertical number density (Ye et al. 2016). It then presents agreement of the same I/F observable as support for the arc-origin scenario, so the amplitude part of that agreement is tautological. The radial I/F profile shape, the arc/elsewhere contrast, the edge-on optical depth, and the edge-on thickness are genuine predictions conditional on the fitted q,C0, which is why the circularity is partial (score 6) rather than total. The self-citations to the authors' earlier 'well-tested code' are not load-bearing here; the plasma-sputtering and W+-only drag assumptions are acknowledged limitations and sensitivity concerns, not circular reasoning. The age and remaining lifetime are simple quotients involving the fitted mass-loss rate and independently adopted parent-body masses, so they do not add independent circularity.
Assumptions & free parameters
free parameters (2)
- Power-law exponent q =
2.8
- Normalization constant C0 =
4.0
assumptions (6)
- domain assumption Sputtering rate is independent of grain size and equal to the E-ring value (Eq. 2).
- domain assumption Only water-group ions W+ contribute to plasma drag; O2+ is neglected.
- domain assumption Dust grains do not collide with parent debris inside the arc.
- domain assumption Initial semimajor axes are within 31 km of Aegaeon and mean longitudes within 30 degrees of the arc center; other elements equal Aegaeon's.
- domain assumption Dust size distribution is the differential power law n(rg) = C0 rg^-q over [0.1, 50] micrometers.
- domain assumption Grain surface electric potential is constant at -2 V throughout the ring region.
Cite this review
Pith. "Pith review of Saturn's G ring: insights from the dynamical evolution of dust particles from the G-ring arc." pith.science (2026). https://pith.science/paper/R5OGZH4Z
@misc{pith2026250715721,
  author       = {Pith},
  title        = {Pith review of: Saturn's G ring: insights from the dynamical evolution of dust particles from the G-ring arc},
  year         = {2026},
  howpublished = {\url{https://pith.science/paper/R5OGZH4Z}},
  note         = {Machine review of arXiv:2507.15721}
}
abstract
To explore the formation and properties of Saturn's G ring, we study the dynamics of micron-sized dust particles originating from the arc of debris near the inner edge of the ring. The dynamical evolution of particles due to various perturbation forces and the plasma sputtering that erodes the particles is simulated by a well-tested numerical code. Based on the simulation results, the normal $I/F$ of the G ring observed by the Cassini spacecraft can be explained by dust particles originating from the arc. Other properties of the G ring are also estimated, including the steady-state size distribution and the number density of ring particles, the geometric optical depth, the apparent edge-on thickness, the age and the remaining lifetime of the G ring. We find that the particle size distribution of the G ring follows a power law with an exponent of 2.8, and dust particles in the size range of $[5, 10]\,{\mu}$m are dominant within the ring. The average number density of particles of the G ring in the radial direction is about $10^{-3}$-$10^{-2}\,\mathrm{m}^{-3}$. The peak value of the edge-on geometric optical depth of the G ring is about $3.9\times10^{-2}$. The maximum apparent edge-on thickness of the G ring with the geometric optical depth larger than $1\times10^{-8}$ is approximately $9,000\,\mathrm{km}$. The age of the G ring is estimated to be $10^{6}$-$10^{7}\,\mathrm{years}$, and the remaining lifetime of the ring is on the order of $10^{4}\,\mathrm{years}$.
Figures


Figures from the paper (6 more)


Reference graph
Works this paper leans on
-
[1]
write newline
" write newline "" before.all 'output.state := FUNCTION fin.entry write newline FUNCTION new.block output.state before.all = 'skip after.block 'output.state := if FUNCTION new.sentence output.state after.block = 'skip output.state before.all = 'skip after.sentence 'output.state := if if FUNCTION not #0 #1 if FUNCTION and 'skip pop #0 if FUNCTION or pop #1...
-
[2]
write newline
" write newline "" before.all 'output.state := FUNCTION fin.entry write newline FUNCTION new.block output.state before.all = 'skip after.block 'output.state := if FUNCTION new.sentence output.state after.block = 'skip output.state before.all = 'skip after.sentence 'output.state := if if FUNCTION not #0 #1 if FUNCTION and 'skip pop #0 if FUNCTION or pop #1...
-
[3]
Brooks S. M., Esposito L. W., Showalter M. R., Throop H. B., 2004, Icarus, 170, 35
work page 2004
-
[4]
Burns J. A., Lamy P. L., Soter S., 1979, Icarus https://www.sciencedirect.com/science/article/pii/0019103579900502, 40, 1
arXiv 1979
- [5]
-
[6]
Chen Z., Yang K., Liu X., 2024, Monthly Notices of the Royal Astronomical Society, 527, 11327
work page 2024
- [7]
-
[8]
K., et al., 2018, Science, 362, eaat5434
Dougherty M. K., et al., 2018, Science, 362, eaat5434
work page 2018
Show all 39 references
-
[9]
Elrod M., Tseng W.-L., Wilson R., Johnson R., 2012, Journal of Geophysical Research: Space Physics, 117
2012
-
[10]
K., Tseng W.-L., Woodson A
Elrod M. K., Tseng W.-L., Woodson A. K., Johnson R. E., 2014, Icarus, 242, 130
2014
-
[11]
P., Krivov A
Hamilton D. P., Krivov A. V., 1996, Icarus, 123, 503
1996
-
[12]
M., et al., 2007, science, 317, 653
Hedman M. M., et al., 2007, science, 317, 653
2007
-
[13]
Hedman M., Cooper N., Murray C., Beurle K., Evans M., Tiscareno M., Burns J., 2010, Icarus, 207, 433
2010
-
[14]
A., 2022, The Astronomical Journal, 164, 199
Jacobson R. A., 2022, The Astronomical Journal, 164, 199
2022
-
[15]
Johnson R., Fam \'a M., Liu M., Baragiola R., Sittler Jr E., Smith H., 2008, Planetary and Space Science, 56, 1238
2008
-
[16]
Juh \'a sz A., Hor \'a nyi M., 2002, Journal of Geophysical Research: Space Physics, 107, SMP 1\
2002
-
[17]
Jurac S., Johnson R., Richardson J., 2001, Icarus, 149, 384
2001
-
[18]
J., French R
Lissauer J. J., French R. G., 2000, Icarus, 146, 12
2000
-
[19]
Liu X., Schmidt J., 2018, Astronomy & Astrophysics https://www.aanda.org/articles/aa/abs/2018/01/aa30951-17/aa30951-17.html, 609, A57
2018
-
[20]
Liu X., Schmidt J., 2021, Monthly Notices of the Royal Astronomical Society https://academic.oup.com/mnras/article-abstract/500/3/2979/5942879, 500, 2979
2021
-
[21]
Liu X., Sachse M., Spahn F., Schmidt J., 2016, Journal of Geophysical Research: Planets https://agupubs.onlinelibrary.wiley.com/doi/full/10.1002/2016JE004999, 121, 1141
2016 doi
-
[22]
M., 2020, The European Physical Journal Special Topics, 229, 1527
Madeira G., Giuliatti Winter S. M., 2020, The European Physical Journal Special Topics, 229, 1527
2020
-
[23]
Madeira G., Sfair R., Mour \ a o D., Giuliatti Winter S., 2018, Monthly Notices of the Royal Astronomical Society, 475, 5474
2018
-
[24]
Maravilla D., Leal-Herrera J., 2014, Revista mexicana de astronom \' a y astrof \' sica, 50, 341
2014
-
[25]
M., 1998, Icarus, 132, 311
Meyer-Vernet N., Lecacheux A., Pedersen B. M., 1998, Icarus, 132, 311
1998
-
[26]
A., Granados Contreras A
Mu \ n oz-Guti \'e rrez M. A., Granados Contreras A. P., Madeira G., A’Hearn J. A., Giuliatti Winter S., 2022, Monthly Notices of the Royal Astronomical Society, 511, 4202
2022
-
[27]
D., et al., 1996, Science, 272, 509
Nicholson P. D., et al., 1996, Science, 272, 509
1996
-
[28]
Persoon A., et al., 2020, Journal of Geophysical Research: Space Physics, 125, e2019JA027545
2020
-
[29]
R., Cuzzi J
Showalter M. R., Cuzzi J. N., 1993, Icarus, 103, 124
1993
-
[30]
A., et al., 1981, Science, 212, 163
Smith B. A., et al., 1981, Science, 212, 163
1981
-
[31]
Sun K.-L., Sei M., Hedman M., Spahn F., 2017, Icarus, 284, 206
2017
-
[32]
Thomas P., Burns J., Hedman M., Helfenstein P., Morrison S., Tiscareno M., Veverka J., 2013, Icarus, 226, 999
2013
-
[33]
B., Esposito L
Throop H. B., Esposito L. W., 1998, Icarus, 131, 152
1998
-
[34]
Throop H., Porco C., West R., Burns J., Showalter M., Nicholson P., 2004, Icarus, 172, 59
2004
-
[35]
Tseng W.-L., Johnson R., Elrod M., 2013, Planetary and Space Science, 77, 126
2013
-
[36]
A., 1983, Journal of Geophysical Research: Space Physics, 88, 6911
Van Allen J. A., 1983, Journal of Geophysical Research: Space Physics, 88, 6911
1983
-
[37]
Wahlund J.-E., et al., 2005, Geophysical research letters, 32
2005
-
[38]
Yang K., Schmidt J., Feng W., Liu X., 2022, Astronomy & Astrophysics, 659, A120
2022
-
[39]
A., Kurth W
Ye S.-Y., Gurnett D. A., Kurth W. S., 2016, Icarus, 279, 51
2016
Reviewed August 6, 2026 · model on record in the stance chip above.
Discussion (0). Continue with ORCID to comment.