REVIEW 5 major objections 6 minor 28 references
When and Where Localization Fails: An Analysis of the Iterative Closest Point in Evolving Environment
T0 review · 5 major / 6 minor · reviewed 2026-08-06 · deepseek-v4-flash
Pith's one-line read This paper shows that Point-to-Plane ICP localizes a lidar-equipped robot more stably than Point-to-Point ICP in outdoor environments that change from week to week, keeping translation errors between 0.1 and 0.2 m and rotation below 1…
desk verdict The weekly dataset is a genuine contribution, but the ICP evaluation is a single week-pair without a no-change baseline, so the title's claims outrun the evidence. read the letter →
The pith
A machine-rendered reading of the paper's core claim, the machinery that carries it, and where it could break.
The reading
What carries the argument
The central object is the Iterative Closest Point algorithm in two variants: Point-to-Point (minimizing point-to-point distances) and Point-to-Plane (minimizing distances from points to local surface planes defined by normals). The argument is carried by a test harness built from high-density, graph-SLAM-aligned point cloud maps collected weekly; spherical 35-meter-radius submaps as ground truth; projected lidar scans that emulate a 32-beam sensor with a 360-degree field of view, 15 m vertical reach, 30 m maximum range, and occlusion constraints; Gaussian perturbations of the initial pose (translation uncertainty 0.1 m, rotation 5 degrees) and of scan points (sigma = 0.1 m); and 30 randomized ICP initializations per pose with median error reporting. This harness turns environmental variation into a controlled independent variable so that alignment errors can be attributed to scene geometry and change.
What would settle it
Re-run the same 30-initialization ICP protocol with real 32-beam lidar scans taken on the natural track in Week 00 and Week 01, using the same 35 m submaps and perturbation statistics; if Point-to-Point matches or beats Point-to-Plane in the corridor, wall, and sudden-object zones, the central claim is refuted.
Extended reading notes
Core claim
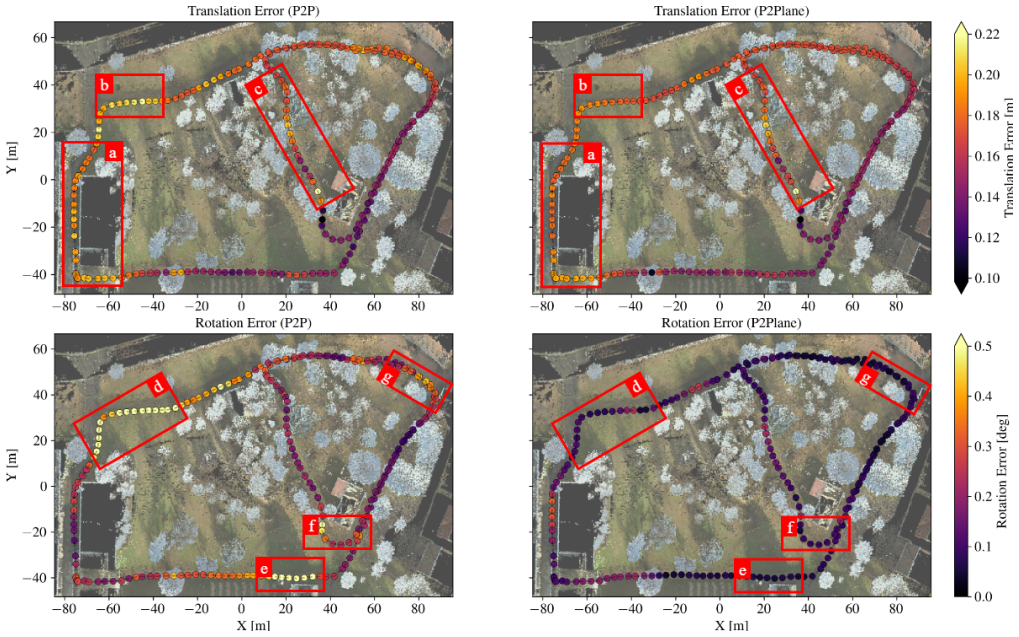
On the natural track, with a Week 00 scan aligned to a Week 01 reference map, Point-to-Plane ICP consistently achieves stable translation errors of 0.1–0.2 m and rotation below 1 degree, while Point-to-Point ICP occasionally reaches 0.25 m and rotation peaking near 1 degree. The failures cluster in identifiable geometries: a 'corridor effect' from dense vertical vegetation on both sides, flat low-feature ground, close tree canopy with partial occlusion, open areas where Point-to-Point drifts angularly, building-wall-only segments, and sudden object changes such as a newly parked car or pruned branches. The paper attributes the advantage to Point-to-Plane's use of surface normals, which provide local constraints and better convergence in under-constrained regions. The accompanying weekly dataset is designed so that repeated same-track acquisitions isolate environmental change as the variable driving localization error.
Load-bearing premise
The load-bearing premise is that the projected lidar scans synthesized from the Week-n point cloud, with occlusion modeling and added Gaussian noise, faithfully represent what a real 32-beam lidar would observe; if that emulation is systematically optimistic, the Point-to-Point versus Point-to-Plane comparison may not carry over to field deployments.
Editorial extensions
If this is right
- Field robots in natural and semi-urban settings should prefer Point-to-Plane ICP over Point-to-Point when maps may be days or weeks old.
- Failure-prone regions can be anticipated from local geometry: corridors, flat open ground, wall-only views, and sudden object changes are the zones where Point-to-Point drifts.
- The weekly dataset provides a reproducible benchmark for short-term relocalization, filling the gap between single-day and multi-season datasets.
- The evaluation protocol with perturbed projected scans can quantify how much of localization degradation is due to environmental change rather than sensor noise.
- If the central claim is correct, surface-normal-based registration should be a baseline for teach-and-repeat navigation in evolving outdoor settings.
Reading between the lines
- If the projected-scan emulation is faithful, the relative ordering of the two ICP variants likely transfers to real 32-beam sensors, but the absolute error ranges may shift because real beam divergence and reflectance are not fully modeled.
- The change-percentage metric (new points beyond 0.3 m within a 35 m sphere) could be turned into a predictive failure-risk map, with high-change sessions such as Week 09 expected to show larger localization errors than low-change weeks, a testable extension.
- The corridor effect suggests that an adaptive registration scheme weighting correspondences by local surface-normal agreement could reduce both variants' failures, but the paper does not propose such a scheme.
- Because the semi-urban track is more stable, the same protocol could quantify how much structure compensates for change, potentially explaining why Point-to-Plane is stable next to buildings.
Editorial analysis
A structured set of objections, weighed in public.
Referee Report
Summary. The paper introduces a weekly multi-temporal dataset (February to April 2025) with two trajectories, one natural and one semi-urban, containing dense point cloud maps, panoramic images, and trajectory data. To study relocalization, the authors generate synthetic 32-beam lidar scans from the aligned point cloud maps, apply a stochastic initial-pose perturbation (Eq. 1) and measurement noise, and register these scans against a reference submap using Point-to-Point and Point-to-Plane ICP. The only reported experiment uses Week 00 scans from the natural track registered against the Week 01 reference map, and the paper concludes that Point-to-Plane ICP is significantly more accurate and stable, especially in low-feature and vegetated zones.
Significance. The dataset itself is a potentially valuable resource for studying short-term environmental change in outdoor localization, and the reproducible experimental pipeline (libpointmatcher, defined perturbation model, and error metrics) is a useful starting point. The paper is explicit about some limitations, such as the absence of raw scans (Table I) and the fact that the experiment is an 'initial study' (Section IV-B). However, the analytical claims currently exceed what the single reported experiment can support; the dataset contribution is more solid than the ICP comparison, and the latter needs additional control experiments before the title-level conclusions can be accepted.
major comments (5)
- [Section IV-B and IV-C] The experiment lacks a same-map control. The reported final translation errors (PtPlane 0.1–0.2 m; PtP up to 0.25 m) are comparable to the initial translation perturbation sigma = 0.1 m and the added measurement noise sigma = 0.1 m from Section IV-A. Without a Week-01-to-Week-01 or Week-00-to-Week-00 baseline, the results do not demonstrate that the residual errors are caused by environmental change rather than by the perturbation, sensor noise, or the scan-projection pipeline. This control is load-bearing for the paper's central claim and should be added, with full error distributions rather than medians alone.
- [Section IV-B] Only a single temporal pair (Week 00 versus Week 01 on the natural track) is analyzed, even though Table II quantifies change percentages across Weeks 00–09 for both environments. The conclusion about 'evolving environments' and the claimed robustness ranking rest on one change magnitude and one environment. The paper should include multiple week pairs with different change percentages, and ideally the semi-urban track, to establish that the observed PtP/PtPlane gap is not idiosyncratic to this particular pair.
- [Section IV-A and Table I] The synthetic projected scans are generated from the same aligned point cloud maps used to build the reference submaps, with occlusion modeling and added Gaussian noise, while the dataset stores no raw scans. This means the evaluation may be systematically optimistic and may not transfer to a real 32-beam lidar in the field. The authors should validate the projection against a real lidar acquisition or, at minimum, state this as a limitation and temper the practical claims in the abstract and conclusion.
- [Figure 3 and Table II] The annotated zones (a–g) in Figure 3 are described only qualitatively; they are not quantitatively linked to the local environmental-change percentages from Table II or to local error statistics. To support the 'where and why localization fails' claim, the paper should report per-zone change percentages and per-zone median/IQR errors, or provide a correlation analysis between local change magnitude and registration error.
- [Section IV-B] The paper reports only medians over 30 randomized initializations and does not report variances, interquartile ranges, or any significance test. The claim that Point-to-Plane is 'significantly more stable and accurate' requires distributional evidence; a paired comparison over the roughly 200 poses (e.g., Wilcoxon signed-rank test on per-pose medians) would be appropriate.
minor comments (6)
- [Abstract and Section IV-B] The abstract states the evaluation is performed 'across natural and semi-urban settings,' but the reported experiment uses only the natural track. Please clarify that the semi-urban data are part of the dataset, not part of the current ICP evaluation.
- [Section III-B] Several sentences need editing: 'the following weeks showed a lower median, that increase thought weeks' is grammatically unclear, and 'the semi-urban environment also propose numerous unpredictable changes' should read 'poses.'
- [Section IV-B] There is a typo 'translatation error,' and the notation 'Pt-Plane' and 'PtPlane' are used inconsistently; please pick one form.
- [Section IV-A] Use '15,000 points' rather than '15.000 points' to avoid confusion with decimal notation.
- [Section II-A] The related work text claims 'dense semantic labeling across sessions,' but no semantic labels are described elsewhere in the paper; either remove this claim or document the labeling in the dataset description.
- [Table I] The 'Ours' row lists 'No Raw Scans' as a weakness; this limitation should also be stated prominently in the dataset description and in the conclusion, since it directly affects the transferability of the reported results.
Circularity Check
No circular derivation: the reported errors are computed directly from ICP outputs on perturbed synthetic scans, with no fitted parameter renamed as a prediction and no load-bearing self-citation.
full rationale
The paper's claimed derivation chain is an empirical evaluation, not a predictive model built from fitted parameters. The perturbation in Eq. (1) is an experimental input chosen before registration, and the reported translation and rotation errors are computed directly from the ICP outputs using Eq. (2); no outcome is used to fit the perturbation, the scan projection, or the ICP configuration. The projected scans derive from aligned Week-n point clouds with occlusion and Gaussian noise, and the reference submap is the Week-01 map, so the comparison measures alignment under controlled perturbation and environmental differences rather than recovering values already assumed by construction. The only notable self-citation is the use of the open-source libpointmatcher library from [7], whose author is also a co-author; however, the library is a publicly available implementation, and the PtPlane-over-PtP conclusion is supported by the paper's own trajectory-level measurements in Section IV-C and Figure 3, not solely by the citation. The corroborating reference to [7] for corridor ambiguity is a supporting observation, not the load-bearing evidence. The lack of a no-change control and the synthetic nature of the projected scans are external-validity limitations, not circularity, and therefore do not raise the circularity score.
Assumptions & free parameters
free parameters (7)
- Initial pose perturbation covariance =
translation sigma 0.1 m, rotation sigma 5 deg
- Point cloud measurement noise =
sigma 0.1 m
- ICP maximum correspondence distance =
0.7 m
- ICP maximum iterations =
150
- Submap radius =
35 m
- Change detection distance threshold =
0.3 m
- Voxel downsampling size =
0.1 m
assumptions (5)
- domain assumption Projected scans emulate a real 32-beam lidar with sensor-accurate occlusion and uniform Gaussian noise.
- domain assumption Leica graph-SLAM alignment and GNSS/IMU poses are accurate enough to serve as ground truth at the 0.1 m scale.
- ad hoc to paper The Week 00 to Week 01 pair on the natural track is representative of short-term environmental evolution.
- domain assumption A 0.3 m distance threshold correctly separates environmental change from alignment noise.
- domain assumption ICP with 0.7 m correspondence distance and the Cauchy outlier filter converges for all 30 perturbed initializations.
Cite this review
Pith. "Pith review of When and Where Localization Fails: An Analysis of the Iterative Closest Point in Evolving Environment." pith.science (2026). https://pith.science/paper/IKPPQTIG
@misc{pith2026250717531,
  author       = {Pith},
  title        = {Pith review of: When and Where Localization Fails: An Analysis of the Iterative Closest Point in Evolving Environment},
  year         = {2026},
  howpublished = {\url{https://pith.science/paper/IKPPQTIG}},
  note         = {Machine review of arXiv:2507.17531}
}
read the original abstract
Robust relocalization in dynamic outdoor environments remains a key challenge for autonomous systems relying on 3D lidar. While long-term localization has been widely studied, short-term environmental changes, occurring over days or weeks, remain underexplored despite their practical significance. To address this gap, we present a highresolution, short-term multi-temporal dataset collected weekly from February to April 2025 across natural and semi-urban settings. Each session includes high-density point cloud maps, 360 deg panoramic images, and trajectory data. Projected lidar scans, derived from the point cloud maps and modeled with sensor-accurate occlusions, are used to evaluate alignment accuracy against the ground truth using two Iterative Closest Point (ICP) variants: Point-to-Point and Point-to-Plane. Results show that Point-to-Plane offers significantly more stable and accurate registration, particularly in areas with sparse features or dense vegetation. This study provides a structured dataset for evaluating short-term localization robustness, a reproducible framework for analyzing scan-to-map alignment under noise, and a comparative evaluation of ICP performance in evolving outdoor environments. Our analysis underscores how local geometry and environmental variability affect localization success, offering insights for designing more resilient robotic systems.
Figures


Figures from the paper (1 more)

Reference graph
Works this paper leans on
-
[1]
Kilometer-Scale Autonomous Navigation in Subarctic Forests: Challenges and Lessons Learned
Dominic Baril et al. “Kilometer-Scale Autonomous Navigation in Subarctic Forests: Challenges and Lessons Learned”. In: Field Robotics 2.1 (Mar. 10, 2022), pp. 1628–1660
work page 2022
-
[2]
A Review of High-Throughput Field Phenotyping Systems: Focusing on Ground Robots
Changying Li and Rui Xu. “A Review of High-Throughput Field Phenotyping Systems: Focusing on Ground Robots”. In: Plant Phenomics (2022)
work page 2022
-
[3]
Mapping Forests Using an Unmanned Ground Vehicle with 3D LiDAR and Graph-SLAM
Marek Pierzchała, Philippe Gigu `ere, and Rasmus Astrup. “Mapping Forests Using an Unmanned Ground Vehicle with 3D LiDAR and Graph-SLAM”. In: Computers and Electronics in Agriculture 145 (Feb. 2018), pp. 217–225
work page 2018
-
[4]
A Forest 3-D Lidar SLAM System for Rubber- Tapping Robot Based on Trunk Center Atlas
Fuyu Nie et al. “A Forest 3-D Lidar SLAM System for Rubber- Tapping Robot Based on Trunk Center Atlas”. In: IEEE/ASME Transactions on Mechatronics 27.5 (Oct. 2022), pp. 2623–2633
work page 2022
-
[5]
Robust Normal Vector Estimation in 3D Point Clouds through Iterative Principal Component Analysis
Julia Sanchez et al. “Robust Normal Vector Estimation in 3D Point Clouds through Iterative Principal Component Analysis”. In: ISPRS J. of Photogramm. Remote Sens. 163 (May 2020), pp. 18–35
work page 2020
-
[6]
ROLL: Long-Term Robust LiDAR-based Localization With Temporary Mapping in Changing Environments
Bin Peng, Hongle Xie, and Weidong Chen. “ROLL: Long-Term Robust LiDAR-based Localization With Temporary Mapping in Changing Environments”. In: 2022 IEEE/RSJ Int. Conf. on Intel- ligent Robots and Systems (IROS) . Oct. 2022, pp. 2841–2847
work page 2022
-
[7]
Comparing ICP variants on real-world data sets: Open-source library and experimental protocol
Franc ¸ois Pomerleau et al. “Comparing ICP variants on real-world data sets: Open-source library and experimental protocol”. In: Autonomous Robots 34.3 (Apr. 2013), pp. 133–148
work page 2013
-
[8]
Challenging data sets for point cloud reg- istration algorithms
Franc ¸ois Pomerleau et al. “Challenging data sets for point cloud reg- istration algorithms”. en. In: The International Journal of Robotics Research 31.14 (Dec. 2012), pp. 1705–1711
work page 2012
Show all 28 references
-
[9]
University of Michigan North Campus long-term vision and lidar dataset
Nicholas Carlevaris-Bianco, Arash K. Ushani, and Ryan M. Eustice. “University of Michigan North Campus long-term vision and lidar dataset”. In: Int. J. Robot. Res. 35.9 (2015), pp. 1023–1035
2015
-
[10]
Boreas: A multi-season autonomous driving dataset
Keenan Burnett et al. “Boreas: A multi-season autonomous driving dataset”. In: The Int. J. Robot. Res. 42.1-2 (Jan. 2023), pp. 33–42
2023
-
[11]
4Seasons: Benchmarking Visual SLAM and Long-Term Localization for Autonomous Driving in Challenging Conditions
Patrick Wenzel et al. “4Seasons: Benchmarking Visual SLAM and Long-Term Localization for Autonomous Driving in Challenging Conditions”. In: Int. J. of Computer Vision 133.4 (Apr. 2025), pp. 1564–1586
2025
-
[12]
FoMo: A Proposal for a Multi-Season Dataset for Robot Navigation in Forˆet Montmorency
Mat ˇej Boxan et al. FoMo: A Proposal for a Multi-Season Dataset for Robot Navigation in Forˆet Montmorency. arXiv:2404.13166 [cs]. Apr. 2024
2024 arXiv
-
[13]
FinnForest dataset: A forest landscape for visual SLAM
Ihtisham Ali et al. “FinnForest dataset: A forest landscape for visual SLAM”. In: Rob. and Auton. Systems 132 (Oct. 2020), p. 103610
2020
-
[14]
Wild-Places: A Large-Scale Dataset for Lidar Place Recognition in Unstructured Natural Environments
Joshua Knights et al. Wild-Places: A Large-Scale Dataset for Lidar Place Recognition in Unstructured Natural Environments . arXiv:2211.12732 [cs]. Mar. 2023
2023 arXiv
-
[15]
ROVER: A Multi-Season Dataset for Visual SLAM
Fabian Schmidt et al. ROVER: A Multi-Season Dataset for Visual SLAM. arXiv:2412.02506 [cs]. Mar. 2025
2025 arXiv
-
[16]
VPAIR – Aerial Visual Place Recognition and Localization in Large-scale Outdoor Environments
Michael Schleiss, Fahmi Rouatbi, and Daniel Cremers. VPAIR – Aerial Visual Place Recognition and Localization in Large-scale Outdoor Environments. arXiv:2205.11567 [cs]. May 2022
2022 arXiv
-
[17]
VIODE: A Simulated Dataset to Address the Challenges of Visual-Inertial Odometry in Dynamic Environ- ments
Koji Minoda et al. “VIODE: A Simulated Dataset to Address the Challenges of Visual-Inertial Odometry in Dynamic Environ- ments”. In: IEEE Robotics and Automation Letters 6.2 (Apr. 2021). arXiv:2102.05965 [cs], pp. 1343–1350
2021 arXiv
-
[18]
CrowdDriven: A New Challenging Dataset for Outdoor Visual Localization
Ara Jafarzadeh et al. “CrowdDriven: A New Challenging Dataset for Outdoor Visual Localization”. In: 2021 IEEE/CVF Int. Conf. on Computer Vision (ICCV). Montreal, QC, Canada: IEEE, Oct. 2021, pp. 9825–9835
2021
-
[19]
OutFin, a multi- device and multi-modal dataset for outdoor localization based on the fingerprinting approach
Fahad Alhomayani and Mohammad H. Mahoor. “OutFin, a multi- device and multi-modal dataset for outdoor localization based on the fingerprinting approach”. In: Scientific Data 8.1 (Feb. 2021), p. 66
2021
-
[20]
Real-Time, Environmentally-Robust 3D LiDAR Localization
Yilong Zhu et al. Real-Time, Environmentally-Robust 3D LiDAR Localization. arXiv:1910.12728 [cs]. Oct. 2019
1910 arXiv
-
[21]
3D LiDAR-Based Precision Vehicle Localization with Movable Region Constraints
Chih-Ming Hsu and Chung-Wei Shiu. “3D LiDAR-Based Precision Vehicle Localization with Movable Region Constraints”. In:Sensors 19.4 (Feb. 2019), p. 942
2019
-
[22]
A Survey on 3D LiDAR Localization for Autonomous Vehicles
Mahdi Elhousni and Xinming Huang. “A Survey on 3D LiDAR Localization for Autonomous Vehicles”. In: 2020 IEEE Intelligent Vehicles Symposium (IV). Oct. 2020, pp. 1879–1884
2020
-
[23]
Real-time LIDAR localization in natural and urban environments
Georgi Tinchev, Adrian Penate-Sanchez, and Maurice Fallon. Real-time LIDAR localization in natural and urban environments . arXiv:2301.13583 [cs]. Jan. 2023
2023 arXiv
-
[24]
3D LiDAR Mapping in Dynamic Envi- ronments Using a 4D Implicit Neural Representation
Xingguang Zhong et al. “3D LiDAR Mapping in Dynamic Envi- ronments Using a 4D Implicit Neural Representation”. In: 2024 IEEE/CVF Conf. on Computer Vision and Pattern Recognition (CVPR). Seattle, W A, USA: IEEE, June 2024, pp. 15417–15427
2024
-
[25]
Are We There Yet? Challenging SeqSLAM on a 3000 km Journey Across All Four Seasons
Niko S ¨underhauf, Peer Neubert, and Peter Protzel. “Are We There Yet? Challenging SeqSLAM on a 3000 km Journey Across All Four Seasons”. In: Proc. of Workshop on Long-Term Autonomy, IEEE Int. Conf. on Robotics and Automation (ICRA) (Jan. 2013)
2013
-
[26]
Keeping an Eye on Things: Deep Learned Features for Long-Term Visual Localiza- tion
Mona Gridseth and Timothy D. Barfoot. “Keeping an Eye on Things: Deep Learned Features for Long-Term Visual Localiza- tion”. In: IEEE Robotics and Automation Letters 7.2 (Apr. 2022), pp. 1016–1023
2022
-
[27]
Long-Term Visual Localization with Mobile Sensors
Shen Yan et al. “Long-Term Visual Localization with Mobile Sensors”. In: 2023 IEEE/CVF Conference on Computer Vision and Pattern Recognition (CVPR). June 2023, pp. 17245–17255
2023
-
[28]
State estimation for robotics
Timothy D Barfoot. State estimation for robotics . Cambridge Uni- versity Press, 2024
2024
Reviewed August 6, 2026 · model on record in the stance chip above.
Discussion (0). Sign in to comment.