REVIEW 5 major objections 6 minor 26 references
Project Patti: Why can You Solve Diabolical Puzzles on one Sudoku Website but not Easy Puzzles on another Sudoku Website?
T0 review · 5 major / 6 minor · reviewed 2026-08-06 · deepseek-v4-flash
Pith's one-line read A randomized trial-and-error Sudoku solver's average cycle count matches website-assigned difficulty rankings for four of five puzzle sites, and the paper builds a universal Easy/Medium/Hard scale from it.
desk verdict A genuinely useful empirical study of Sudoku difficulty, but the main metric lacks a stability check and the paper overclaims support for its second metric. read the letter →
The pith
A machine-rendered reading of the paper's core claim, the machinery that carries it, and where it could break.
The reading
What carries the argument
The central object is a randomized Nishio solver with human strategies. Nishio is trial-and-error backtracking: the solver guesses a candidate digit in a cell, applies the four strategies repeatedly, and backtracks when a contradiction appears. The key metric, Nishio Human Cycles, counts how many times the four-strategy cycle is applied while solving a puzzle, averaged over 50 random starting guesses; this number is meant to represent procedural difficulty as a human would experience it. The secondary object is the Clause Length Distribution, computed from a minimum-encoding SAT (boolean satisfiability) representation of the same puzzle, specifically the percentage of 'short' clauses; this is meant to capture structural complexity such as the number of givens and their positions. The argument works by correlating both metrics against each website's own difficulty labels, then putting the 1,320 puzzles into three equal-count bins to make the categories comparable.
What would settle it
Recompute Nishio Human Cycles for all 1,320 puzzles using a much larger number of random starts, such as 1,000 per puzzle, and check whether puzzle-level means stabilize; if the means shift enough to change Spearman rankings or bin assignments, the 50-start proxy is not stable. A complementary check is a user study in which people solve a sample of the same puzzles and their solve times and strategy choices are compared with cycle counts.
Extended reading notes
Core claim
On its own terms, the paper establishes that procedural difficulty, measured as Nishio Human Cycles, tracks the difficulty ordering that websites assign to their puzzles, while structural complexity, measured by the clause-length distribution of a SAT encoding, does not. Nishio Human Cycles is the mean, over 50 randomized restarts, of the number of times the solver applies a fixed cycle of four human strategies (Naked Singles, Hidden Singles, Naked Twins, and X-wing) inside a trial-and-error backtracking procedure called Nishio. The paper reports that this single number correlates strongly with labeled difficulty for the New York Times, Sudoku.org.uk, Sudoku of the Day, and Sudoku of the Day UK, but is essentially uncorrelated for Extreme Sudoku, whose five labels all behave as hard puzzles under the metric. The paper also proposes that a simple univariate binning of the 1,320 puzzles into three equal-count bins yields a universal rating system that classifies both individual puzzles and entire website difficulty levels consistently across sites.
Load-bearing premise
The load-bearing premise is that the average number of strategy cycles used by a randomized Nishio solver, over 50 random starts, mirrors how hard a real human finds a puzzle, an assumption the paper states but does not validate with variance data, convergence checks, or a user study.
Editorial extensions
If this is right
- A puzzle labeled 'Easy' on one website and a puzzle labeled 'Diabolical' on another can be compared on the same numeric scale, so a player can see which labels are inflated.
- The four websites whose labels correlate with Nishio Human Cycles have their difficulty levels ordered by the metric, so those sites' labels are measuring something the solver captures.
- For Extreme Sudoku, the near-zero correlation means either the website's labels are arbitrary with respect to solving effort or the metric misses something that site does; the paper leaves this as an open question.
- An unlabeled puzzle can be rated directly by computing its mean cycle count and applying the bin cutoffs, without needing a website's own difficulty label.
- Applied to an unrated dataset, the same bins place more than half of its puzzles in Universal Easy, showing that the scale separates datasets, not just levels within one website.
Reading between the lines
- As an extension, the metric predicts that any Sudoku website whose labels do not correlate with cycle counts is labeling by something other than solving effort; a straightforward check is to compare that site's labels to human solve times.
- The universal cutoffs are sample-dependent: re-running the binning on a different corpus would move the boundaries, so the durable contribution is the calibration procedure rather than the specific numeric cutoffs.
- The cycle count depends on the chosen four-strategy vocabulary; adding or removing strategies would shift the counts, implying that 'universal' difficulty is relative to a defined strategy set, not an absolute property of a puzzle.
- Recording the full distribution of cycle counts across the 50 random starts, instead of only the mean, could expose a variance-based difficulty signal that the paper does not explore.
Editorial analysis
A structured set of objections, weighed in public.
Referee Report
Summary. Project Patti proposes two difficulty metrics for Sudoku puzzles: (1) Clause Length Distribution (CLD), specifically the percentage of short clauses in a minimum SAT encoding, and (2) Nishio Human Cycles (NHC), the mean number of strategy-application cycles used by a randomized Nishio solver interleaved with four human strategies. Using a corpus of 1320 puzzles from five websites, the paper reports Spearman correlations between these metrics and website-provided difficulty levels (Table 2), finding strong NHC correlations for four of five websites, with Extreme Sudoku anomalous. It then builds an unsupervised three-bin universal classifier on each metric and maps all 22 difficulty levels into Universal Easy, Universal Medium, and Universal Hard categories. The paper also reports the percentage of puzzles solvable by human strategies alone and introduces a heuristic-based Nishio solver for human practitioners.
Significance. If the correlations in Table 2 are robust, the paper provides a novel and useful procedural difficulty metric for Sudoku and a practical cross-website rating scheme. Strengths include a large multi-website dataset, a clearly specified random-solver simulation, a comparison with the escape-rate hardness measure of Ercsey-Ravasz and Toroczkai, and an application to the nikoli_100 benchmark from SudokuBench. The main claims are empirically grounded rather than assumed. However, the absence of any variance or convergence analysis for the random solver, the in-sample estimation of the universal bins, and several internal inconsistencies currently prevent the paper from fully establishing its central claims.
major comments (5)
- [§7.2 and Table 2] The Nishio Human Cycles metric is a mean over 50 random starts of a randomized solver, but the paper reports no variance, standard error, or convergence check for these per-puzzle means. Because step 2 of Figure 3 chooses a random cell and a random candidate, the cycle count for a fixed puzzle is a random variable; with only 50 samples per puzzle and 60 puzzles per difficulty level, the Spearman correlations in Table 2 and the bin boundaries in §8.2.1 could change with the random seed. Please report the distribution of per-start cycle counts for representative puzzles (e.g., SD and IQR across the 50 starts) and a convergence plot of the mean as a function of the number of starts, for at least one easy, one medium, and one hard puzzle per website. This is necessary to establish that the headline correlations are stable.
- [§8.2.2 and §8.3, Observation 3] Observation 3 states that '19 of the 22 difficulty levels fall into or near the Universal Medium difficulty level' when classified by Clause Length Distribution. This count is not supported by the data in Table 1 and the bin boundaries given in §8.2.2 ([100%, 22.6), [22.6, 17.6), [17.6, 0]). Using the table means, five levels (NYT Easy, Sudoku.org.uk Gentle, Sudoku of the Day Beginner, Sudoku of the Day Easy, Sudoku of the Day UK Easy) fall into the Universal Easy bin, twelve fall into the Universal Medium bin, and five fall into the Universal Hard bin; 'near' is never defined. Please provide the exact classification of all 22 levels and correct the count or define 'near' quantitatively.
- [§8.2.1 and §8.3] The universal classification is built by fitting equal-bin-count thresholds on the full 1320-puzzle dataset and then evaluating the alignment of the same 1320 puzzles' difficulty levels in Observations 1–4. This is an in-sample evaluation, so the reported alignment counts are not evidence for generalization to new puzzles or websites. To support the 'universal' claim, the binning should be fit on a training subset and evaluated on held-out puzzles, or a cross-validation procedure should be reported. At minimum, the in-sample nature of the alignment should be stated explicitly.
- [§8, 'Percentage of Puzzles solved by only Human Strategies Assertions'] The first assertion for the 'Percentage of Puzzles solved by only Human Strategies' analysis states that 'the percentage of puzzles solved should increase monotonically as difficulty level increases.' This is contrary to both intuition and the data in Tables 3–7, where, for example, New York Times Easy is 100% and Medium and Hard are 0% for two strategies. The later statements that 'all assertions hold true' are therefore inconsistent with the stated assertion. The assertion should be corrected (presumably to 'decrease monotonically'), and the corresponding analyses in §8.1.2–8.1.6 should be re-worded to match the corrected direction.
- [Abstract and §11 Conclusion] The abstract and conclusion state that the proposed metrics correlate strongly with website-labeled difficulty for 4 out of 5 websites, and the conclusion adds that 'the labeled difficulty levels align with the two difficulty metrics.' Table 2, however, shows strong correlations for Clause Length Distribution only for NYT (-0.80) and Sudoku of the Day (-0.75); for Sudoku.org.uk (-0.47), Sudoku of the Day UK (-0.28), and Extreme Sudoku (-0.02) the correlation is weak. The 4-out-of-5 claim is supported only for Nishio Human Cycles with four strategies. Please qualify the claim so it does not imply that both metrics perform equally.
minor comments (6)
- [§7.1 text vs Table 1] The text says 'the mean percentage of short clauses for New York Times Easy is 29%', but Table 1 reports 67% for that entry; this typo should be corrected.
- [Table 2] Spearman correlations are reported without p-values or confidence intervals; given that each correlation is based on 180–360 puzzles, significance tests or bootstrap intervals would strengthen the empirical claims.
- [§4.1.1] The term '1-in-k SAT clause' is used to denote a clause of length k, but in the SAT literature 1-in-k SAT refers to exactly-one semantics. Since the clauses here are ordinary at-least-one disjunctions, using this term may confuse readers; a different term such as 'k-clause' would be clearer.
- [§4.1.2] The sentence 'At-most-one clauses creates pairwise relationships...' has an agreement error ('creates' should be 'create'), and the total clause count for Figure 1a (12026) should explicitly state that this includes the 38 given-digit clauses.
- [§6] The dataset is not yet public; since the analysis is empirical, releasing puzzle strings and per-puzzle metric values would greatly aid reproducibility and allow other researchers to verify the correlations.
- [§9.2] The sentence 'Additionally, the Hsolver should always apply the human strategies before using Nishio, as described in Step 1.5' refers to Step 1.5 that appears later; consider moving the description before this sentence or adding a forward reference.
Circularity Check
No significant circularity: the proposed metrics and correlations are defined independently of website labels, and the in-sample universal binning is a validation limitation rather than a circular reduction.
full rationale
The paper's two metrics are defined without reference to website difficulty labels. Clause Length Distribution is computed from the SAT minimum-encoding of each puzzle (Section 7.1), and Nishio Human Cycles is the mean cycle count over 50 randomized Nishio solves (Section 7.2). The Spearman correlations in Table 2 are empirical associations between these independently computed metrics and ordinal website labels; no parameter is fitted to the labels. The universal classifier (Section 8.2.1) uses equal-count binning on the pooled 1320-puzzle metric values, explicitly as an 'unlabeled dataset', so the bin boundaries are not derived from the target labels. The subsequent mapping of difficulty levels (Section 8.2.2) and the 'aligns well' claim are in-sample descriptions rather than out-of-sample predictions, which is a methodological limitation but not a definitional or fitted-input circularity. There is no self-citation chain, no uniqueness theorem imported from the authors, and no ansatz smuggled in via citation; the related-work comparison to Ercsey-Ravasz and Toroczkai [7] is external. The Extreme Sudoku near-zero correlation and the stated need for future validation are acknowledged in the paper. Therefore no specific circular step can be quoted; the robustness concern about 50 random starts is real but is not a circularity argument.
Assumptions & free parameters
free parameters (6)
- Number of universal bins =
3
- Short-clause threshold for Clause Length Distribution =
k = 1, 2
- Universal bin thresholds for Nishio Human Cycles =
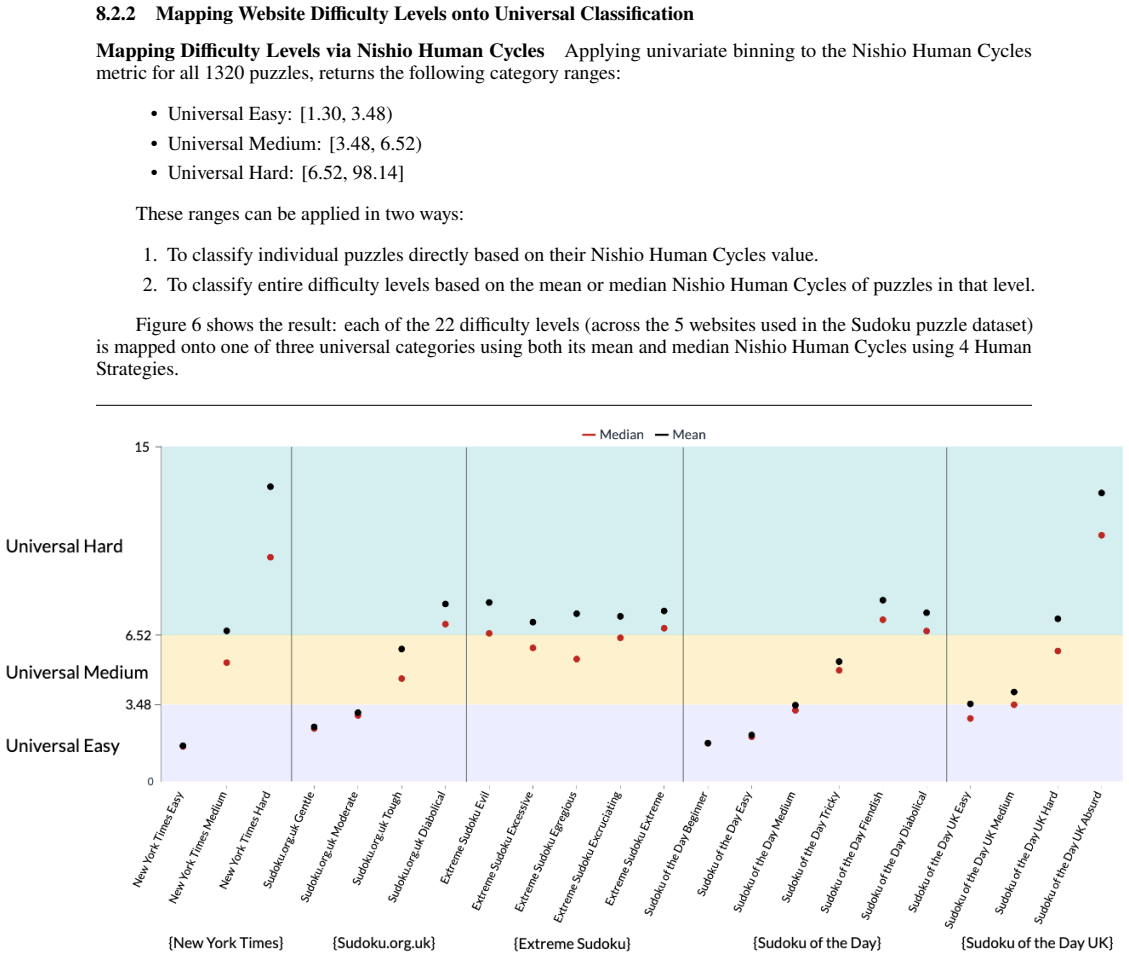
[1.30, 3.48), [3.48, 6.52), [6.52, 98.14)
- Universal bin thresholds for percentage of short clauses =
[100, 22.6), [22.6, 17.6), [17.6, 0)
- Number of random starts for Nishio =
50
- Strategy set and ordering =
Naked Singles, Hidden Singles, Naked Twins, X-wing
assumptions (5)
- standard math The maximum and minimum SAT encodings correctly capture all Sudoku constraints
- domain assumption The randomized Nishio solver of Figure 3 terminates and solves every valid Sudoku puzzle
- domain assumption Website difficulty levels are a meaningful ordinal benchmark for evaluating the proposed metrics
- ad hoc to paper Three universal categories with equal-bin-count binning are appropriate for cross-site comparison
- ad hoc to paper Human solvers behave like the stated strategy ordering and random trial-and-error
Cite this review
Pith. "Pith review of Project Patti: Why can You Solve Diabolical Puzzles on one Sudoku Website but not Easy Puzzles on another Sudoku Website?." pith.science (2026). https://pith.science/paper/64JRWJTK
@misc{pith2026250721137,
  author       = {Pith},
  title        = {Pith review of: Project Patti: Why can You Solve Diabolical Puzzles on one Sudoku Website but not Easy Puzzles on another Sudoku Website?},
  year         = {2026},
  howpublished = {\url{https://pith.science/paper/64JRWJTK}},
  note         = {Machine review of arXiv:2507.21137}
}
read the original abstract
In this paper we try to answer the question "What constitutes Sudoku difficulty rating across different Sudoku websites?" Using two distinct methods that can both solve every Sudoku puzzle, I propose two new metrics to characterize Sudoku difficulty. The first method is based on converting a Sudoku puzzle into its corresponding Satisfiability (SAT) problem. The first proposed metric is derived from SAT Clause Length Distribution which captures the structural complexity of a Sudoku puzzle including the number of given digits and the cells they are in. The second method simulates human Sudoku solvers by intertwining four popular Sudoku strategies within a backtracking algorithm called Nishio. The second metric is computed by counting the number of times Sudoku strategies are applied within the backtracking iterations of a randomized Nishio. Using these two metrics, I analyze more than a thousand Sudoku puzzles across five popular websites to characterize every difficulty level in each website. I evaluate the relationship between the proposed metrics and website-labeled difficulty levels using Spearman's rank correlation coefficient, finding strong correlations for 4 out of 5 websites. I construct a universal rating system using a simple, unsupervised classifier based on the two proposed metrics. This rating system is capable of classifying both individual puzzles and entire difficulty levels from the different Sudoku websites into three categories - Universal Easy, Universal Medium, and Universal Hard - thereby enabling consistent difficulty mapping across Sudoku websites. The experimental results show that for 4 out of 5 Sudoku websites, the universal classification aligns well with website-labeled difficulty levels. Finally, I present an algorithm that can be used by early Sudoku practitioners to solve Sudoku puzzles.
Figures


Figures from the paper (5 more)




Reference graph
Works this paper leans on
-
[1]
On the glucose sat solver.International Journal on Artificial Intelligence Tools, 2018
Gilles Audemard and Laurent Simon. On the glucose sat solver.International Journal on Artificial Intelligence Tools, 2018
work page 2018
-
[2]
Sudokupuzzlesandhowtosolvethem
AndriesEBrouwer. Sudokupuzzlesandhowtosolvethem. EuropeanMathematicalSocietyNewsletter ,66:13–17, 2007
work page 2007
-
[3]
Find hard instances of the satisfiability problem
SA Cook. Find hard instances of the satisfiability problem. InDIMACS Workshop on Satisfiability Problem: Theory and Applications, 1996
work page 1996
-
[4]
Broderick Crawford, Carlos Castro, and Eric Monfroy.Solving Sudoku with Constraint Programming, volume 35, pages 345–348. 01 2009
work page 2009
-
[5]
Carlos F. Daganzo. Minuet: A method to solve sudoku puzzles by hand.CoRR, abs/1812.06778, 2018
arXiv 2018
-
[6]
Solving single-digit sudoku subproblems
David Eppstein. Solving single-digit sudoku subproblems. InInternational Conference on Fun with Algorithms, pages 142–153. Springer, 2012
work page 2012
-
[7]
The chaos within sudoku.Scientific reports, 2(1):1–8, 2012
Mária Ercsey-Ravasz and Zoltán Toroczkai. The chaos within sudoku.Scientific reports, 2(1):1–8, 2012
work page 2012
-
[8]
PhD thesis, State University of New York at Binghamton, USA, 1998
Olukunmi Samuel Johnson.Constraint relaxation: a technique for exploring design alternatives. PhD thesis, State University of New York at Binghamton, USA, 1998. UMI Order No. GAX98-06059
work page 1998
Show all 26 references
-
[9]
Optimized cnf encoding for sudoku puzzles
Gihwon Kwon and Himanshu Jain. Optimized cnf encoding for sudoku puzzles. InProc. 13th International Conference on Logic for Programming Artificial Intelligence and Reasoning (LPAR2006), pages 1–5, 2006
2006
-
[10]
Sudoku of the day
Astraware Limited. Sudoku of the day. https://www.sudokuoftheday.com/dailypuzzles. Accessed: 2025-06-23
2025
-
[11]
Large language model guided tree-of-thought.ArXiv, abs/2305.08291, 2023
Jieyi Long. Large language model guided tree-of-thought.ArXiv, abs/2305.08291, 2023
2023 arXiv
-
[12]
Sudoku as a sat problem
Inês Lynce and Joël Ouaknine. Sudoku as a sat problem. InAI&M. Citeseer, 2006
2006
-
[13]
Explaining puzzle solutions in natural language: An exploratory study on 6x6 sudoku.ArXiv, abs/2505.15993, 2025
Anirudh Maiya, Razan Alghamdi, Maria Leonor Pacheco, Ashutosh Trivedi, and Fabio Somenzi. Explaining puzzle solutions in natural language: An exploratory study on 6x6 sudoku.ArXiv, abs/2505.15993, 2025
2025 arXiv
-
[14]
A hybrid approach for the sudoku problem: Using constraint programming in iterated local search.IEEE Intelligent Systems, 32(2):52–62, 2017
Nysret Musliu and Felix Winter. A hybrid approach for the sudoku problem: Using constraint programming in iterated local search.IEEE Intelligent Systems, 32(2):52–62, 2017
2017
-
[15]
e-Handbook of Statistical Methods
NIST/SEMATECH. e-Handbook of Statistical Methods. https://www.itl.nist.gov/div898/handbook/, 2002
2002
-
[16]
Solvingeverysudokupuzzle
PeterNorvig. Solvingeverysudokupuzzle. https://norvig.com/sudoku.html,2006. Accessed: 2025-06-25. 23
2006
-
[17]
Accessed: 2025-06-23
Sudoku of the Day UK.http://www.sudokuoftheday.co.uk/. Accessed: 2025-06-23
2025
-
[18]
Difficulty rating of sudoku puzzles: An overview and evaluation.CoRR, abs/1403.7373, 2014
Radek Pelánek. Difficulty rating of sudoku puzzles: An overview and evaluation.CoRR, abs/1403.7373, 2014
2014 arXiv
-
[19]
A sudoku-solver for large puzzles using sat
Uwe Pfeiffer, Tomas Karnagel, and Guido Scheffler. A sudoku-solver for large puzzles using sat. InLPAR short papers (Yogyakarta), pages 52–57, 2010
2010
-
[20]
Sudoku-bench: Evaluating creative reasoning with sudoku variants.arXiv preprint arXiv:2505.16135, 2025
Jeffrey Seely, Yuki Imajuku, Tianyu Zhao, Edoardo Cetin, and Llion Jones. Sudoku-bench: Evaluating creative reasoning with sudoku variants.arXiv preprint arXiv:2505.16135, 2025
2025 arXiv
-
[21]
Causal language modeling can elicit search and reasoning capabilities on logic puzzles.ArXiv, abs/2409.10502, 2024
Kulin Shah, Nishanth Dikkala, Xin Wang, and Rina Panigrahy. Causal language modeling can elicit search and reasoning capabilities on logic puzzles.ArXiv, abs/2409.10502, 2024
2024 arXiv
-
[22]
Sudoku as a constraint problem
Helmut Simonis. Sudoku as a constraint problem. InCP Workshop on modeling and reformulating Constraint Satisfaction Problems, volume 12, pages 13–27. Citeseer Sitges, Spain, 2005
2005
-
[23]
https://www.extremesudoku.info/
Extreme Sudoku. https://www.extremesudoku.info/. Accessed: 2025-06-23
2025
-
[24]
https://sudoku.org.uk/Daily.asp
Sudoku.org.uk. https://sudoku.org.uk/Daily.asp. Accessed: 2025-06-23
2025
-
[25]
Equal-bin-width histogram versus equal-bin-count histogram.Journal of Applied Statistics, 48(12):2092–2111, 2021
Piotr Sulewski. Equal-bin-width histogram versus equal-bin-count histogram.Journal of Applied Statistics, 48(12):2092–2111, 2021
2021
-
[26]
Accessed: 2025-06-23
The New York Times.https://www.nytimes.com/puzzles/sudoku. Accessed: 2025-06-23. 24
2025
Reviewed August 6, 2026 · model on record in the stance chip above.
Discussion (0). Sign in to comment.