REVIEW 3 major objections 6 minor 52 references
DeepC4: Deep Conditional Census-Constrained Clustering for Large-scale Multitask Spatial Disaggregation of Urban Morphology
T0 review · 3 major / 6 minor · reviewed 2026-08-06 · deepseek-v4-flash
Pith's one-line read A deep constrained clustering method disaggregates Rwanda's census into per-pixel roof, wall, and height maps, matching national dwelling and occupant counts within about 1.1% error and beating existing large-scale exposure datasets.
desk verdict A well-built constrained clustering pipeline whose headline count accuracy is circular — the census constraints are the benchmark — but the integration and honest exposition make it worth refereeing. read the letter →
The pith
A machine-rendered reading of the paper's core claim, the machinery that carries it, and where it could break.
The reading
What carries the argument
The load-bearing object is a joint deep-clustering objective: an autoencoder maps 14 normalized input features (12 Sentinel-1/Sentinel-2 spectral and radar bands plus two pixel-location coordinates) into three latent channels, one each for roof, wall, and height. A constrained k-means, formulated as a minimum-cost flow problem, assigns every pixel to a cluster while enforcing that the number of pixels per class respects sector-level census counts that were pre-distributed into classes using conditional probabilities from an expert belief system. The total loss is an unweighted sum of reconstruction loss and a Euclidean-distance clustering loss, so the autoencoder and the constrained clustering are trained jointly, which the paper calls joint multitask learning.
What would settle it
Compare DeepC4's per-pixel roof, wall, and height predictions against a newly collected building-level survey in rural sectors outside Kigali for 2022; if rural macro-F1 falls markedly below the reported 0.63/0.78/0.45 while Kigali performance holds, the geographic generalizability claim fails.
Extended reading notes
Core claim
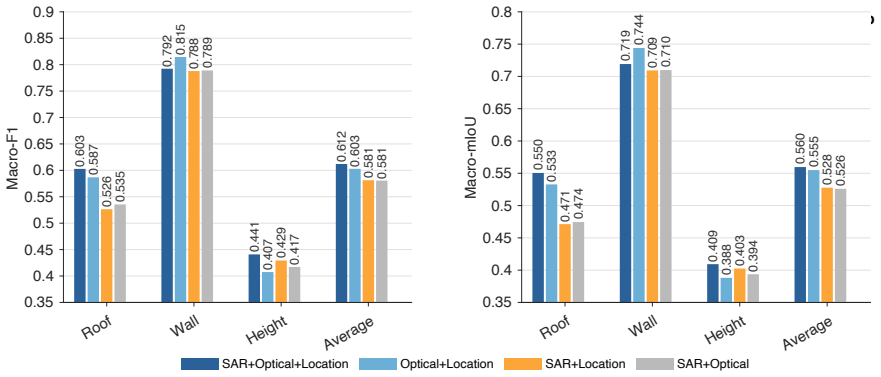
DeepC4's central claim is that weak and conditional supervision—sector-level census statistics plus expert-elicited probabilistic relationships among building attributes—can be encoded as hard constraints in a deep clustering pipeline, yielding both census-consistent national totals and spatially explicit building-attribute maps. The paper demonstrates this on Rwanda, where the method estimates 3,350,277 dwellings and 13,246,394 occupants against census records of 3,312,743 and 13,100,600, and where the inferred per-pixel classes, measured under a validity-based metric that allows many-to-many label matches, reach macro-F1 of 0.629 (roof), 0.784 (wall), and 0.451 (height). The authors claim that DeepC4 improves upon the GEM exposure model on total dwelling and occupant error and covers 32–49% more 500-meter grid cells than METEOR, consistent with 2022 urban development.
Load-bearing premise
The 2015 building-typology labels from Kigali City, covering only 30 of 416 Rwandan sectors (7.2%), are treated as valid ground truth for 2022 building conditions across the whole country, including rural areas far from Kigali.
Editorial extensions
If this is right
- National dwelling and occupant counts estimated from satellite imagery plus census constraints now land within about one percent of census records, a level of accuracy that could make deep disaggregation useful for updating exposure models between censuses.
- The joint multitask formulation learns interpretable latent channels: optical imagery dominates roof prediction, SAR dominates height prediction, and no single modality wins every task, so the method can guide sensor choice for future mapping.
- The robustness to loss-weighting (λ from 0.25 to 4.0 yields similar macro-F1) suggests the method is not finely tuned to a particular objective balance.
- Because the framework requires only census tables, public satellite imagery, and imperfect footprint sources, it is portable to other countries with similar data availability.
Reading between the lines
- An immediate testable extension is to apply DeepC4 to a second country with a recent census and publicly available footprints; if the roughly 1% national error transfers, the method is a general alternative to classical dasymetric disaggregation, while if it degrades sharply, the Rwanda result may hinge on the specific census and expert tables.
- The reported macro-F1 values are computed under a validity-based scheme that counts many-to-many label matches as correct, so cross-paper comparisons of F1 will only be meaningful if future work adopts the same validity matrices.
- Because clustering occurs at the sector level, roof and wall pie charts at province and district level largely mirror census proportions; the genuinely new information is the spatial placement and the height and macro-taxonomy distribution, so downstream risk models should treat the first two as constrained allocations rather than independent predictions.
Signed reviews
Editorial analysis
A structured set of objections, weighed in public.
Referee Report
Summary. The paper presents DeepC4, a deep constrained clustering method for spatial disaggregation of urban morphology indicators (roof, wall, height) from satellite imagery, with sector-level census statistics used as cluster-level constraints and conditional expert belief systems encoded as multilabel relationships. The method is demonstrated on Rwanda, and the paper reports national dwelling/occupant count errors of 1.13% and 1.11% versus census records, macro-F1 scores of 0.63, 0.78, and 0.45 for roof, wall, and height, and a claim of outperforming the GEM and METEOR exposure datasets. The paper also provides code and data availability.
Significance. If the reported accuracy were a genuine independent evaluation, the paper would offer a useful large-scale method for producing census-consistent urban morphology maps with explicit treatment of weak and conditional supervision. The constrained-clustering framework with deep feature learning and joint multitask optimization is a reasonable design direction, and the public release of code and data is a positive contribution. However, the headline accuracy claims are not what they appear, and the validation of the classification component is severely limited by geographic and temporal bias. The manuscript's main quantitative evidence is therefore not reliable, and its contribution as currently framed is substantially weakened.
major comments (3)
- [Section 3.1, 3.2, 3.3.3; Tables 2 and 3] The paper must either reframe the contribution as constraint satisfaction / census-consistent disaggregation, or provide an independent evaluation using withheld census information at a different administrative level or year. As written, the primary quantitative comparison is invalid.
- [Section 2.6, 3.3.5, 4.2] This is a load-bearing limitation because the paper's central promise is 'large-scale' mapping, and the only accuracy evidence is from 7.2% of sectors in one province, with labels that are seven years older than the imagery.
- [Section 4.1] The comparison against external baselines requires a clearly defined, independent validation protocol; as it stands, the comparison conflates the effect of imposing census constraints with the quality of the disaggregation itself.
minor comments (6)
- [Section 3.3.5] The cross-validation description is ambiguous: the text states that 'four sectors for each fold' are tested but also says 'six randomly selected sectors' are used for testing; the paper should clarify the exact split protocol.
- [Tables 4 and 5] The inter-model comparisons of macro-taxonomy and height distributions are presented without any ground truth, and the paper acknowledges this, but the 'informal' category shows a 137-144% difference that deserves a specific explanation rather than a general attribution to overlapping classes.
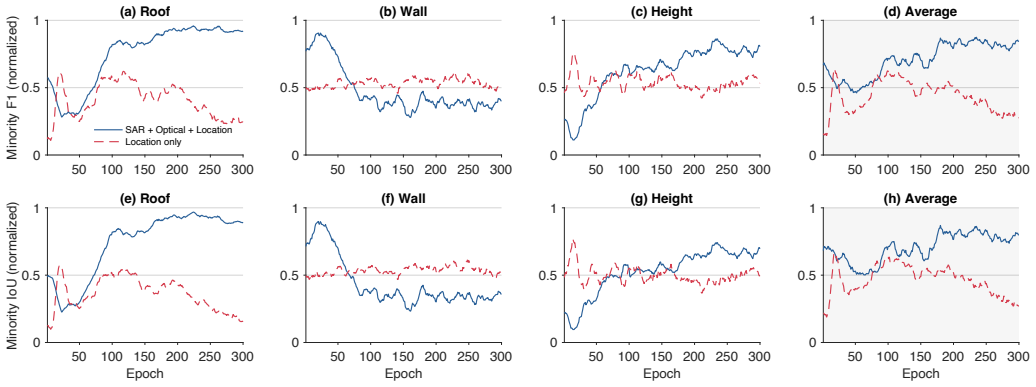
- [Section 4.2.3] The 'Location only' baseline is a useful control, but its construction is not fully specified: it appears to rely solely on location encoding features under the same cluster constraints, and the paper should state explicitly what features it uses and whether it is a form of spatial prior.
- [Section 4.3] The maps in Figure 8 for roof and wall 'merely reflect the proportion dictated by the official census records because the clustering occurs at the sector level'; this is an honest statement but it should be moved earlier in the paper, since it further supports the circularity concern.
- [Section 2.3 and Appendix A] The expert belief system probabilities are taken from a single source (Paul et al., 2022) without discussing their uncertainty or how they would be updated with additional expert input; the paper would benefit from a sensitivity analysis over the conditional probability values.
- [General] The paper uses several ad hoc thresholds (e.g., 60 m² building area, minority class <20%, probability thresholding in Section 3.2) without sensitivity analysis; a rigorous treatment of these free parameters would strengthen the methodological contribution.
Circularity Check
The national dwelling and occupant count accuracies are circular: the model is fed the very sector-level census totals used as the benchmark and is explicitly constrained to reproduce them, so the 1.13%/1.11% errors measure constraint satisfaction rather than predictive skill.
-
self definitional
[Section 3.1 and Section 3.3.3; compared in Table 2]
"For every sector s_i ... we computed its corresponding average household size, h_{s_i}, by taking the ratio of sector-level population and private household count. ... we then computed the number of dwellings for urban (d_{s_i,urban}) and rural (d_{s_i,rural}) by respectively dividing the urban and rural population by h_{s_i}. ... the total 'flow' to each possible cluster should follow the provided conditional constraints in the beginning because the total 'flow' refers to the desired minimum number of grid pixels for each possible cluster assignment."
The benchmark quantity 'census dwellings' is entered twice: once as the input census statistics used to build cluster-level constraints, and again as the final comparison target. The constrained k-means flow is required to assign exactly the census-derived number of pixels to each cluster. Therefore the DeepC4 dwelling total (3,350,277) in Table 2 is a forced reproduction of the census total (3,312,743), and the 1.13% error is a residual of constraint satisfaction, not an independent estimate.
-
fitted input called prediction
[Section 3.2]
"we iteratively constructed a set of possible grid pixels that could represent building presence. The overall procedure mainly relies on determining a threshold between 0 and 1 that interacts with the 2022 map of average probability of complete coverage by building area from the Dynamic World V1 dataset until the number of grid pixels, (n_constraint), at a particular threshold matches the transformed cluster-level constraints (i.e., the required number of grid pixels)."
The candidate building-pixel set is threshold-fitted so that its size exactly equals the transformed census constraint. This means the spatial footprint and hence the national building count are calibrated to the same census totals that later serve as the accuracy benchmark. A model placing buildings uniformly at random within each sector would achieve the same national totals, so this step provides no independent evidence of counting skill.
2 more flagged steps
-
self definitional
[Table 3]
"Occupant ... Rural 9,545,149 9,545,149 (0%) Urban 3,701,245 3,701,245 (0%)"
The occupant counts are literally the census occupant counts; the reported error is 0% by construction. Since occupant counts are derived by dividing census population by average household size and then applying the census population as the cluster-level total, the '1.11% national error' in the abstract is not a prediction but a restatement of the input.
-
other
[Abstract and Section 4.1.1]
"estimates national dwelling and occupant counts within 1.13% and 1.11% error compared to census records, outperforming GEM (2.03% and 3.29%) ... compared to GEM, which used a single average household size for the urban and rural areas of the entire Rwanda and five rows of data on population counts at the provincial level."
The comparison is not a fair test of prediction skill: DeepC4 is fed sector-level census totals directly and constrained to reproduce them, while GEM was given only provincial-level inputs. The 'outperforming GEM' result is an artifact of construction rather than evidence that the deep learning model recovered counts from imagery. The stated reason for DeepC4's advantage, using finer-grained census statistics, is exactly the same reason the comparison is forced.
full rationale
The central count-accuracy claims are circular. DeepC4's sector-level constraints are computed directly from census population and household size, converted to pixels, used to threshold the building-presence set to match n_constraint, and enforced by constrained k-means. Thus the national dwelling and occupant totals are reproductions of the census totals used as the benchmark; Table 3 makes the occupant case explicit with 0% error. The headline 1.13%/1.11% errors and the comparison against GEM therefore reduce by construction and do not demonstrate predictive skill. The classification results (roof, wall, height macro-F1 and IoU) are not circular: they are evaluated against the external 2015 Kigali building-typology labels of Bachofer et al. and involve genuine EO feature learning, ablation, and cross-validation. Those results are limited by geographic and temporal bias and by a validity-based scoring rule that accepts any admissible label, which is a validation weakness but not a circularity. No load-bearing self-citation or imported uniqueness theorem is used. Overall score is 7 because the paper's flagship count-accuracy claim is forced by definition while the multitask classification component retains independent empirical content.
Assumptions & free parameters
free parameters (7)
- Building ground-floor area = 60 m² =
60 m²
- Temporal scaling multipliers for GEM and METEOR =
1.05 (GEM), 1.37 (METEOR)
- Dynamic World built-area threshold =
Per-sector, iterative
- Loss weight lambda =
1.0
- Number of latent channels per indicator =
1 per indicator, 3 total
- Minority-class threshold =
20%
- Groundtruth-to-target class mapping tables =
Appendix B
assumptions (6)
- domain assumption Census sector-level statistics are accurate and consistent with 2022 building stock.
- domain assumption The expert belief system of Paul et al. (2022) describes Rwandan construction practice.
- domain assumption 2015 Kigali building typology labels approximate 2022 building attributes across Rwanda.
- domain assumption Satellite EO signals are informative about roof, wall, and height classes.
- domain assumption Combined building footprints plus Dynamic World identify the true set of building pixels.
- standard math Constrained k-means and integer linear programming solve the assignment problem as in Bradley et al. (2000).
Cite this review
Pith. "Pith review of DeepC4: Deep Conditional Census-Constrained Clustering for Large-scale Multitask Spatial Disaggregation of Urban Morphology." pith.science (2026). https://pith.science/paper/TDFZUABA
@misc{pith2026250722554,
  author       = {Pith},
  title        = {Pith review of: DeepC4: Deep Conditional Census-Constrained Clustering for Large-scale Multitask Spatial Disaggregation of Urban Morphology},
  year         = {2026},
  howpublished = {\url{https://pith.science/paper/TDFZUABA}},
  note         = {Machine review of arXiv:2507.22554}
}
read the original abstract
To understand our global progress for sustainable development and disaster risk reduction in many developing economies, two recent major initiatives - the Uniform African Exposure Dataset of the Global Earthquake Model (GEM) Foundation and the Modelling Exposure through Earth Observation Routines (METEOR) Project - implemented classical spatial disaggregation techniques to generate large-scale mapping of urban morphology using the information from various satellite imagery and its derivatives, geospatial datasets of the built environment, and subnational census statistics. However, the local discrepancy with well-validated census statistics and the propagated model uncertainties remain a challenge in such coarse-to-fine-grained mapping problems, specifically constrained by weak and conditional label supervision. Therefore, we present Deep Conditional Census-Constrained Clustering (DeepC4), a novel deep learning-based spatial disaggregation approach that incorporates local census statistics as cluster-level constraints while considering multiple conditional label relationships in a joint multitask learning of the patterns of satellite imagery. As a demonstration using Rwandan urban morphology, DeepC4 achieves macro-F1 scores of 0.63, 0.78, and 0.45 and macro-mIoU of 0.57, 0.71, and 0.42 for roof, wall, and height prediction respectively, estimates national dwelling and occupant counts within 1.13% and 1.11% error compared to census records, outperforming GEM (2.03% and 3.29%), and occupies 32%-49% more 500-meter grid pixels than METEOR across provinces. As the world approaches the conclusion of many global frameworks in 2030, our work offers a new deep learning-based mapping technique that explicitly encodes well-validated census and experts' belief systems to achieve an explainable and interpretable auditing of existing coarse-grained derived information at large scales.
Figures


Figures from the paper (6 more)



Reference graph
Works this paper leans on
-
[1]
write newline
" write newline "" before.all 'output.state := FUNCTION n.dashify 't := "" t empty not t #1 #1 substring "-" = t #1 #2 substring "--" = not "--" * t #2 global.max substring 't := t #1 #1 substring "-" = "-" * t #2 global.max substring 't := while if t #1 #1 substring * t #2 global.max substring 't := if while FUNCTION word.in bbl.in ":" * " " * FUNCTION f...
-
[2]
author Bachofer, F. , author Braun, A. , author Adamietz, F. , author Murray, S. , author d’Angelo, P. , author Kyazze, E. , author Mumuhire, A.P. , author Bower, J. , year 2019 . title Building stock and building typology of kigali, rwanda . journal Data volume 4 , pages 105
work page 2019
-
[3]
author Blei, A.M. , author Angel, S. , author Civco, D.L. , author Liu, Y. , author Zhang, X. , year 2018 . title Accuracy assessment and map comparisons for monitoring urban expansion: the atlas of urban expansion and the global human settlement layer . journal Lincoln Institute of Land Policy: Cambridge, MA, USA
work page 2018
-
[4]
author Bradley, P.S. , author Bennett, K.P. , author Demiriz, A. , year 2000 . title Constrained k-means clustering . journal Microsoft Research, Redmond volume 20 , pages 0
work page 2000
-
[5]
author Braun, A. , author Warth, G. , author Bachofer, F. , author Hochschild, V. , year 2019 . title Identification of roof materials in high-resolution multispectral images for urban planning and monitoring , pp. pages 1--4 . :10.1109/JURSE.2019.8809026
-
[6]
author Brown, C.F. , author Brumby, S.P. , author Guzder-Williams, B. , author Birch, T. , author Hyde, S.B. , author Mazzariello, J. , author Czerwinski, W. , author Pasquarella, V.J. , author Haertel, R. , author Ilyushchenko, S. , et al., year 2022 . title Dynamic world, near real-time global 10 m land use land cover mapping . journal Scientific Data v...
work page 2022
-
[7]
author Brzev, S. , author Scawthorn, C. , author Charleson, A.W. , author Allen, L. , author Greene, M. , author Jaiswal, K. , author Silva, V. , year 2013 . title GEM building taxonomy (Version 2.0) . type Technical Report . GEM Foundation
work page 2013
-
[8]
author Clark, C.N. , author Bedada, A. , author Huff, B. , author Lita, B. , author Newbury, A.B. , author Pacifici, F. , year 2023 . title Investigating the resolution-performance trade-off of object detection models in support of the sustainable development goals . journal IEEE Journal of Selected Topics in Applied Earth Observations and Remote Sensing ...
work page 2023
Show all 52 references
-
[9]
title Harmonized Sentinel-2 MSI: MultiSpectral Instrument, Level-2A
author Copernicus Sentinel data , year 2024 a. title Harmonized Sentinel-2 MSI: MultiSpectral Instrument, Level-2A . howpublished https://developers.google.com/earth-engine/datasets/catalog/COPERNICUS_S2_SR_HARMONIZED . note Accessed: 2024-07-30
2024
-
[10]
title Sentinel-1 SAR GRD: C-band Synthetic Aperture Radar Ground Range Detected, log scaling
author Copernicus Sentinel data , year 2024 b. title Sentinel-1 SAR GRD: C-band Synthetic Aperture Radar Ground Range Detected, log scaling . howpublished https://developers.google.com/earth-engine/datasets/catalog/COPERNICUS_S1_GRD . note Accessed: 2024-07-30
2024
-
[11]
title Sentinel-2: Cloud Probability
author Copernicus Sentinel data , year 2024 c. title Sentinel-2: Cloud Probability . howpublished https://developers.google.com/earth-engine/datasets/catalog/COPERNICUS_S2_CLOUD_PROBABILITY . note Accessed: 2024-07-30
2024
-
[12]
, author Ku \'e pi \'e , M
author Darin, E. , author Ku \'e pi \'e , M. , author Bassinga, H. , author Boo, G. , author Tatem, A.J. , author Reeve, P. , year 2022 . title The population seen from space: when satellite images come to the rescue of the census . journal Population volume 77 , pages 437--464
2022
-
[13]
, author Bennett, K.P
author Demiriz, A. , author Bennett, K.P. , author Bradley, P.S. , year 2008 . title Using assignment constraints to avoid empty clusters in k-means clustering . journal Constrained clustering: advances in algorithms, theory, and applications volume 201
2008
-
[14]
, year 2024 a
author Dimasaka, J. , year 2024 a. title Deep Conditional Census-Constrained Clustering (DeepC4) for Large-scale Multi-task Disaggregation of Urban Morphology . https://doi.org/10.5281/zenodo.13119552, :10.5281/zenodo.13119552
2024 doi
-
[15]
, year 2024 b
author Dimasaka, J. , year 2024 b. title DeepC4 . https://github.com/riskaudit/DeepC4
2024
-
[16]
, author Priesmeier, P
author Gei , C. , author Priesmeier, P. , author Aravena Pelizari, P. , author Soto Calderon, A.R. , author Schoepfer, E. , author Riedlinger, T. , author Villar Vega, M. , author Santa Mar \' a, H. , author G \'o mez Zapata, J.C. , author Pittore, M. , et al., year 2023 . tit...
2023
-
[17]
, author Thoma, M
author Gei , C. , author Thoma, M. , author Taubenb \"o ck, H. , year 2018 . title Cost-sensitive multitask active learning for characterization of urban environments with remote sensing . journal IEEE Geoscience and Remote Sensing Letters volume 15 , pages 922--926
2018
-
[18]
title OpenStreetMap Data Extracts
author Geofabrik GmbH , author OpenStreetMap Contributors , year 2018 . title OpenStreetMap Data Extracts . note URL https://download.geofabrik.de/. Accessed: 2024-07-30
2018
-
[19]
, author Carman, M
author Gevaert, C.M. , author Carman, M. , author Rosman, B. , author Georgiadou, Y. , author Soden, R. , year 2021 . title Fairness and accountability of ai in disaster risk management: Opportunities and challenges . journal Patterns volume 2
2021
-
[20]
title GADM database of global administrative areas, version 4.1
author Global Administrative Areas , year 2022 . title GADM database of global administrative areas, version 4.1 . howpublished https://gadm.org/maps/NOR.html . note To view a copy of the license of this work, visit https://gadm.org/license.html. Accessed: 2024-07-30
2022
-
[21]
, author Pittore, M
author G \'o mez Zapata, J.C. , author Pittore, M. , author Cotton, F. , author Lilienkamp, H. , author Shinde, S. , author Aguirre, P. , author Santa Mar \' a, H. , year 2022 . title Epistemic uncertainty of probabilistic building exposure compositions in scenario-based earth...
2022
-
[22]
, author Hancher, M
author Gorelick, N. , author Hancher, M. , author Dixon, M. , author Ilyushchenko, S. , author Thau, D. , author Moore, R. , year 2017 . title Google earth engine: Planetary-scale geospatial analysis for everyone . journal Remote Sensing of Environment https://doi.org/10.1016/...
2017 doi
-
[23]
, author Silva, V
author Gouveia, F. , author Silva, V. , author Lopes, J. , author Moreira, R.S. , author Torres, J.M. , author Simas Guerreiro, M. , year 2024 . title Automated identification of building features with deep learning for risk analysis . journal Discover Applied Sciences volume ...
2024
-
[24]
, year 1998
author Gr \"u nthal, G. , year 1998 . title European macroseismic scale 1998 volume 15 , pages 1--97
1998
-
[25]
, author Hall, J.J
author Huangfu, Q. , author Hall, J.J. , year 2018 . title Parallelizing the dual revised simplex method . journal Mathematical Programming Computation volume 10 , pages 119--142
2018
-
[26]
, author Hu, Z
author Huyck, C. , author Hu, Z. , author Amyx, P. , author Esquivias, G. , author Huyck, M. , author Eguchi, M. , year 2019 . title METEOR: exposure data classification, metadata population and confidence assessment. Report M3. 2/P . type Technical Report number M3. 2/P . Bri...
2019
-
[27]
, author Wald, D
author Jaiswal, K. , author Wald, D. , author Porter, K. , year 2010 . title A global building inventory for earthquake loss estimation and risk management . journal Earthquake Spectra volume 26 , pages 731--748
2010
-
[28]
, year 2014
author Kingma, D.P. , year 2014 . title Adam: A method for stochastic optimization . journal arXiv preprint arXiv:1412.6980
2014 arXiv
-
[29]
, author Whitman, R.V
author Kircher, C.A. , author Whitman, R.V. , author Holmes, W.T. , year 2006 . title Hazus earthquake loss estimation methods . journal Natural Hazards Review volume 7 , pages 45--59
2006
-
[30]
, author Zalite, K
author Koppel, K. , author Zalite, K. , author Voormansik, K. , author Jagdhuber, T. , year 2017 . title Sensitivity of sentinel-1 backscatter to characteristics of buildings . journal International Journal of Remote Sensing volume 38 , pages 6298–6318 . :10.1080/01431161.2017.1353160
2017
-
[31]
, author Vitalis, S
author Labetski, A. , author Vitalis, S. , author Biljecki, F. , author Arroyo Ohori, K. , author Stoter, J. , year 2023 . title 3d building metrics for urban morphology . journal International Journal of Geographical Information Science volume 37 , pages 36--67
2023
-
[32]
, author Gan c arski, P
author Lafabr \`e gue, B. , author Gan c arski, P. , year 2025 . title I-samarah, an incremental constrained clustering applied to remote sensing images . journal Neural Computing and Applications , pages 1--25
2025
-
[33]
, author Lafabregue, B
author Lampert, T. , author Lafabregue, B. , author Serrette, N. , author Vrain, C. , author Gan c arski, P. , et al., year 2019 . title Constrained distance-based clustering for satellite image time-series . journal IEEE Journal of Selected Topics in Applied Earth Observation...
2019
-
[34]
, author Hecht, R
author Meinel, G. , author Hecht, R. , author Herold, H. , year 2009 . title Analyzing building stock using topographic maps and gis . journal Building Research & Information volume 37 , pages 468--482
2009
-
[35]
title Global ML Building Footprints
author Microsoft , year 2024 . title Global ML Building Footprints . note URL: https://github.com/microsoft/GlobalMLBuildingFootprints. Accessed: 2024-07-30
2024
-
[36]
title Fifth Population and Housing Census - 2022
author National Institute of Statistics Rwanda , year 2023 . title Fifth Population and Housing Census - 2022 . howpublished https://www.statistics.gov.rw/datasource/fifth-population-and-housing-census-2022 . note This work is licensed under the Norwegian Licence for Creative ...
2023
-
[37]
title Overture Foundation Building Footprints
author Overture Maps Foundation , year 2023 . title Overture Foundation Building Footprints . note URL: https://beta.source.coop/repositories/cholmes/overture. Accessed: 2024-07-30
2023
-
[38]
, author Silva, V
author Paul, N. , author Silva, V. , author Amo-Oduro, D. , year 2022 . title Development of a uniform exposure model for the african continent for use in disaster risk assessment . journal International Journal of Disaster Risk Reduction volume 71 , pages 102823
2022
-
[39]
, author Schiavina, M
author Pesaresi, M. , author Schiavina, M. , author Politis, P. , author Freire, S. , author Krasnodebska, K. , author Uhl, J.H. , author Carioli, A. , author Corbane, C. , author Dijkstra, L. , author Florio, P. , et al., year 2024 . title Advances on the global human settlem...
2024
-
[40]
, author Lyon, A
author Petrarulo, L. , author Lyon, A. , author Paudyal, A. , author Zakaria, S. , author Sokile, C. , year 2022 . title METEOR: Legacy Evaluation Report M2. 11/P . type Technical Report number M2. 11/P . British Geological Survey
2022
-
[41]
, author Haas, M
author Pittore, M. , author Haas, M. , author Megalooikonomou, K.G. , year 2018 . title Risk-oriented, bottom-up modeling of building portfolios with faceted taxonomies . journal Frontiers in Built Environment volume 4 , pages 41
2018
-
[42]
, author Kvalbein, L
author Seljom, P. , author Kvalbein, L. , author Hellemo, L. , author Kaut, M. , author Ortiz, M.M. , year 2021 . title Stochastic modelling of variable renewables in long-term energy models: Dataset, scenario generation & quality of results . journal Energy volume 236 , pages 121415
2021
-
[43]
, author Sousa, R
author Silva, V. , author Sousa, R. , author Ribeiro Gouveia, F. , author Lopes, J. , author Guerreiro, M.J. , year 2024 . title A building imagery database for the calibration of machine learning algorithms . journal Earthquake Spectra volume 40 , pages 1577--1590
2024
-
[44]
, author Kashubin, S
author Sirko, W. , author Kashubin, S. , author Ritter, M. , author Annkah, A. , author Bouchareb, Y.S.E. , author Dauphin, Y. , author Keysers, D. , author Neumann, M. , author Cisse, M. , author Quinn, J. , year 2021 . title Continental-scale building detection from high res...
2021 arXiv
-
[45]
, author Gaughan, A.E
author Stevens, F.R. , author Gaughan, A.E. , author Linard, C. , author Tatem, A.J. , year 2015 . title Disaggregating census data for population mapping using random forests with remotely-sensed and ancillary data . journal PloS one volume 10 , pages e0107042
2015
-
[46]
, year 2017
author Tatem, A.J. , year 2017 . title Worldpop, open data for spatial demography . journal Scientific data volume 4 , pages 1--4
2017
-
[47]
title Resolution A/RES/70/1
author UN , year 2015 . title Resolution A/RES/70/1. Transforming Our World, the 2030 Agenda for Sustainable Development . type Technical Report . United Nations
2015
-
[48]
title Sendai Framework for Disaster Risk Reduction 2015–2030
author United Nations (UN) , year 2015 . title Sendai Framework for Disaster Risk Reduction 2015–2030 . type Technical Report . United Nations
2015
-
[49]
, author Cardie, C
author Wagstaff, K. , author Cardie, C. , author Rogers, S. , author Schr \"o dl, S. , et al., year 2001 . title Constrained k-means clustering with background knowledge , in: booktitle Icml , pp. pages 577--584
2001
-
[50]
, author Jochem, W.C
author Wardrop, N.A. , author Jochem, W.C. , author Bird, T.J. , author Chamberlain, H.R. , author Clarke, D. , author Kerr, D. , author Bengtsson, L. , author Juran, S. , author Seaman, V. , author Tatem, A.J. , year 2018 . title Spatially disaggregated population estimates i...
2018
-
[51]
, author Huang, Z
author Zhou, X. , author Huang, Z. , author Scheuer, B. , author Wang, H. , author Zhou, G. , author Liu, Y. , year 2023 . title High-resolution estimation of building energy consumption at the city level . journal Energy volume 275 , pages 127476
2023
-
[52]
, author Wang, D
author Zhu, S. , author Wang, D. , author Li, T. , year 2010 . title Data clustering with size constraints . journal Knowledge-Based Systems volume 23 , pages 883--889
2010
Reviewed August 6, 2026 · model on record in the stance chip above.
Discussion (0). Continue with ORCID to comment.