REVIEW 4 major objections 6 minor 48 references
VAR: Visual Analysis for Rashomon Set of Machine Learning Models' Performance
T0 review · 4 major / 6 minor · reviewed 2026-08-06 · deepseek-v4-flash
Pith's one-line read The paper proposes VAR, a visual analytics tool that maps each model's performance vector into a continuous RBF-interpolated space, rendered as heatmaps and scatter plots, so that developers can compare and select models across a Rashomon…
desk verdict A genuine but under-specified visualization tool for Rashomon sets; worth a referee, but the RBF mapping needs explicit definition and fidelity validation. read the letter →
The pith
A machine-rendered reading of the paper's core claim, the machinery that carries it, and where it could break.
The reading
What carries the argument
The object that carries the argument is the radial-basis-function interpolation map $\varphi(r) = \frac{r \log(1 + r^{0.5})}{1 + r^{0.1}}$, applied to a vector of each model's performance values with the models themselves as centers. The interpolation turns a discrete set of model metrics into a continuous surface, which the heatmap mode colors by predicted performance and the dot mode overlays with individual model points colored by a third metric. This is what converts the abstract claim that similar-performance models can be compared across features into a picture a developer can read for clusters, gradients, and outliers.
What would settle it
Take the 152-model credit-risk Rashomon set used in the paper, measure each model's true performance on a specific missing-data pattern, and compare those values with the heatmap color at the corresponding positions; if the interpolated surface misranks models relative to the measured values on substantial regions, the visualization is not faithful. A complementary check is a controlled trial where developers choose a target model from the same set using VAR versus using the raw numerical table, with the best model for each condition known in advance.
Extended reading notes
Core claim
The central claim is that an RBF-generated visual field makes the Rashomon set navigable for model selection. VAR represents each model by a vector of performance values over selected features, interpolates these vectors with a custom radial basis function, and presents the result in two complementary modes: a heatmap that colors the interpolated surface for global trends, and a dot plot in which each model is a point and a third metric is encoded in color. In the case studies the tool surfaces patterns such as shallow decision trees with few leaves matching deeper trees on test performance, and expert users report that they can screen models more quickly than with numerical tables. The contribution is a new way of seeing an existing model collection rather than a new model-building or optimization method.
Load-bearing premise
The guidance VAR gives is only as trustworthy as the smoothing map that turns model scores into colors and positions: if genuinely different models end up visually close, or genuinely similar models end up far apart, the tool would mislead rather than inform selection.
Editorial extensions
If this is right
- Rashomon-set analysis becomes a set-level task: a developer can filter hundreds of near-optimal trees by the feature conditions that matter for deployment instead of inspecting one model at a time.
- The two modes give complementary views, with the heatmap surfacing broad performance regions and the dot mode isolating individual models, so selection can proceed from landscape to specific point.
- The case studies indicate that simpler decision trees with fewer leaves can remain competitive on test accuracy and F1 inside a Rashomon set, which points to cheaper and more interpretable deployment candidates.
- Because the motivating scenario is missing data, VAR offers a way to ask which models stay valid when particular features are absent, a question that single-number accuracy tables answer poorly.
Reading between the lines
- Not stated in the paper, but implied by its design: the RBF machinery is model-agnostic, so any model family that yields a vector of per-condition performance scores could be fed into the same heatmap-and-dot view, including rule lists, additive models, or neural networks with feature-attribution vectors.
- Not stated in the paper: the appendix's comparison of 16 kernel functions is visual only, and a numeric interpolation-error benchmark against held-out model performance would settle whether the custom kernel genuinely adds value.
- The paper reports the 'shallow trees can match deep trees' pattern on two public datasets; a reader should treat it as illustrative rather than a general law.
Editorial analysis
A structured set of objections, weighed in public.
Referee Report
Summary. The paper proposes VAR, a web-based visual analytics tool for horizontally comparing models within a Rashomon set of machine learning models. VAR combines radial basis function (RBF) based heatmaps and scatter plots to visualize model performance across user-selected feature dimensions. The authors motivate the tool through interviews with ML developers, describe two visualization modes (RBF-heatmap and RBF-dot), and present case studies on FICO and COMPAS datasets along with qualitative feedback from five expert users. The central claim is that VAR enables developers to identify the optimal model under specific conditions and to better understand the overall characteristics of a Rashomon set.
Significance. The problem addressed is real and timely: as Rashomon-set enumeration methods mature, practitioners need tools to compare many near-optimal models horizontally, beyond the structural views offered by TimberTrek or GamChanger. If the RBF-based visual mapping were rigorously specified and validated, VAR could be a useful addition to the interpretable ML toolbox. The paper's strengths include a clear problem motivation grounded in interviews, the use of two public datasets, and an iterative design process that demonstrably incorporated expert feedback. However, the paper ships no code, no machine-checked derivation, and no quantitative validation; its effectiveness rests on anecdotal expert comments. The central methodological step, the RBF interpolation, is not described precisely enough to reproduce, and no fidelity check connects visual patterns to actual model similarities or performance differences. These issues currently prevent the paper from substantiating its stated contribution.
major comments (4)
- [§3.3] The RBF interpolation procedure is critically underspecified. The paper defines the kernel φ(r)=r·log(1+r^0.5)/(1+r^0.1) and states that model performance vectors are mapped into a continuous space, but it does not specify how the input vector x is constructed from model performance values, what the centers c_i are, whether the visualization solves an interpolation system or simply evaluates the kernel at grid points, how the two displayed dimensions are chosen, or how the color field is computed from kernel values. Without this algorithm, the heatmaps and dot plots cannot be reproduced, and the claim that users can trust the visual patterns to identify optimal models is not auditable.
- [§3.3] There is an internal contradiction about whether interpolation is used. Section 3.2 states that RBF interpolation underlies the mapping of model performance into the visual space, and Section 3.3 says 'both visualization modes rely on RBF interpolation.' A few paragraphs later, however, Section 3.3 says the RBF-dot mode 'avoids interpolation' and is 'more precise for examining actual data points.' This is inconsistent, especially because the same subsection says the dot color is 'calculated by the RBF based on its position.' The authors must clarify exactly which quantities are interpolated in each mode and reconcile these statements.
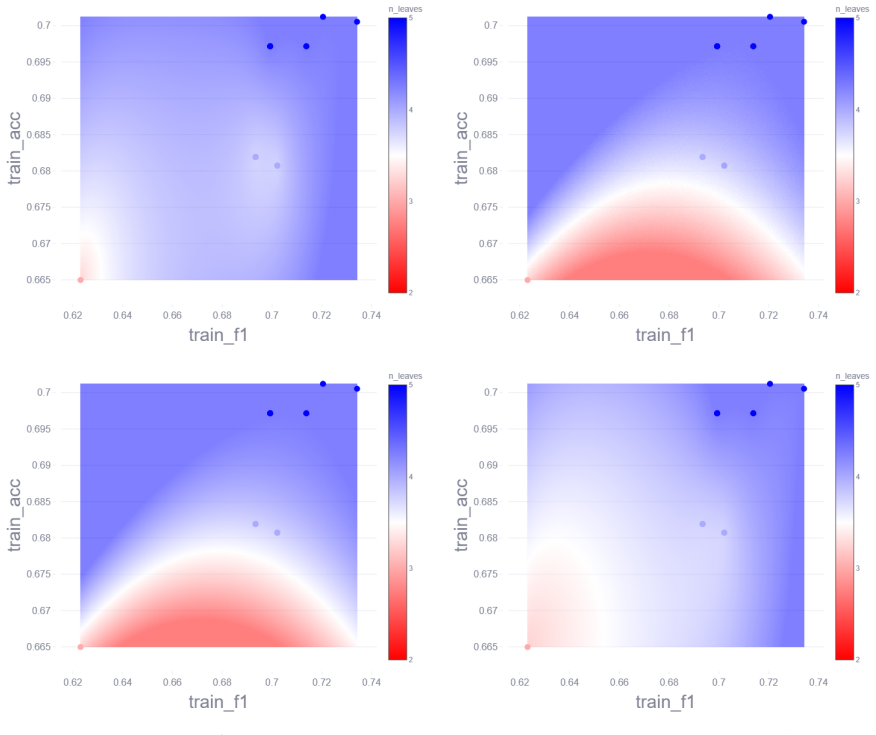
- [Appendix 8] The kernel-function comparison in Appendix 8 shows that 16 different kernel choices produce visibly different heatmaps from the same data, yet the paper offers no criterion for selecting a faithful kernel and no ground truth for what the visual colors should represent. If the visualizations change substantially with the kernel choice, then the claim in Section 3.2 that the chosen kernel 'maintains a balance between local adaptability and global smoothness' is not enough to guarantee that the displayed patterns reflect true model similarities or performance gradients. The authors should provide a validation, for example by showing that spatial proximity or color values in the chosen visualization correlate with a quantitative model-similarity metric, or by performing a user study with known ground-truth model rankings.
- [§5] The user evaluation in Section 5 is purely qualitative: five experts give anecdotal comments, with no ground-truth model-selection task, no pre-registered success criteria, and no quantitative comparison against a baseline method. The paper's abstract claims that VAR enables developers to 'identify the optimal model under specific conditions,' but the evaluation does not measure whether experts' selections matched the true optimal model or whether VAR outperformed numerical analysis in any measurable way. The effectiveness claim therefore remains unsupported. A structured evaluation (e.g., tasks where the correct selection is known, with accuracy and time measurements) is needed.
minor comments (6)
- [Abstract and Title] The abstract states that VAR combines heatmaps and scatter plots but does not mention the RBF method that is central to the paper; including it would better set reader expectations.
- [Figure 1] The caption for Figure 1 says (a) is 'Comparison of the performance of 152 models on the test set' but then says 'The color represents the train loss.' This is confusing; clarify whether the displayed metric is train or test, and similarly for Figure 9.
- [§3.3] The phrase 'focusing primarily on filtering and comparing existing model results' is a bit vague; consider rephrasing to describe the concrete interaction (point size, color, axis selection) more precisely.
- [§4.1] The text says 'we observed that it is commonly known that shallower decision tree models represent simpler tree structures and should have lower prediction accuracy,' but the subsequent finding is that shallower trees can still perform well on the test set. The wording could be tightened to state the conventional expectation as a hypothesis rather than a fact.
- [§5.1] The experts are described as coming from 'O University' and 'Z Institution'; for a journal publication, the authors should either disclose these institutions or use more conventional anonymization, and should confirm that the experts consented to being quoted.
- [References] Several references are incomplete or inconsistently formatted, e.g., reference [41] lists author names in a nonstandard order and lacks a venue, and reference [31] is given as an arXiv ID without year or DOI. Please clean up the bibliography.
Circularity Check
No load-bearing circularity: VAR's visualizations directly encode measured model metrics, and the only self-citation is a non-essential design inspiration.
full rationale
The paper's claimed derivation chain is a visualization pipeline, not a predictive derivation. RBF interpolation is applied to model performance vectors to produce a smooth color field, but the heatmap and dot plots encode the same measured metrics (train/test accuracy, F1, leaf count, train loss) that the user is comparing; there is no fitted parameter renamed as a prediction and no out-of-sample claim. The specific kernel phi(r)=r*log(1+r^0.5)/(1+r^0.1) is introduced directly in Section 3.2 as an adopted ansatz, not smuggled in through a citation, and the Appendix 8 kernel comparison is exploratory rather than definitional. The only overlapping-author citation, [31] (Jin et al.), is used for 'inspiration' and design influence ('we drew inspiration from a previous paper [31]', 'visualization design draws inspiration from the design in Jin's work [31]'), but it does not supply the load-bearing result, kernel, or uniqueness claim; the case studies and custom kernel are presented in this paper. The Section 3.3 inconsistency (saying RBF-dot avoids interpolation after saying both modes rely on RBF interpolation) is a methodological coherence issue, not a circular reduction: no derived quantity is equivalent to its own input by construction. Accordingly, there are no circular steps; the minor non-load-bearing self-citation warrants only score 2.
Assumptions & free parameters
free parameters (4)
- rashomon_bound_adder =
0.03
- regularization =
0.02
- depth_budget =
4 (FICO), 5 (COMPAS)
- RBF kernel function =
phi(r) = r*log(1+r^0.5)/(1+r^0.1)
assumptions (4)
- domain assumption RBF interpolation of model performance vectors yields a faithful visual representation of model relationships.
- domain assumption Models can be meaningfully compared using two arbitrary feature axes plus a color dimension.
- ad hoc to paper The custom RBF kernel is appropriate without parameter tuning.
- domain assumption Feedback from five experts is representative of ML developers' needs.
Cite this review
Pith. "Pith review of VAR: Visual Analysis for Rashomon Set of Machine Learning Models' Performance." pith.science (2026). https://pith.science/paper/PDXQAFVX
@misc{pith2026250722556,
  author       = {Pith},
  title        = {Pith review of: VAR: Visual Analysis for Rashomon Set of Machine Learning Models' Performance},
  year         = {2026},
  howpublished = {\url{https://pith.science/paper/PDXQAFVX}},
  note         = {Machine review of arXiv:2507.22556}
}
read the original abstract
Evaluating the performance of closely matched machine learning(ML) models under specific conditions has long been a focus of researchers in the field of machine learning. The Rashomon set is a collection of closely matched ML models, encompassing a wide range of models with similar accuracies but different structures. Traditionally, the analysis of these sets has focused on vertical structural analysis, which involves comparing the corresponding features at various levels within the ML models. However, there has been a lack of effective visualization methods for horizontally comparing multiple models with specific features. We propose the VAR visualization solution. VAR uses visualization to perform comparisons of ML models within the Rashomon set. This solution combines heatmaps and scatter plots to facilitate the comparison. With the help of VAR, ML model developers can identify the optimal model under specific conditions and better understand the Rashomon set's overall characteristics.
Figures


Figures from the paper (9 more)




Reference graph
Works this paper leans on
-
[1]
L. Breiman, Statistical modeling: The two cultures (with comments and a rejoinder by the author), Statistical science 16 (2001) 199–231
work page 2001
-
[2]
Z. J. Wang, C. Zhong, R. Xin, T. Takagi, Z. Chen, D. H. Chau, C. Rudin, M. Seltzer, Timbertrek: ex- ploring and curating sparse decision trees with interactive visualization, in: 2022 IEEE Visualization and Visual Analytics (VIS), IEEE, 2022, pp. 60–64
work page 2022
-
[3]
L. Semenova, C. Rudin, R. Parr, On the existence of simpler machine learning models, in: Proceedings of the 2022 ACM Conference on Fairness, Accountability, and Transparency, 2022, pp. 1827–1858
work page 2022
-
[4]
L. Semenova, H. Chen, R. Parr, C. Rudin, A path to simpler models starts with noise, Advances in neural information processing systems 36 (2024)
work page 2024
-
[5]
L. M. Paes, R. Cruz, F. P. Calmon, M. Diaz, On the inevitability of the rashomon effect, in: 2023 IEEE International Symposium on Information Theory (ISIT), IEEE, 2023, pp. 549–554
work page 2023
-
[6]
C. Marx, F. Calmon, B. Ustun, Predictive multiplicity in classification, in: International Conference on Machine Learning, PMLR, 2020, pp. 6765–6774
work page 2020
-
[7]
J. Watson-Daniels, D. C. Parkes, B. Ustun, Predictive multiplicity in probabilistic classification, in: Proceedings of the AAAI Conference on Artificial Intelligence, volume 37, 2023, pp. 10306–10314
work page 2023
-
[8]
H. Hsu, F. Calmon, Rashomon capacity: A metric for predictive multiplicity in classification, Advances in Neural Information Processing Systems 35 (2022) 28988–29000
work page 2022
Show all 48 references
-
[9]
Sahoh, A
B. Sahoh, A. Choksuriwong, The role of explainable artificial intelligence in high-stakes decision- making systems: a systematic review, Journal of Ambient Intelligence and Humanized Computing 14 (2023) 7827–7843
2023
-
[10]
R. Xin, C. Zhong, Z. Chen, T. Takagi, M. Seltzer, C. Rudin, Exploring the whole rashomon set of sparse decision trees, Advances in neural information processing systems 35 (2022) 14071–14084
2022
-
[11]
Zhong, Z
C. Zhong, Z. Chen, J. Liu, M. Seltzer, C. Rudin, Exploring and interacting with the set of good sparse generalized additive models, Advances in neural information processing systems 36 (2024)
2024
-
[12]
Ciaperoni, H
M. Ciaperoni, H. Xiao, A. Gionis, Efficient exploration of the rashomon set of rule-set models, in: Proceedings of the 30th ACM SIGKDD Conference on Knowledge Discovery and Data Mining, 2024, pp. 478–489
2024
-
[13]
M. Liu, Y. Ning, Y. Ke, Y. Shang, B. Chakraborty, M. E. H. Ong, R. Vaughan, N. Liu, Faim: Fairness- aware interpretable modeling for trustworthy machine learning in healthcare, Patterns 5 (2024)
2024
-
[14]
Coston, A
A. Coston, A. Rambachan, A. Chouldechova, Characterizing fairness over the set of good models under selective labels, in: International Conference on Machine Learning, PMLR, 2021, pp. 2144– 2155
2021
-
[15]
Watson-Daniels, F
J. Watson-Daniels, F. d. P. Calmon, A. D’Amour, C. Long, D. C. Parkes, B. Ustun, Predictive churn with the set of good models, arXiv preprint arXiv:2402.07745 (2024)
2024 arXiv
-
[16]
Fisher, C
A. Fisher, C. Rudin, F. Dominici, All models are wrong, but many are useful: Learning a variable’s importance by studying an entire class of prediction models simultaneously, Journal of Machine Learning Research 20 (2019) 1–81
2019
-
[17]
Donnelly, S
J. Donnelly, S. Katta, C. Rudin, E. Browne, The rashomon importance distribution: Getting rid of unstable, single model-based variable importance, Advances in Neural Information Processing Systems 36 (2023) 6267–6279
2023
-
[18]
Smith, R
G. Smith, R. Mansilla, J. Goulding, Model class reliance for random forests, Advances in Neural Information Processing Systems 33 (2020) 22305–22315
2020
-
[19]
J. Dong, C. Rudin, Variable importance clouds: A way to explore variable importance for the set of good models, arXiv preprint arXiv:1901.03209 (2019)
2019 arXiv
-
[20]
Z. J. Wang, A. Kale, H. Nori, P. Stella, M. Nunnally, D. H. Chau, M. Vorvoreanu, J. W. Vaughan, R. Caruana, Gam changer: Editing generalized additive models with interactive visualization, arXiv preprint arXiv:2112.03245 (2021)
2021 arXiv
-
[21]
Biecek, H
P. Biecek, H. Baniecki, M. Krzyziński, D. Cook, Performance is not enough: the story told by a rashomon quartet, Journal of Computational and Graphical Statistics (2024) 1–6
2024
-
[22]
Rudin, C
C. Rudin, C. Zhong, L. Semenova, M. Seltzer, R. Parr, J. Liu, S. Katta, J. Donnelly, H. Chen, Z. Boner, Amazing things come from having many good models, arXiv preprint arXiv:2407.04846 (2024)
2024 arXiv
-
[23]
Sacha, M
D. Sacha, M. Kraus, D. A. Keim, M. Chen, Vis4ml: An ontology for visual analytics assisted machine learning, IEEE transactions on visualization and computer graphics 25 (2018) 385–395
2018
-
[24]
Chatzimparmpas, R
A. Chatzimparmpas, R. M. Martins, I. Jusufi, K. Kucher, F. Rossi, A. Kerren, The state of the art in enhancing trust in machine learning models with the use of visualizations, in: Computer Graphics Forum, volume 39, Wiley Online Library, 2020, pp. 713–756
2020
-
[25]
Sietzen, M
S. Sietzen, M. Lechner, J. Borowski, R. Hasani, M. Waldner, Interactive analysis of cnn robustness, in: Computer Graphics Forum, volume 40, Wiley Online Library, 2021, pp. 253–264
2021
-
[26]
Q. Shen, Y. Wu, Y. Jiang, W. Zeng, K. Alexis, A. Vianova, H. Qu, Visual interpretation of recurrent neural network on multi-dimensional time-series forecast, in: 2020 IEEE Pacific visualization symposium (PacificVis), IEEE, 2020, pp. 61–70
2020
-
[27]
Streeb, Y
D. Streeb, Y. Metz, U. Schlegel, B. Schneider, M. El-Assady, H. Neth, M. Chen, D. A. Keim, Task- based visual interactive modeling: Decision trees and rule-based classifiers, IEEE Transactions on Visualization and Computer Graphics 28 (2021) 3307–3323
2021
-
[28]
Gurung, T
R. Gurung, T. Lindgren, H. Boström, An interactive visual tool to enhance understanding of random forest predictions, in: In European Conference on Data Analysis (ECDA), 2019
2019
-
[29]
J. Wang, W. Zhang, H. Yang, C.-C. M. Yeh, L. Wang, Visual analytics for rnn-based deep re- inforcement learning, IEEE Transactions on Visualization and Computer Graphics 28 (2021) 4141–4155
2021
-
[30]
Z. Ye, M. Chen, Visualizing ensemble predictions of music mood, IEEE Transactions on Visualiza- tion and Computer Graphics 29 (2022) 864–874
2022
-
[31]
Y. Jin, A. Carrasco-Revilla, M. Chen, igaiva: Integrated generative ai and visual analytics in a machine learning workflow for text classification, 2024. URL: https://arxiv.org/abs/2409.15848. arXiv:2409.15848
2024 arXiv
-
[32]
Palaniyappan Velumani, M
R. Palaniyappan Velumani, M. Xia, J. Han, C. Wang, A. K. LAU, H. Qu, Aqx: Explaining air quality forecast for verifying domain knowledge using feature importance visualization, in: Proceedings of the 27th International Conference on Intelligent User Interfaces, 2022, pp. 720–733
2022
-
[33]
Q. Wang, Z. Xu, Z. Chen, Y. Wang, S. Liu, H. Qu, Visual analysis of discrimination in machine learning, IEEE Transactions on Visualization and Computer Graphics 27 (2020) 1470–1480
2020
-
[34]
J. R. Quinlan, Induction of decision trees, Mach. Learn. 1 (1986) 81–106. URL: https://doi.org/10. 1023/A:1022643204877. doi:10.1023/A:1022643204877
1986 doi
-
[35]
Breiman, J
L. Breiman, J. H. Friedman, R. A. Olshen, C. J. Stone, Classification and regression trees belmont, CA: Wadsworth International Group (1984)
1984
-
[36]
S. L. Salzberg, C4.5: Programs for machine learning by j. ross quinlan. morgan kaufmann publishers, inc., 1993, Machine Learning 16 (1994) 235–240. URL: https://doi.org/10.1007/BF00993309. doi: 10. 1007/BF00993309
1994 doi
-
[37]
R. J. Lewis, An introduction to classification and regression tree (cart) analysis, in: Annual meeting of the society for academic emergency medicine in San Francisco, California, volume 14, Citeseer, 2000
2000
-
[38]
Ye, J.-H
J. Ye, J.-H. Chow, J. Chen, Z. Zheng, Stochastic gradient boosted distributed decision trees, in: Proc. of the 18th ACM Conference on Information and Knowledge Management, CIKM ’09, Association for Computing Machinery, New York, NY, USA, 2009, p. 2061–2064. URL: https: //doi.o...
2009
-
[39]
G. Ke, Q. Meng, T. Finley, T. Wang, W. Chen, W. Ma, Q. Ye, T.-Y. Liu, Lightgbm: A highly efficient gradient boosting decision tree, in: I. Guyon, U. V. Luxburg, S. Bengio, H. Wallach, R. Fergus, S. Vishwanathan, R. Garnett (Eds.), Advances in Neural Information Processing Syst...
2017
-
[40]
T. Chen, C. Guestrin, XGBoost, in: Proc. of the 22nd ACM SIGKDD International Conference on Knowledge Discovery and Data Mining, ACM, 2016. URL: https://doi.org/10.11452F2939672. 2939785. doi:10.1145/2939672.2939785
2016
-
[41]
Hayden, Z
M. Hayden, Z. Chudi, A. Reto, K. Ilias, C. Jacques, R. Cynthia, S. Margo, Fast sparse decision tree optimization via reference ensembles, in: AAAI Conference on Artificial Intelligence, volume 36, 2022
2022
-
[42]
O’Reilly Media, Inc
A. Zheng, A. Casari, Feature engineering for machine learning: principles and techniques for data scientists, " O’Reilly Media, Inc. ", 2018
2018
-
[43]
Shneiderman, Human-centered AI, Oxford University Press, 2022
B. Shneiderman, Human-centered AI, Oxford University Press, 2022
2022
-
[44]
Shneiderman, Universal usability, Communications of the ACM 43 (2000) 84–91
B. Shneiderman, Universal usability, Communications of the ACM 43 (2000) 84–91
2000
-
[45]
H. Yang, C. Rudin, M. Seltzer, Scalable bayesian rule lists, in: International conference on machine learning, PMLR, 2017, pp. 3921–3930. APPENDICES OF VAR: Visual Analysis for Rashomon Set of Machine Learning Models’ Performance Yuanzhe Jin
2017
-
[46]
rashomon_bound_multiplier
Parameter Settings in the Experiment In the FICO dataset, the depth budget (depth_budget) is set to 4, which constrains the maximum depth of generated trees and ensures interpretability while maintaining reasonable model complexity. The Rashomon bound adder (rashomon_bound_add...
-
[47]
Four are in each cluster with the mathematical format above the Figure
Comparison of the different kernel functions for the RBF heatmap visualization We present 16 different types of kernel functions using the same data points. Four are in each cluster with the mathematical format above the Figure. In all the kernel functions below, 𝑟 represents ...
-
[48]
Figure 9: (a) RBF-heatmap mode (Left)
High Resolution Images Figure 8: Comparison of different kernel functions used in the RBF-heatmap mode: Paper used (top left), Exponential Root Kernel (top right), Sine Logarithmic Kernel (bottom left), and Hyperbolic Polynomial Kernel (bottom right). Figure 9: (a) RBF-heatmap...
Reviewed August 6, 2026 · model on record in the stance chip above.
Discussion (0). Sign in to comment.