REVIEW 4 major objections 5 minor 1 cited by
Automated Visualization Makeovers with LLMs
T0 review · 4 major / 5 minor · reviewed 2026-08-06 · deepseek-v4-flash
Pith's one-line read A modular prompting system lets a multimodal LLM critique charts from image or code, and the paper shows it catches objective structural errors like non-zero baselines and dual axes with perfect F1-scores, while stylistic issues like…
desk verdict Worth refereeing: a useful modular chart-critique system whose n=6 evaluation is too thin to support 'reliable'—resubmit with statistics and a baseline. read the letter →
The pith
A machine-rendered reading of the paper's core claim, the machinery that carries it, and where it could break.
The reading
What carries the argument
The central mechanism is a modular, multi-stage prompting pipeline: chart-type detection, threshold evaluation of chart properties, loading of chart-type-specific rules from a structured JSON rule file, issue detection with natural-language feedback, optional code correction when the input is code, and display of results. The rule sets codify best practices such as 'no more than 7 pie slices' and 'avoid dual axes for line charts'; the LLM performs the visual reasoning while the rules supply context and constrain the critique.
What would settle it
Run the identical modular prompting system on a corpus of real-world charts with independent human annotation of the same 12 error types; if the F1-scores for non-zero baselines and dual-axis issues drop noticeably from 1.00, or the mean absolute error in issue count rises well above 0.44, the central claim of reliable structural-error detection in realistic settings is refuted.
Extended reading notes
Core claim
The paper claims that a multimodal LLM, guided by a modular prompting pipeline that first detects the chart type, then loads chart-specific design rules and thresholds, can act as a semi-automatic visualization critic: given an image or code input, it identifies design violations, explains them, and optionally returns corrected code. In a synthetic evaluation of 72 images across 12 error types, the system attained perfect F1-scores (1.00) for Non-Zero Baselines and Dual Axis Issues, high scores for Too Many Slices, Improper Axis Scaling, and Inconsistent Bar Widths, and markedly lower scores for Inappropriate Colour Choices (0.46) and Overlapping Data Elements (0.63); the mean absolute error in the predicted number of issues was 0.44, with a slight tendency to underestimate. The authors conclude that objective structural errors can be caught reliably while stylistic issues remain more ambiguous.
Load-bearing premise
The load-bearing premise is that the 72-image synthetic dataset with manually curated labels is representative enough that the measured scores carry over to real, uncontrolled charts; the authors concede this is a limitation.
Editorial extensions
If this is right
- The system can function as an automated pre-publication linter for charts, catching objective structural errors before a graphic reaches an audience.
- For code-based inputs, the optional corrected-code output turns the tool into an educational aid that teaches better practice rather than just flagging problems.
- The strong contrast in F1-scores between structural and stylistic errors indicates that unambiguous, rule-codifiable checks are the main driver of success, while visual ambiguity limits performance.
- The mean absolute error of 0.44 and slight underestimation mean that on complex charts with overlapping issues, users should expect some errors to be missed or conflated.
- Because the system accepts both image and code inputs, it can critique charts produced across scripting libraries and GUI-based tools alike.
Reading between the lines
- Beyond the paper: because the rule files are external JSON, the system is effectively an editable linter; a user or organization could codify its own house style and enforce those preferences without retraining.
- Beyond the paper: the structural-versus-stylistic performance gap suggests a division of labour in which rule-codifiable checks can be automated today, while subjective aesthetic judgments will need user preferences, larger human-rated corpora, or learned models.
- Beyond the paper: the same modular chart-type detection and rule-loading pipeline could transfer to other visual artefacts such as maps, dashboards, or infographics, where analogous grammatical and stylistic error categories exist.
Editorial analysis
A structured set of objections, weighed in public.
Referee Report
Summary. The paper presents a multimodal LLM-based system for automated visualization critique. Given a chart image or the code that generated it, the system detects the chart type, loads chart-specific design rules from a JSON file, and prompts GPT-4o to identify violations such as non-zero baselines, dual-axis issues, or excessive pie slices, returning natural-language feedback and (for code inputs) corrected code. The authors evaluate the system on a synthetic dataset of 72 chart images spanning 12 error types, reporting per-error-type precision, recall, and F1, plus a mean absolute error (MAE) of 0.44 for the predicted number of issues. They conclude that the system performs reliably on objective structural errors while struggling with stylistic or ambiguous issues.
Significance. If the reported results are robust, the system is a useful educational tool for visualization makeovers and a nice demonstration of combining structured, chart-specific rules with the visual reasoning of a multimodal LLM. The paper's strengths include the explicit, modular prompt architecture; the release of the dataset on OSF; and the use of standard multi-label classification metrics. However, the evidence currently falls short of establishing the headline claim: the per-class sample size is just six images, each processed once, with no confidence intervals, no repeated runs, and no baseline or ablation comparison. These are not merely presentation issues; they directly affect whether the central claim of 'reliable' structural error detection is supported.
major comments (4)
- [Section 5 (Dataset) and Section 6 (Table 2)] The perfect F1 scores for Non-Zero Baselines and Dual Axis Issues are computed from only six positive examples per class, with each image processed exactly once by a non-deterministic LLM. With n=6, a single misclassification changes F1 by roughly 0.17, and even a recall of 6/6 carries a wide binomial 95% confidence interval (approximately 0.54-1.00). The paper should report confidence intervals via bootstrap or repeated sampling (e.g., multiple runs with varied temperature), or substantially increase the number of examples per error type. As written, the claim that the system 'performs reliably on objective structural errors' is underdetermined by the evaluation.
- [Section 4 (Implementation) vs. Section 6 (Results)] No baseline or ablation is reported. The contribution is a modular, chart-type-specific prompting pipeline, yet there is no comparison with a generic prompt that asks the same model to detect all 12 issues without chart-specific rules, nor with a non-modular rule set, nor with prior work such as Lo and Qu's evaluation of LLMs on misleading chart detection. Without such a comparison, the measured performance cannot be attributed to the proposed framework, and the claimed advantage over general prompting remains unsupported.
- [Section 6 (Metrics and MAE)] The overall MAE of 0.44 is a point estimate from a single run over 72 images, with no measure of variance, confidence interval, or significance test. The comparison between single-error (0.37) and multi-error (0.51) subsets likewise lacks uncertainty quantification, and the difference is not shown to be meaningful at this sample size. The paper should provide bootstrap intervals or repeated-run statistics for the MAE and for the single/multi-error split.
- [Section 7 (Conclusion & Future Work)] The authors correctly acknowledge that the evaluation relies on a curated, semi-synthetic dataset, but the central conclusion should be tempered accordingly in the abstract and introduction. Because the synthetic charts are created to exhibit the same error taxonomy that is encoded in the system's rule sets, the reported F1 scores measure rule-following on expected stimuli rather than independent visual-communication quality. Including at least a small set of real-world charts with qualitative analysis would help determine whether the 'objective structural error' finding generalizes beyond the controlled setting.
minor comments (5)
- [Section 8 (Acknowledgments)] Typo: 'provded' should be 'provided'.
- [Author affiliations] The second author's name appears as 'David A. Selby' in the header but 'David_antony.selby' in the footnote; the email formatting and the spacing in 'S. J. V ollmer' should be corrected.
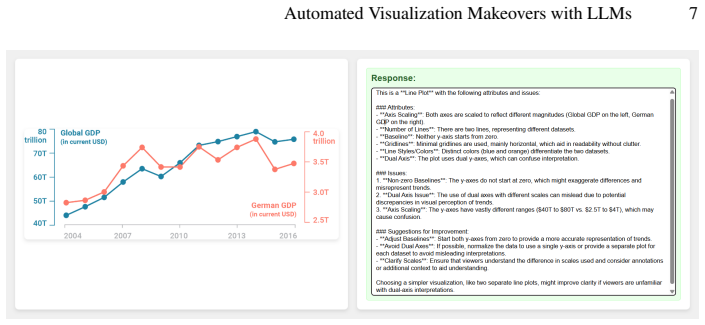
- [Section 4 (Implementation, Figure 2 description)] The text 'non-zeroy-axis baseline' should be 'non-zero y-axis baseline'.
- [Section 1 (Introduction)] The term '3-d effects' appears in the introduction; for consistency use '3D effects' as in the evaluation section.
- [Section 5 (Dataset)] The paper states 'Roughly 42% of the dataset (30 images) was designed to contain more than one error'; 30/72 is 41.7%, and the remaining 42 images are single-error. Please ensure the percentages and counts are reported consistently.
Circularity Check
No circularity: the evaluation measures GPT-4o's compliance with explicit, externally-sourced rule sets against manually annotated ground-truth labels; no fitted parameters or self-citations are involved.
full rationale
The paper's derivation chain is fully self-contained and non-circular. The claimed results (Section 6, Table 2) are measurements of a pre-trained LLM (GPT-4o) applying explicit, chart-type-specific rules stored in a JSON file; those rules are cited to external visualization sources (Tableau documentation [8], Datawrapper [14]) rather than derived from model outputs. Ground-truth labels (Section 5) were manually annotated for 72 synthetically generated charts, independently of the system's predictions. The evaluation is therefore a standard compliance test: does an independent model correctly apply a fixed rule set? That the model fails badly on subjective classes (Inappropriate Colour Choices F1 = 0.46, Overlapping Data Elements F1 = 0.63) demonstrates the results are not forced by construction. The perfect F1 scores for Non-Zero Baselines and Dual Axis Issues are computed from 6 positive examples each in a single run, which limits statistical confidence but is an evidence-strength concern, not circularity. The MAE (0.44) is a descriptive statistic over the same held-out set, not a fitted parameter renamed as a prediction. No parameter is fit to the test set, and no claim is justified by self-citation: the reference list contains no works by the present authors. The Section 7 limitation ('the evaluation relies on a curated, semi-synthetic dataset, which limits generalizability to uncontrolled, real-world inputs') concedes external-validity limits rather than circularity. The taxonomy shared between the rule set and the annotation scheme is standard benchmark design, since the LLM never sees the labels.
Assumptions & free parameters
free parameters (2)
- Pie slice count threshold =
Seven slices (rule embedded in JSON prompt)
- Other chart-specific thresholds =
Not stated in paper
assumptions (3)
- domain assumption GPT-4o's visual perception can reliably read chart elements from bitmap images and apply textual rules to them.
- domain assumption The 12 error types and their labels in the synthetic dataset cover the most important real-world visualization issues.
- domain assumption The predefined best-practice rules (avoid dual axes, zero baseline, etc.) are valid and uncontroversial.
Cite this review
Pith. "Pith review of Automated Visualization Makeovers with LLMs." pith.science (2026). https://pith.science/paper/LTR73R2C
@misc{pith2026250805637,
  author       = {Pith},
  title        = {Pith review of: Automated Visualization Makeovers with LLMs},
  year         = {2026},
  howpublished = {\url{https://pith.science/paper/LTR73R2C}},
  note         = {Machine review of arXiv:2508.05637}
}
read the original abstract
Making a good graphic that accurately and efficiently conveys the desired message to the audience is both an art and a science, typically not taught in the data science curriculum. Visualisation makeovers are exercises where the community exchange feedback to improve charts and data visualizations. Can multi-modal large language models (LLMs) emulate this task? Given a plot in the form of an image file, or the code used to generate it, an LLM, primed with a list of visualization best practices, is employed to semi-automatically generate constructive criticism to produce a better plot. Our system is centred around prompt engineering of a pre-trained model, relying on a combination of userspecified guidelines and any latent knowledge of data visualization practices that might lie within an LLMs training corpus. Unlike other works, the focus is not on generating valid visualization scripts from raw data or prompts, but on educating the user how to improve their existing data visualizations according to an interpretation of best practices. A quantitative evaluation is performed to measure the sensitivity of the LLM agent to various plotting issues across different chart types. We make the tool available as a simple self-hosted applet with an accessible Web interface.
Figures

Forward citations
Cited by 1 Pith paper
-
Structured Visualization Design Knowledge for Grounding Generative Reasoning and Situated Feedback
A role-annotated guideline scheme makes visualization design knowledge machine-queryable and source-traceable, demonstrated with a 744-guideline catalog and embedding-based analyses.
Reference graph
Works this paper leans on
-
[1]
B. Bach, M. Keck, F. Rajabiyazdi, T. Losev, I. Meirelles, J. Dykes, R. S. Laramee, M. AlKadi, C. Stoiber, S. Huron, C. Perin, L. Morais, W. Aigner, D. Kosminsky, M. Boucher, S. Knud- sen, A. Manataki, J. Aerts, U. Hinrichs, J. C. Roberts, and S. Carpendale. Challenges and opportunities in data visualization education: A call to action. IEEE Transactions o...
arXiv 2024
-
[3]
Q. Chen, F. Sun, X. Xu, Z. Chen, J. Wang, and N. Cao. Vizlinter: A linter and fixer frame- work for data visualization. IEEE Transactions on Visualization and Computer Graphics , 28(1):206–216, 2022. doi: 10.1109/TVCG.2021.3114804
arXiv 2022
-
[4]
J. Choi, J. Lee, and J. Jo. Bavisitter: Integrating design guidelines into large language models for visualization authoring. In 2024 IEEE Visualization and Visual Analytics (VIS), pp. 121– 125, 2024. doi: 10.1109/VIS55277.2024.00032
arXiv 2024
-
[5]
V . Dibia. LIDA: A tool for automatic generation of grammar-agnostic visualizations and infographics using large language models. In D. Bollegala, R. Huang, and A. Ritter, eds., Proceedings of the 61st Annual Meeting of the Association for Computational Linguistics (V olume 3: System Demonstrations), pp. 113–126. Association for Computational Linguis- tic...
-
[6]
A. Hopkins, M. Correll, and A. Satyanarayan. VisuaLint: Sketchy in situ annotations of chart construction errors. In Proceedings of the Eurographics Conference on Visualization (EuroVis), vol. 29, July 2020. doi: 10.1111/cgf.13975
-
[7]
N. W. Kim, G. Myers, and B. Bach. How good is ChatGPT in giving advice on your visual- ization design?, Apr. 2024. doi: 10.48550/arXiv.2310.09617
-
[8]
S. Kraemer. How to spot misleading charts: Check the axes. https://www.tableau.com/ blog/how-spot-misleading-charts-check-axes , 2024
work page 2024
-
[9]
A. Kriebel and E. Murray. #MakeoverMonday: Improving how we visualize and analyze data, one chart at a time . John Wiley & Sons, Oct. 2018
work page 2018
Show all 16 references
- [10]
-
[11]
L. Y .-H. Lo, Y . Cao, L. Yang, and H. Qu. Why change my design: Explaining poorly con- structed visualization designs with explorable explanations. IEEE Transactions on Visual- ization and Computer Graphics , 30(1):955–964, Jan. 2024. doi: 10.1109/TVCG.2023.3327155
2024
-
[12]
L. Y .-H. Lo, A. Gupta, K. Shigyo, A. Wu, E. Bertini, and H. Qu. Misinformed by visual- ization: What do we learn from misinformative visualizations? Computer Graphics F orum, 41(3):515–525, Aug. 2022. doi: 10.1111/cgf.14559
2022 doi
-
[13]
L. Y .-H. Lo and H. Qu. How good (or bad) are LLMs at detecting misleading visualizations? IEEE Transactions on Visualization and Computer Graphics , 31(1):1116–1125, Jan. 2025. doi: 10.1109/TVCG.2024.3456333
2025
-
[14]
L. C. Muth. Why not to use two axes, and what to use instead. https://www. datawrapper.de/blog/dualaxis, 2018
2018
-
[15]
Achiam, S
OpenAI, J. Achiam, S. Adler, S. Agarwal, L. Ahmad, I. Akkaya, F. L. Aleman, D. Almeida, J. Altenschmidt, S. Altman, S. Anadkat, R. Avila, I. Babuschkin, S. Balaji, V . Balcom, P. Bal- tescu, H. Bao, M. Bavarian, J. Belgum, I. Bello, J. Berdine, G. Bernadett-Shapiro, C. Berner,...
2024
-
[16]
L. Shen, E. Shen, Y . Luo, X. Yang, X. Hu, X. Zhang, Z. Tai, and J. Wang. Towards natural language interfaces for data visualization: A survey.IEEE Transactions on Visualization and Computer Graphics, 29(6):3121–3144, June 2023. doi: 10.1109/TVCG.2022.3148007
2023
- [17]
Reviewed August 6, 2026 · model on record in the stance chip above.
Discussion (0). Continue with ORCID to comment.