REVIEW 4 major objections 5 minor 45 references
Machine Learning Power Week 2023: Clustering in Hadronic Calorimeters
T0 review · 4 major / 5 minor · reviewed 2026-08-05 · deepseek-v4-flash
Pith's one-line read A one-week graduate-student machine-learning competition produced seven clustering algorithms for the ePIC forward hadronic calorimeter that all outperformed a K-means benchmark, with the best reaching a weighted V-score of 0.96692.
desk verdict A transparent workshop report whose headline ranking is undermined by its own metric; read it for the qualitative insights, not for the V-score table. read the letter →
The pith
A machine-rendered reading of the paper's core claim, the machinery that carries it, and where it could break.
The reading
What carries the argument
The weighted V-score is the single number that ranks all submissions: $V = 2 \cdot \mathrm{hom} \cdot \mathrm{com} / (\mathrm{hom} + \mathrm{com})$, where homogeneity measures how much a cluster contains hits from only one particle, completeness measures how much a particle's hits are captured in one cluster, and both are weighted by hit energy. The algorithmic workhorse is K-means with a per-event estimate of the number of clusters $k$: most submissions predict $k$ from event-level features such as hit count and total energy, often via linear or quadratic regression, then run K-means in spherical coordinates $\phi,\theta$ rather than Cartesian. The graph-based submission replaces that estim
What would settle it
Recompute the weighted V-score separately for each test event and average it over events, using the same test set. The paper already reports that one algorithm's merged-event score was 0.965 while its average over 100-event subsets was 0.433; if under per-event scoring any of the seven submissions falls below the benchmark's per-event score, the paper's headline claim that every team beat the benchmark is false for that metric.
Extended reading notes
Core claim
This paper reports the results of a machine-learning "Power Week" held in July 2023, in which seven teams of graduate students developed clustering algorithms for the longitudinally segmented forward hadronic calorimeter (LFHCal) of the ePIC detector at the planned Electron-Ion Collider. The algorithms group simulated energy deposits into clusters corresponding to individual particles, a task made difficult by unknown particle multiplicity, dense hits near the beamline, and overlapping showers. The paper's central claim is that the week demonstrated crowd-sourced development works for future facilities: all seven teams beat the K-means benchmark on the competition's weighted V-score, and the
Load-bearing premise
The comparison of all seven submissions rests on a single weighted V-score computed by merging all test events into one clustering problem, a method the paper itself says gives artificially high scores; if that metric does not reflect per-event clustering quality, the ranking and the claim that every team beat the benchmark do not follow.
Editorial extensions
If this is right
- If crowd-sourced competitions prove effective for ePIC, future facilities can release detector simulations publicly and use external groups to help develop reconstruction algorithms before the detector design is finalised.
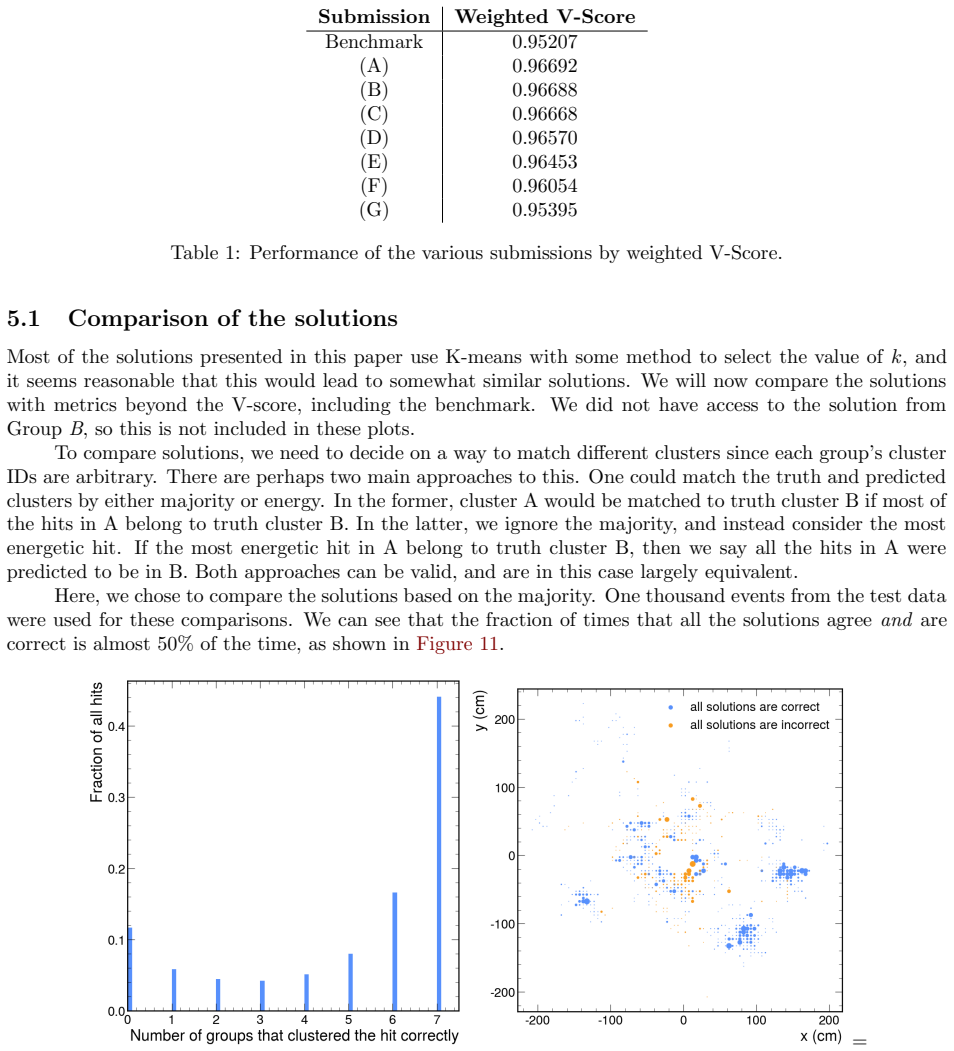
- All algorithms struggle most near the beamline; 97% of cases where every solution was wrong involved hits within ±80 cm in the transverse plane, so improving that region is the clearest path to better clustering.
- K-means with a good per-event $k$ estimate is a strong baseline for calorimeter clustering: it outperformed autoencoders, neural-regression variants, and an anti-$k_T$ approach within the week-long competition.
- The graph-based solution's edge classifier reached an AUC of 0.998, and the authors expect that using more training data, a GNN or transformer edge model, and a better seed-selection scheme would improve it further.
- The merged-event scoring method used in the competition should be replaced in future challenges; the paper reports that one algorithm scored 0.965 on 5000 merged events but only 0.433 when averaged over 100-event subsets.
- A single accuracy number is not enough to evaluate a clustering algorithm for downstream physics; the authors recommend benchmarking against task-specific metrics such as reconstructed-energy resolution in addition to the V-score.
Reading between the lines
- One consequence not stated directly: because the Table 1 ranking uses merged-event V-scores, the ordering of the seven submissions—and even the claim that every team beat the benchmark—should be treated as provisional until per-event average V-scores and a downstream metric are reported for each submission.
- The paper's failure map suggests a natural testable extension that the authors only hint at: a two-stage clustering algorithm that first handles the dense beamline region separately and then clusters the rest of the detector should recover most of the roughly 10% accuracy lost there.
- The dominance of K-means with a per-event $k$ estimate suggests that, for this dataset, the dominant source of clustering error is uncertainty in the number of clusters rather than in the geometric assignment; separating $k$-estimation error from assignment error would provide a sharper benchmark for future challenges.
- The graph-based method's strong edge-classifier performance in just one week, with only 20,000 training events and an MLP, implies that supervised graph approaches could overtake K-means once trained on the full 100,000-event sample with a more expressive edge model.
Editorial analysis
A structured set of objections, weighed in public.
Referee Report
Summary. The paper reports on an 'ML Power Week' workshop held in July 2023, in which seven graduate-student teams competed to build a clustering algorithm for the ePIC forward hadronic calorimeter at the future Electron-Ion Collider. Using a public Kaggle-style competition, participants developed solutions ranging from anti-kT jet clustering and K-means variants with learned cluster-number regressions to a graph-based seed-to-nonseed classifier. The paper presents the competition setup, describes each approach, and ranks submissions by a weighted V-score. Its central quantitative claim is that all seven teams beat the K-means benchmark, with the best score 0.96692 versus the benchmark 0.95207. The paper also draws qualitative conclusions about where algorithms fail (near the beamline) and offers feedback for future crowd-sourcing in HEP.
Significance. If the performance ranking were robust, this would be a useful demonstration that a one-week, student-led crowd-sourcing effort can generate competitive clustering solutions for a future detector, and the paper makes a fair contribution in documenting the format, dataset, and lessons learned. Strengths include the public release of the dataset and example code, the explicit discussion of metric limitations in Section 5.2, and the inclusion of several independent solution families. However, the central quantitative claim is currently not established: the Table 1 scores are computed on merged events, a protocol the authors themselves state gives artificially high values, and no uncertainties are provided on the very small score differences. As a workshop-report, the paper is readable and honest, but as a quantitative benchmark comparison it needs revision.
major comments (4)
- [Table 1 and Section 5.2] The headline claim that all teams beat the benchmark rests on weighted V-scores computed after merging test events. Section 5.2 states that this gives an artificially high score: one algorithm scores 0.965 across 5000 merged events but only 0.433 when averaged over 100-event subsets. Because the inflation is likely algorithm-dependent (cluster counts and assignments grow with event multiplicity), the ordering in Table 1 and even the benchmark comparison are not established. The gaps between submissions are tiny (A vs B differ by 0.00004) and no uncertainties are reported. Please re-score on a per-event basis with bootstrapped uncertainties and reframe the central claim accordingly.
- [Section 4.2 and Table 1] The benchmark K-means uses a fixed k=40, chosen explicitly 'so the students could easily beat the benchmark'. This makes the 'all teams beat benchmark' result weak evidence of genuine improvement. The comparison should include a stronger baseline, for example K-means with an adaptive cluster-number estimator matching the event multiplicity, or at least a clear caveat in the text.
- [Section 5.1 and Figure 12] The NMI comparison shows that the top solutions differ mostly in minor ways and that 'the choice of scoring metric leaves ambiguity'. This effectively concedes that the Table 1 ranking is not unique. To support the paper's conclusions, the authors should quantify how the ranking changes under per-event scoring and under different reasonable metrics (e.g., homogeneity or completeness alone, or an energy-weighted variant).
- [Section 4.4 and Table 2] The graph-based solution is described in Section 4.4 as an MLP edge classifier with KNN seed-to-nonseed connections, but Table 2 labels it 'Graph neural net'. This inconsistency obscures what was actually implemented. Please harmonize the description and either implement a GNN or call the model a graph-based MLP.
minor comments (5)
- [Section 2.2 and 2.3] The text says 100,000 simulated events are split into training and test samples, but Section 2.3 states only 50,000 training and 10,000 test events were used. Clarify whether the remaining 40,000 events were unused or held back.
- [Section 2.4, Equations (1)-(3)] The marginal probabilities p_i and p_j in Eq. (3) are not explicitly defined before use. Define them as cluster and class size fractions for clarity.
- [Section 5.1] The sentence 'The lowest score is solution E, but the lowest scoring solution in the Kaggle competition was G' is confusing because the discussion switches from NMI to V-score. Please specify which score each clause refers to.
- [Table 2] The team name 'Genuine Stupididy' appears to be a typo for 'Genuine Stupidity'.
- [Section 4.1.1] 'pseudo jets' should be 'pseudo-jets' for consistency with standard terminology.
Circularity Check
No circular derivation; the paper reports a competition, and its self-citations and metric caveats do not make a load-bearing result circular.
full rationale
This paper does not claim a derivation from first principles; it reports the setup and outcomes of a one-week Kaggle-style clustering challenge. The main quantitative claim, that all seven teams beat the K-means benchmark (Table 1), rests on the weighted V-score. Section 5.2 explicitly warns that the merged-event scoring protocol gives artificially high scores (0.965 over 5000 merged events vs. 0.433 averaged over 100-event subsets), but this is a metric-validity and ranking-reliability concern, not a circular reduction: the benchmark and submissions were evaluated under the same protocol, and the authors do not present the scores as an independently verified prediction. The benchmark's k=40 was chosen 'so the students could easily beat the benchmark' (Section 4.2), which limits the strength of the claim but does not make it circular. Hyperparameters such as anti-kT R=0.4, cluster-number regressions, the GNN seed count, and the edge threshold were tuned on the evaluation metric; this is standard competition practice and is not disguised as an independent derivation. Reference [26] is a code repository authored by the organizers, but it is cited as a resource, not as a load-bearing proof or uniqueness theorem. No equation is shown to equal its own input, and no fitted parameter is renamed as a prediction. The paper is self-contained as a report with acknowledged limitations, so no significant circularity is present.
Assumptions & free parameters
free parameters (6)
- anti-kT jet radius R =
0.4
- Benchmark number of clusters N =
40
- Graph model seed count Ns =
40
- Edge classifier threshold =
0.6
- Cluster-number regression coefficients =
various
- Weighted V-score energy weighting =
linear in energy
assumptions (4)
- domain assumption The particle-gun simulation is representative of ePIC forward calorimeter data
- domain assumption Ground-truth particle IDs from the simulation are correct
- domain assumption The V-score (homogeneity and completeness) is an appropriate clustering quality measure
- domain assumption K-means with Euclidean distance on spherical coordinates is a sensible baseline
Cite this review
Pith. "Pith review of Machine Learning Power Week 2023: Clustering in Hadronic Calorimeters." pith.science (2026). https://pith.science/paper/P33XNXQA
@misc{pith2026250809938,
  author       = {Pith},
  title        = {Pith review of: Machine Learning Power Week 2023: Clustering in Hadronic Calorimeters},
  year         = {2026},
  howpublished = {\url{https://pith.science/paper/P33XNXQA}},
  note         = {Machine review of arXiv:2508.09938}
}
read the original abstract
In both high-energy physics and industry applications, a crowd-sourced approach to difficult problems is becoming increasingly common. These innovative approaches are ideal for the development of future facilities where the simulations can be publicly distributed, such as the Electron-Ion Collider (EIC). In this paper, we discuss a so-called ``Power Week" where graduate students were able to learn about machine learning while also contributing to an unsolved problem at a future facility. Here, the problem of interest was the clustering of the forward hadronic calorimeter in the foreseen electron-proton/ion collider experiment (ePIC) detector at the EIC. The different possible approaches, developed over the course of a single week, and their performance are detailed and summarised. Feedback on the format of the week and recommendations for future similar programs are provided in the hopes to inspire future learning opportunities for students that also serve as a crowd-sourced approaches to unsolved problems.
Figures


Figures from the paper (9 more)



Reference graph
Works this paper leans on
-
[1]
The LHC Olympics 2020 a community challenge for anomaly detection in high energy physics
G. Kasieczka et al., “The LHC Olympics 2020 a community challenge for anomaly detection in high energy physics”, Rept. Prog. Phys. 84 (2021), no. 12, 124201, doi:10.1088/1361-6633/ac36b9, arXiv:2101.08320
arXiv 2020
-
[2]
Icecube - neutrinos in deep ice
A. C. L. H. P. E. R. Ørsøe Sohier Dane, “Icecube - neutrinos in deep ice”, 2023. https://kaggle.com/competitions/icecube-neutrinos-in-deep-ice
work page 2023
-
[3]
CaloChallenge 2022: A Community Challenge for Fast Calorimeter Simulation
O. Amram et al., “CaloChallenge 2022: A Community Challenge for Fast Calorimeter Simulation”, arXiv:2410.21611
arXiv 2022
-
[4]
F AIR Universe HiggsML Uncertainty Challenge Competition
W. Bhimji et al., “F AIR Universe HiggsML Uncertainty Challenge Competition”, arXiv:2410.02867
-
[5]
T. Aarrestad et al., “The Dark Machines Anomaly Score Challenge: Benchmark Data and Model Independent Event Classification for the Large Hadron Collider”, SciPost Phys. 12 (2022), no. 1, 043, doi:10.21468/SciPostPhys.12.1.043, arXiv:2105.14027
arXiv 2022
-
[6]
Electron Ion Collider: The Next QCD Frontier: Understanding the glue that binds us all
A. Accardi et al., “Electron Ion Collider: The Next QCD Frontier: Understanding the glue that binds us all”, Eur. Phys. J. A 52 (2016), no. 9, 268, doi:10.1140/epja/i2016-16268-9, arXiv:1212.1701
arXiv 2016
-
[7]
Snowmass 2021 White Paper: Electron Ion Collider for High Energy Physics
R. Abdul Khalek et al., “Snowmass 2021 White Paper: Electron Ion Collider for High Energy Physics”, arXiv:2203.13199
arXiv 2021
-
[8]
Artificial Intelligence for the Electron Ion Collider (AI4EIC)
C. Allaire et al., “Artificial Intelligence for the Electron Ion Collider (AI4EIC)”, Comput. Softw. Big Sci. 8 (2024) 5, doi:10.1007/s41781-024-00113-4 , arXiv:2307.08593
arXiv 2024
Show all 45 references
-
[9]
Hgs-hire power week - an epic competition
D. M. H. B. L. V. P. McCormack, “Hgs-hire power week - an epic competition”, 2023. https://kaggle.com/competitions/hgs-hire-power-week-an-epic-competition
2023
-
[10]
Scikit-learn: Machine Learning in Python
F. Pedregosa et al., “Scikit-learn: Machine Learning in Python ”, Journal of Machine Learning Research 12 (2011) 2825–2830
2011
-
[11]
Particle-flow reconstruction and global event description with the CMS detector
CMS Collaboration, “Particle-flow reconstruction and global event description with the CMS detector”, JINST 12 (2017), no. 10, P10003, doi:10.1088/1748-0221/12/10/P10003, arXiv:1706.04965
2017 arXiv
-
[12]
Fuzzy V-measure - an evaluation method for cluster analyses of ambiguous data
J. Utt, S. Springorum, M. K¨ oper, and S. Schulte im Walde, “Fuzzy V-measure - an evaluation method for cluster analyses of ambiguous data”, in Proceedings of the Ninth International Conference on Language Resources and Evaluation (LREC‘14) , N. Calzolari et al., eds., pp. 581...
2014
-
[13]
V-measure: A conditional entropy-based external cluster evaluation measure
A. Rosenberg and J. Hirschberg, “V-measure: A conditional entropy-based external cluster evaluation measure”, in Proceedings of the 2007 Joint Conference on Empirical Methods in Natural Language Processing and Computational Natural Language Learning (EMNLP-CoNLL) , J. Eisner, ...
2007
-
[14]
The CMS Experiment at the CERN LHC
CMS Collaboration, “The CMS Experiment at the CERN LHC”, JINST 3 (2008) S08004, doi:10.1088/1748-0221/3/08/S08004
2008 doi
-
[15]
The ATLAS experiment at the CERN Large Hadron Collider
ATLAS Collaboration, “The ATLAS experiment at the CERN Large Hadron Collider”, Journal of Instrumentation 3 (aug, 2008) S08003, doi:10.1088/1748-0221/3/08/S08003
2008 doi
-
[16]
Particle-flow reconstruction and global event description with the CMS detector
CMS Collaboration, “Particle-flow reconstruction and global event description with the CMS detector”, Journal of Instrumentation 12 (oct, 2017) P10003–P10003, doi:10.1088/1748-0221/12/10/p10003
2017 doi
-
[17]
Jet reconstruction and performance using particle flow with the ATLAS detector
ATLAS Collaboration, “Jet reconstruction and performance using particle flow with the ATLAS detector”, The European Physical Journal C 77 (jul, 2017) doi:10.1140/epjc/s10052-017-5031-2
2017 doi
-
[18]
Topological cell clustering in the ATLAS calorimeters and its performance in LHC Run 1
ATLAS Collaboration, “Topological cell clustering in the ATLAS calorimeters and its performance in LHC Run 1”, Eur. Phys. J. C 77 (2017) 490, doi:10.1140/epjc/s10052-017-5004-5 , arXiv:1603.02934. 17
2017 arXiv
-
[19]
Calorimeter Clustering Algorithms: Description and Performance
W. Lamplet al., “Calorimeter Clustering Algorithms: Description and Performance”, technical report, CERN, Geneva, 2008. All figures including auxiliary figures are available at https://atlas.web.cern.ch/Atlas/GROUPS/PHYSICS/PUBNOTES/ATL-LARG-PUB-2008-002
2008
-
[20]
The Iterative Clustering framework for the CMS HGCAL Reconstruction
CMS Collaboration, “The Iterative Clustering framework for the CMS HGCAL Reconstruction”, J. Phys. Conf. Ser. 2438 (2023), no. 1, 012096, doi:10.1088/1742-6596/2438/1/012096
2023 doi
-
[21]
Performance of the ALICE Electromagnetic Calorimeter
ALICE Collaboration, “Performance of the ALICE Electromagnetic Calorimeter”, JINST 18 (2023), no. 08, P08007, doi:10.1088/1748-0221/18/08/P08007, arXiv:2209.04216
2023 arXiv
-
[22]
Graph Clustering: a graph-based clustering algorithm for the electromagnetic calorimeter in LHCb
N. V. Canudas, M. Calvo G´ omez, X. Vilas ´ ıs-Cardona, and E. G. Rib´ e, “Graph Clustering: a graph-based clustering algorithm for the electromagnetic calorimeter in LHCb”, Eur. Phys. J. C 83 (2023), no. 2, 179, doi:10.1140/epjc/s10052-023-11332-1 , arXiv:2212.11061
2023 arXiv
-
[23]
The Phase-2 Upgrade of the CMS Endcap Calorimeter
CMS Collaboration, “The Phase-2 Upgrade of the CMS Endcap Calorimeter”, technical report, CERN, Geneva, 2017. doi:10.17181/CERN.IV8M.1JY2
2017 doi
-
[24]
Object condensation: one-stage grid-free multi-object reconstruction in physics detectors, graph, and image data
J. Kieseler, “Object condensation: one-stage grid-free multi-object reconstruction in physics detectors, graph, and image data”, The European Physical Journal C 80 (sep, 2020) doi:10.1140/epjc/s10052-020-08461-2
2020 doi
-
[25]
GNN-based end-to-end reconstruction in the CMS phase 2 high-granularity calorimeter
S. Bhattacharya et al., “GNN-based end-to-end reconstruction in the CMS phase 2 high-granularity calorimeter”, Journal of Physics: Conference Series 2438 (feb, 2023) 012090, doi:10.1088/1742-6596/2438/1/012090
2023 doi
-
[26]
ePIC Clustering 2023
P. McCormack, D. Murnane, H. Bossi, and L. Vage, “ePIC Clustering 2023”. https://github.com/wpmccormack/ePIC_Clustering_2023/tree/master, 2023
2023
-
[27]
Performance of the electromagnetic pixel calorimeter prototype epical-2
J. Alme et al., “Performance of the electromagnetic pixel calorimeter prototype epical-2”, Journal of Instrumentation 18 (01, 2023) P01038, doi:10.1088/1748-0221/18/01/P01038
2023 doi
-
[28]
The anti- kt jet clustering algorithm
M. Cacciari, G. P. Salam, and G. Soyez, “The anti- kt jet clustering algorithm”, JHEP 04 (2008) 063, doi:10.1088/1126-6708/2008/04/063, arXiv:0802.1189
2008 arXiv
-
[29]
FastJet user manual
M. Cacciari, G. P. Salam, and G. Soyez, “FastJet user manual”, The European Physical Journal C 72 (mar, 2012) doi:10.1140/epjc/s10052-012-1896-2
2012 doi
-
[30]
Applied Predictive Modeling
M. Kuhn and K. Johnson, “Applied Predictive Modeling”. Springer, 2013. ISBN 978-1-4614-6848-6
2013
-
[31]
Deep Learning
I. Goodfellow, Y. Bengio, and A. Courville, “Deep Learning”. MIT Press, 2016. http://www.deeplearningbook.org
2016
-
[32]
A density-based algorithm for discovering clusters in large spatial databases with noise
M. Ester et al., “A density-based algorithm for discovering clusters in large spatial databases with noise”, in Proceedings of the Second International Conference on Knowledge Discovery and Data Mining, KDD’96, p. 226–231. AAAI Press, 1996
1996
-
[33]
Ensemble methods in machine learning
T. G. Dietterich, “Ensemble methods in machine learning”, in Multiple Classifier Systems , pp. 1–15. Springer Berlin Heidelberg, Berlin, Heidelberg, 2000
2000
-
[34]
Inertia-based indices to determine the number of clusters in k-means: An experimental evaluation
A. Rykov, R. C. De Amorim, V. Makarenkov, and B. Mirkin, “Inertia-based indices to determine the number of clusters in k-means: An experimental evaluation”, IEEE Access 12 (2024) 11761–11773, doi:10.1109/ACCESS.2024.3350791
2024
-
[35]
Graph Neural Networks for Particle Reconstruction in High Energy Physics detectors
X. Juet al., “Graph Neural Networks for Particle Reconstruction in High Energy Physics detectors”, arXiv:2003.11603 [hep-ex, physics:physics] (June, 2020). arXiv: 2003.11603
2003 arXiv
-
[36]
ATLAS ITk Track Reconstruction with a GNN-based pipeline
ATLAS Collaboration, “ATLAS ITk Track Reconstruction with a GNN-based pipeline”, technical report, CERN, Geneva, 2022
2022
-
[37]
Graph Neural Network Jet Flavour Tagging with the ATLAS Detector
ATLAS, “Graph Neural Network Jet Flavour Tagging with the ATLAS Detector”, technical report, CERN, Geneva, 2022. All figures including auxiliary figures are available at https://atlas.web.cern.ch/Atlas/GROUPS/PHYSICS/PUBNOTES/ATL-PHYS-PUB-2022-027. 18
2022
-
[38]
Flavour tagging with graph neural networks with the ATLAS detector
ATLAS Collaboration, A. Duperrin, “Flavour tagging with graph neural networks with the ATLAS detector”, in 30th International Workshop on Deep-Inelastic Scattering and Related Subjects . 6, 2023. arXiv:2306.04415
2023 arXiv
-
[39]
Graph neural networks for low-energy event classification & reconstruction in IceCube
R. A. et al., “Graph neural networks for low-energy event classification & reconstruction in IceCube”, Journal of Instrumentation 17 (nov, 2022) P11003, doi:10.1088/1748-0221/17/11/p11003
2022 doi
-
[40]
GNN-based end-to-end reconstruction in the CMS Phase 2 High-Granularity Calorimeter
CMS Collaboration, “GNN-based end-to-end reconstruction in the CMS Phase 2 High-Granularity Calorimeter”, Technical Report 1, CERN, Geneva, 2023. doi:10.1088/1742-6596/2438/1/012090, arXiv:2203.01189, 5 pages, 5 figures, proceedings for the 20th International Workshop on Advan...
2023 arXiv
-
[41]
Graph Neural Networks in Particle Physics: Implementations, Innovations, and Challenges
S. Thais et al., “Graph Neural Networks in Particle Physics: Implementations, Innovations, and Challenges”, in Snowmass 2021 . 3, 2022. arXiv:2203.12852
2021 arXiv
-
[42]
Graph neural networks in particle physics
J. Shlomi, P. Battaglia, and J.-R. Vlimant, “Graph neural networks in particle physics”, Machine Learning: Science and Technology 2 (jan, 2021) 021001, doi:10.1088/2632-2153/abbf9a
2021 doi
-
[43]
An improved algorithm for finding the strongly connected components of a directed graph
D. J. Pearce, “An improved algorithm for finding the strongly connected components of a directed graph”, in Technical report, Victoria University, NZ . 2005
2005
-
[44]
SciPy 1.0: Fundamental Algorithms for Scientific Computing in Python
P. Virtanen et al., “SciPy 1.0: Fundamental Algorithms for Scientific Computing in Python”, Nature Methods 17 (2020) 261–272, doi:10.1038/s41592-019-0686-2
2020 doi
-
[45]
Information theoretic measures for clusterings comparison: Variants
N. Vinh, J. Epps, and J. Bailey, “Information theoretic measures for clusterings comparison: Variants”, Properties, Normalization and Correction for Chance 18 (2009). 19 Name Algorithm, N - finding Method Inputs to find N Coordinate System Kmeans Inputs Init. Sample W eight En...
2009
Reviewed August 5, 2026 · model on record in the stance chip above.
Discussion (0). Sign in to comment.