REVIEW 4 major objections 4 minor 4 references
Electron Ptychography Images Hydrogen Atom Superlattices and 3D Inhomogeneities in Palladium Hydride Nanoparticles
T0 review · 4 major / 4 minor · reviewed 2026-08-05 · deepseek-v4-flash
Pith's one-line read This paper uses electron ptychography to directly image hydrogen atoms inside palladium hydride nanocubes, revealing a one-dimensional hydrogen superlattice and a three-dimensional distribution that clusters near the surfaces.
desk verdict The 1D hydrogen superlattice in PdHx nanocubes is a real result; the 3D clustering claim rests on an interpolation step and should be framed as model-dependent. read the letter →
The pith
A machine-rendered reading of the paper's core claim, the machinery that carries it, and where it could break.
The reading
What carries the argument
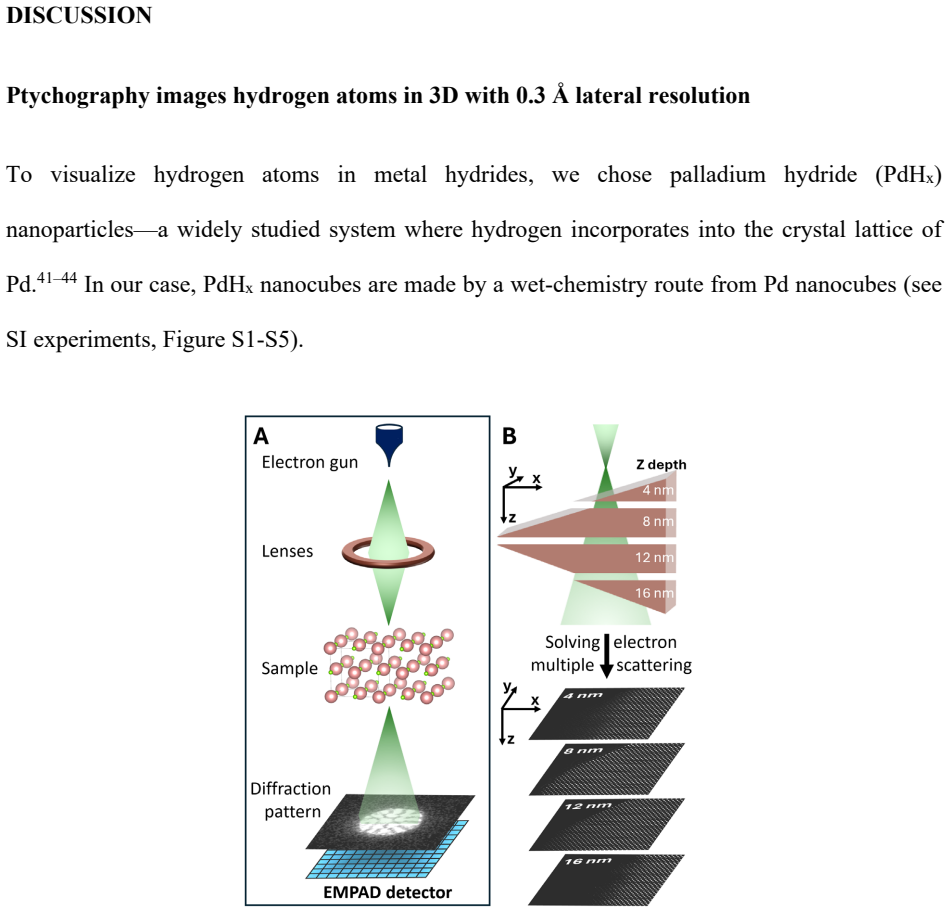
The central tool is multislice electron ptychography (MEP), a scanning transmission electron microscopy (STEM) method that records the full electron diffraction pattern at every probe position using a high-dynamic-range pixel-array detector, then inverts a forward multiple-scattering model to recover the three-dimensional electrostatic potential of the sample as a stack of ~1-nm-thick slices. By accounting for dynamical (multiple) scattering, MEP separates the weak hydrogen signal from the strong palladium background and extracts depth information from a single z-focus through the parallax of the diverging beam.
What would settle it
Reconstruct the same PdHx nanocube from an independent tilt series of ptychographic datasets (or with an algorithm that does not assume smooth interpolation between slices) and check whether the crescent-shaped hydrogen-rich region persists. If it disappears, the 3D clustering claim is an artifact of the shape interpolation used to connect 2D slices.
Extended reading notes
Core claim
The paper's central claim is that multislice electron ptychography can directly resolve individual hydrogen atoms inside a metal hydride at room temperature, and that doing so in PdH_x nanocubes reveals two previously unseen structural features. First, hydrogen occupies octahedral interstitial sites and orders into a one-dimensional superlattice along $[11\bar{1}]$, with alternating fully occupied and empty octahedral-site planes; this ordering is accompanied by a ±2% periodic strain wave in the Pd lattice along the same direction. Second, the hydrogen distribution is inhomogeneous in three dimensions: 1-nm-thick slices through the reconstruction show hydrogen aggregating in localized, cresc
Load-bearing premise
The crescent-shaped 3D hydrogen clustering is built by smoothly deforming 2D slices between adjacent depths; if hydrogen distribution changes abruptly between slices, the reported 3D shape is an artifact of that interpolation.
Editorial extensions
If this is right
- Hydrogen can self-order into room-temperature superlattices in nanoparticle palladium hydrides even when such order is absent in bulk, implying that nanoscale confinement or surface strain stabilizes new hydrogen arrangements.
- The periodic strain wave accompanying the hydrogen superlattice means hydrogen ordering directly modulates the host lattice, which should be visible in diffraction and may affect electronic and phononic properties.
- Hydrogen in these nanocubes is not uniform: it collects in a shell near the surface and leaves the core depleted, so hydrogen storage capacity and kinetics in nanoparticles are governed by near-surface sites rather than bulk occupancy.
- Because the superlattice is visible in only three of the six {110} projections, single-projection imaging or powder diffraction will often miss it; this explains why it has not been seen before and warns against relying on a single projection.
- Electron ptychography with depth slicing can now map light elements such as H, Li, and O in three dimensions at atomic resolution in thick, strongly scattering crystals, going beyond what ABF or iDPC can do.
Reading between the lines
- If the crescent-shaped hydrogen clustering is real, the effective hydrogen storage capacity of a nanocube is set by its surface-to-volume ratio, and smaller cubes would show a larger fraction of H-rich shell—an easily testable size-dependence prediction.
- The interpolation-based 3D reconstruction is the main assumption; a tilt-series or through-focal ptychography experiment on the same cube would either confirm the crescent shape or reveal that it is an artifact.
- The $[11\bar{1}]$ orientation of the superlattice may be dictated by the (100) facets of the cube; comparing cubes with different facet types or shapes could reveal how surface stress selects hydrogen ordering direction.
- The same ptychographic approach should be applicable to other hydrides; the paper's comparison with recent results in TiHx and NbHx suggests a general route to determining H site occupancy and ordering in metal hydrides.
Editorial analysis
A structured set of objections, weighed in public.
Referee Report
Summary. The manuscript reports the use of multislice electron ptychography to image hydrogen atoms in PdHx nanocubes. The authors claim direct observation of H atoms at octahedral interstitial sites, a one-dimensional hydrogen superlattice along the [11-1] direction with alternating H-occupied and vacant octahedral planes, an accompanying periodic strain modulation in the Pd lattice, and a 3D inhomogeneous hydrogen distribution with crescent-shaped H-rich regions near the surface and a hydrogen-depleted interior. The central evidence in 2D is supported by a forward simulation (Fig. S9), a pure-Pd negative control (Fig. S8), and the alternating occupancy pattern, which is argued to be difficult to reproduce as a probe-tail artifact. The 3D claim, however, relies on a shape interpolation/deformation method applied to 2D slice maps (Fig. S17), and the manuscript does not validate that this interpolation is faithful. The paper also reports quantitative results such as lattice expansion, strain amplitudes, and composition x = 0.4 without error bars or dose-series controls.
Significance. If the 2D H-imaging and 1D superlattice claims hold, this is a significant advance: it would be one of the first direct atomic-resolution images of H in a metal-hydride nanoparticle and would reveal an ordering motif not seen in bulk at room temperature. The manuscript's strengths include a forward simulation with a known structure (Fig. S9), a pure-Pd control (Fig. S8), and the internal consistency of the alternating H/vacancy pattern with the observed FFT superlattice peak. These elements make the central 'H atoms are visible' claim credible. The 3D inhomogeneity result is a headline novelty, but it is the least supported part of the paper: the interpolation step in Fig. S17 is a geometric smoothing assumption, not a measured reconstruction, and no validation or robustness tests are shown. Consequently, the paper's importance is real but conditional on strengthening the 3D analysis and adding quantitative uncertainty.
major comments (4)
- ["3D Inhomogeneity of Hydrogen Distribution" and Fig. S17] The crescent-shaped H distribution and interior depletion in Fig. 5 are not directly measured. Fig. S17 states that the 3D hydrogen distribution is reconstructed by applying a shape interpolation/deformation method to 2D H-region maps from 1-nm slices. The stated depth resolution is 2–3 nm, larger than the 1-nm slice spacing, so adjacent slices are not independent. The interpolation is geometric smoothing, not a physical or forward model, and no test is shown that the result is robust to interpolation parameters, slice thickness, or the wedge geometry. Because the 3D inhomogeneity is a central claim, this missing validation is load-bearing.
- [Quantitative claims, Figs. 2D and 4C–D] The paper reports specific quantitative values—x = 0.4, lattice expansion, periodicity 4.66 Å, and ±2% strain modulations—without error bars or statistical treatment. The contrast-adjustment threshold used to identify H atoms is not defined quantitatively, and no dose-series or repeat measurements from multiple particles are provided. This absence of uncertainty makes it difficult to distinguish genuine signal from noise or reconstruction artifacts, especially for the weak H signal and the small strain differences.
- [Beam sensitivity / H mobility] The experiments use total electron doses of 200,000–500,000 e-/Å2 (Figs. S10–S12). Hydrogen is mobile in Pd at room temperature, and electron-beam-induced desorption or rearrangement is a known concern for hydrides. The manuscript does not show a dose-series, repeated scans, or a stability test for the H superlattice and H clusters. Without such controls, the possibility that the observed ordering or inhomogeneity is beam-induced cannot be excluded, which affects both headline claims.
- [Fig. S17 and abstract wording] Fig. S17 explicitly says 'hydrogen is detected as regions of aggregation rather than as isolated atoms,' yet the abstract and main text claim 'directly image the 3D distribution of H atoms' and describe atomic positions. The 3D map in Fig. 5 is a smoothed representation of aggregated H regions, not an atomic-resolution 3D reconstruction. This overclaim should be corrected and the resolution/meaning of the 3D map clarified.
minor comments (4)
- [Figure captions] Captions in Figs. S10–S12 incorrectly repeat 'along [100]' in part (A) for the [110] and [11-0] datasets. Fig. S13 caption says both orientations show the 1D superlattice, while the text and Fig. S14 state [110] does not. These inconsistencies should be fixed.
- [Notation] The notation for [11-1] appears as '11�1' or '1𝟏�0' in several places, likely due to font/encoding issues. Use standard \([11\bar1]\) notation consistently.
- [Methods] The main text has no Methods section. Reconstruction parameters, detector settings, simulation details, and the interpolation procedure are only given in figure captions. A consolidated Methods section would help reproducibility.
- [Fig. S15–S18] The slice maps would benefit from scale bars, explicit slice indices, and a quantitative threshold for hydrogen detection. As presented, the H clusters are outlined manually, which is hard to reproduce.
Circularity Check
The 3D hydrogen 'crescent' inhomogeneity is partly constructed by interpolating 2D H-region maps (Fig. S17), so a central 3D claim reduces to the smoothness assumption; the 1D superlattice and per-slice H imaging remain independent.
-
fitted input called prediction
[Supplementary Figure S17; main-text '3D Inhomogeneity of Hydrogen Distribution in PdHx nanocubes' (Fig. 5A, C)]
"Using the 2D distributions from slices at depths ranging from 2 nm to 16 nm, a 3D hydrogen distribution within the Pd lattice is reconstructed by applying a shape interpolation/deformation method to produce a smooth, continuous 3D representation. These aggregated H regions exhibit a gradual deformation and shift between adjacent slices along the Z axis."
The paper's headline 3D finding—a crescent-shaped H distribution accumulating near surfaces with a depleted interior (Fig. 5A,C)—is not directly recovered from the ptychographic data. It is generated by a shape interpolation/deformation step whose input is the 2D H-region maps and whose explicit output is a smooth, continuous 3D volume with gradual lateral shifts of H aggregates. The main text then reports this rendered volume as an observation ('slice-by-slice analysis reveals ... forming a crescent-shaped 3D distribution'). Since the smooth continuity and gradual deformation are imposed by the interpolation model, the specific 3D organization is built into the reconstruction by construction, not measured. The paper itself states that H is detected as regions of aggregation, not isolated
full rationale
The ptychographic inversion itself is self-contained: the 1D hydrogen superlattice, per-slice H positions, and strain modulations come from solving an inverse scattering problem on measured 4D datasets, with simulations of a known PdHx structure (Fig. S9) and control comparisons to Pd and iDPC (Figs. S6–S8) providing independent support. Those results are not circular. The circularity burden is concentrated in the 3D rendering step behind the '3D inhomogeneity' claim. Figure S17 states that the 3D hydrogen distribution is obtained by applying a shape interpolation/deformation method to 2D H-region maps, producing a smooth, continuous representation. The crescent shape, near-surface enrichment, and interior depletion highlighted in Figure 5 are therefore partly outputs of that interpolation assumption rather than direct measurements; the per-slice 2D aggregation does show real heterogeneity, but the specific 3D organization is imposed by the smoothness/continuity model. This affects a central novelty of the paper (3D hydrogen inhomogeneities), so the score is elevated to 6. There is no load-bearing self-citation chain: prior method citations (e.g., refs. 34, 45) are backed by the present simulations and comparisons, and the self-cited conference abstract (ref. 35) is not the evidence for the claims.
Assumptions & free parameters
free parameters (2)
- contrast adjustment thresholds =
not quantified
- ptychographic reconstruction settings =
not stated
assumptions (3)
- domain assumption Hydrogen occupies octahedral interstitial sites in PdHx
- domain assumption The multislice forward model accurately describes electron multiple scattering
- ad hoc to paper The shape interpolation/deformation method yields a faithful 3D reconstruction of H distribution
Cite this review
Pith. "Pith review of Electron Ptychography Images Hydrogen Atom Superlattices and 3D Inhomogeneities in Palladium Hydride Nanoparticles." pith.science (2026). https://pith.science/paper/IVAI5FEC
@misc{pith2026250811142,
  author       = {Pith},
  title        = {Pith review of: Electron Ptychography Images Hydrogen Atom Superlattices and 3D Inhomogeneities in Palladium Hydride Nanoparticles},
  year         = {2026},
  howpublished = {\url{https://pith.science/paper/IVAI5FEC}},
  note         = {Machine review of arXiv:2508.11142}
}
read the original abstract
When hydrogen atoms occupy interstitial sites in metal lattices, they form metal hydrides (MHx), whose structural and electronic properties can differ significantly from the host metals. Owing to the small size of hydrogen atom and its unique interactions with the host metal, MHx is of broad interest in both fundamental science and technological applications. Determining where the hydrogen is located within the MHx, and whether it orders on the partially occupied interstitial sites is crucial for predicting and understanding the resultant physical and electronic properties of the hydride. Directly imaging hydrogen within a host material remains a major challenge due to its weak interaction with X-rays and electrons in conventional imaging techniques. Here, we employ electron ptychography, a scanning transmission electron microscopy technique, to image the three-dimensional (3D) distribution of H atoms in Palladium hydrides (PdHx) nanocubes, one of the most studied and industrially relevant MHx materials. We observe an unexpected one-dimensional superlattice ordering of hydrogen within the PdHx nanocubes and 3D hydrogen clustering in localized regions within PdHx nanocubes, revealing spatial heterogeneity in metal hydride nanoparticles previously inaccessible by other methods.
Figures
Reference graph
Works this paper leans on
-
[2]
Solid State Communications 1980, 34 (2), 133–135
and (1 1/2 0) Reflection in PdD 0.73 near 50 K. Solid State Communications 1980, 34 (2), 133–135. https://doi.org/10.1016/0038-1098(80)91250-8. (41) Kusada, K.; Yamauchi, M.; Kobayashi, H.; Kitagawa, H.; Kubota, Y. Hydrogen- Storage Properties of Solid -Solution Alloys of Immiscible Neighboring Elements with Pd. J. Am. Chem. Soc. 2010, 132 (45), 15896–158...
-
[4]
The regions highlighted by yellow boxes are shown in detail in (C–F)
orientations, respectively. The regions highlighted by yellow boxes are shown in detail in (C–F). (C–D) Comparison of HAADF and ptychography images across a thickness gradient from 2 nm (left) to 12 nm (right), demonstrating that ptychography achieves superior lateral resolution, particularly in thicker regions. (E–F) The same images as (C–D), with adjust...
work page 2014
-
[110]
directions, demonstrating their high crystallinity and well -ordered atomic arrangement, similar as Pd nanocubes. Figure. S6. Atomic-resolution STEM-HAADF images of PdHx nanocubes (A–B) Atomic-resolution STEM HAADF images of a PdHx nanocube viewed along the [100] and
-
[1148]
Atomic evolution of hydrogen intercalation wave dynamics in palladium nanocrystals
https://doi.org/10.1038/nmat4086. (19) Lee, D.; Oaks-Leaf, S.; Betzler, S. B.; Shi, Y.; Zhou, S.; Ophus, C.; Wang, L.-W.; Asta, M.; Xia, Y.; Limmer, D. T.; Zheng, H. Atomic Evolution of Hydrogen Intercalation Wave Dynamics in Palladium Nanocrystals. arXiv November 15, 2024. https://doi.org/10.48550/arXiv.2404.02416. (20) Gao, W.; Elnabawy, A. O.; Hood, Z....
work page Pith review arXiv doi:10.48550/arxiv.2404.02416 2024
Reviewed August 5, 2026 · model on record in the stance chip above.
Discussion (0). Sign in to comment.