REVIEW 4 major objections 6 minor 84 references
Stringent Upper Bounds on Atmospheric Mass Loss from Three Neptune-Sized Planets in the TOI-4010 System
T0 review · 4 major / 6 minor · reviewed 2026-08-05 · deepseek-v4-flash
Pith's one-line read For all three planets in the TOI-4010 system, nondetections of metastable helium set mass-loss upper limits that contradict solar-composition photoevaporation model predictions.
desk verdict First three-planet He* limits for Neptune-sized worlds, with a clean non-detection story that may be less clean than advertised because the model predictions assume one XUV spectral shape. read the letter →
The pith
A machine-rendered reading of the paper's core claim, the machinery that carries it, and where it could break.
The reading
What carries the argument
The central probe is the metastable helium (He*) line at 1.0833 micrometers: a transit-depth excess there signals gas escaping the planet's Hill sphere. To turn a non-detection into a physical bound, the paper uses an isothermal Parker wind model (p-winds) that maps outflow temperature and mass loss rate onto a synthetic helium transit spectrum, then MCMC-retrieves allowed regions in that two-parameter space. For the comparison that creates the tension, the paper uses pyTPCI, a 1D self-consistent radiative-hydrodynamic outflow code, to predict the He* signal and mass-loss rate for solar-composition atmospheres; it then tests how those predictions change under reduced XUV flux, higher metalli
What would settle it
Measure TOI-4010's actual X-ray and EUV output with a dedicated observation. If the true spectrum's EUV-to-X-ray ratio differs enough from HD 85512's, the predicted metastable helium signals for b and c can drop below the 0.81–1.23% upper limits even at the same total XUV luminosity, removing the claimed inconsistency without needing high metallicity or fractionation.
Extended reading notes
Core claim
TOI-4010 b, c, and d were all observed in full transit at 1.0833 μm, the metastable helium triplet that traces escaping gas, and none shows excess absorption above 1.23%, 0.81%, and 0.87% respectively (95% confidence). Interpreting the non-detections with isothermal Parker wind models gives mass-loss upper limits of 10^10.17, 10^10.53, and 10^10.50 g/s. Against these, pyTPCI radiative-hydrodynamic models of solar-composition outflows predict rates of 10^11.15 and 10^10.98 g/s for b and c—about ten times higher—plus detectable helium signals for all three planets. The paper argues that this discrepancy is real: lowering the adopted stellar XUV flux by factors up to 15, or invoking stellar win
Load-bearing premise
The tension rests on borrowing the K star HD 85512's measured X-ray/extreme-UV spectrum as a stand-in for TOI-4010's unmeasured high-energy spectrum; the paper reduces that spectrum's total brightness but never changes its shape, and the helium signal depends on the shape.
Editorial extensions
If this is right
- At the 95% upper limits, all three planets have atmospheric lifetimes >110 Gyr, so ongoing photoevaporation will not strip their envelopes over the host star's main-sequence lifetime.
- TOI-4010 b's current H/He envelope cannot be reconciled with solar-composition evaporation histories: such models strip any starting envelope within ~500 Myr, so some long-lived suppression mechanism must operate.
- The envelope-mass-fraction gradient between TOI-4010 c and d is likely primordial rather than carved by escape, since both lost little of their envelopes in the backward-evolution models.
- The non-detections can be reproduced either by high atmospheric metallicity (~100× solar for b, extrapolated ~200× for c and d) or by helium fractionation and molecular cooling, with the two possibly acting together.
- Spectroscopic observations planned for this system should be able to measure the planets' atmospheric metallicities and distinguish between a high-metallicity and a fractionation explanation.
Reading between the lines
- If fractionation is as strong as the AIOLOS runs suggest, helium-poor outflows should be common around K-dwarf multi-planet systems, and helium non-detections should correlate with orbital distance and stellar type—a population-level pattern the paper flags as open rather than established.
- A direct measurement of TOI-4010's XUV spectrum is the cleanest test of the claimed tension: the paper scales the proxy spectrum's total flux but never varies its spectral shape, and the metastable helium population is sensitive to the EUV-to-X-ray ratio.
- If the planetary atmospheres are actually metal-rich, the inferred mass-loss upper limits may be biased low even while the helium signal stays weak, so the quoted bounds and the contradiction with solar-composition models both deserve qualification.
- The results weaken the case that the lower boundary of the Neptune desert is being sculpted by present-day photoevaporation in this type of system, nudging the mechanism to earlier epochs or to processes other than ongoing hydrodynamic escape.
Editorial analysis
A structured set of objections, weighed in public.
Referee Report
Summary. This paper reports Keck/NIRSPEC metastable helium (He*) transit observations of the three Neptune-sized planets in the TOI-4010 system (b, c, d). No excess absorption is detected, giving 95% confidence upper limits of 1.23%, 0.81%, and 0.87% on the He* transit depth, and p-winds Parker-wind retrievals convert these into 95th-percentile mass-loss upper limits of 10^10.17, 10^10.53, and 10^10.50 g/s. The authors compare these limits with pyTPCI 1D hydrodynamic solar-composition predictions and claim that the non-detections for planets b and c are inconsistent with such models; they then explore reduced XUV luminosity, stellar winds, magnetic fields, enhanced metallicity, and H/He fractionation as possible explanations. Using photoevolver simulations they also reconstruct past evaporation histories, concluding that c and d have lost little envelope while b should have been stripped within ~500 Myr unless outflow suppression persists.
Significance. If the claimed inconsistency is correct, this is an important multi-planet test of photoevaporation models: three similar planets in the same system with the same irradiation history are predicted to show detectable He* but do not, suggesting that standard solar-composition 1D models overpredict observable escape. The data are of good quality, the upper limits are carefully derived, and the paper compares several independent modeling frameworks (p-winds, pyTPCI, AIOLOS, photoevolver). The main caveat is that the predicted signals depend on an assumed stellar XUV spectral energy distribution; the robustness tests vary only the total XUV normalization, not the spectral shape that controls the He* population. This limits the strength of the central claim as currently stated.
major comments (4)
- [§5.1, §4.2] The robustness tests reduce the HD 85512 XUV flux by factors of 5, 10, and 15, but they never vary the spectral energy distribution. The metastable helium population is controlled by the balance between EUV photons that ionize He I and harder X-ray photons that heat and ionize H; a different SED shape with the same integrated XUV can suppress the predicted He* signal by a factor of several without changing the mass-loss rate. Thus the central claim that the non-detections are inconsistent with solar-composition 1D models is not established; it is specifically an inconsistency with models driven by an HD 85512-shaped SED. The authors should repeat the pyTPCI/p-winds predictions with alternative SEDs (e.g., other MUSCLES K-star spectra or a parameterized EUV-to-X-ray ratio) and re-evaluate the tension. The current §5.1 scaling tests do not address this possibility.
- [§2, §3, §4.2] For TOI-4010 c and d, the OH telluric line contaminates the red wing of the He* feature (1.08332–1.08339 μm), and the upper limits are computed from the blue wing only. The pyTPCI model spectra in Figure 3 are shown over the full line profile, including the masked region. If a substantial fraction of the predicted line depth is in the red wing, the comparison in §4.2 overstates the discrepancy. The authors should either compute the model predictions over exactly the same wavelength mask as the observations or quantify the fraction of the predicted line depth that falls in the masked window.
- [§5.4] The AIOLOS fractionation models produce very strong suppression: reduction factors of 10^-2 for c and 10^-6 for d, and complete outflow shutdown for d due to molecular cooling. These results are used to argue that fractionation can explain all three non-detections. However, the setup (lower boundary at 10 mbar, helium injection at 1 nbar homopause, Malygin et al. 2014 molecular cooling tables) is introduced here without a sensitivity study or validation against published fractionation models. Given that this is a key alternative explanation, the authors should at least test the dependence on the assumed homopause pressure and cooling treatment, or clearly state these as strong assumptions.
- [§5.5] The text says the predicted present-day XUV flux of (3.0 ± 1.0) × 10^28 erg/s 'agrees with' the HD 85512 value of 1.2 × 10^28 erg/s. These values differ by approximately 1.8σ (1.2 is outside the 1σ range of 2.0–4.0 × 10^28), so the agreement is not good. This statement should be corrected or rephrased, as it directly bears on the validity of the adopted stellar proxy.
minor comments (6)
- [§6] Typo: 'it’s envelope' should be 'its envelope'.
- [§4.1] Typo: 'HD 88512' should be 'HD 85512'.
- [Abstract / Introduction] The sentence 'However, the stellar high energy fluxes...' is slightly wordy; consider tightening. Also the intro contains a stray 'Ex-arXiv' fragment in the first paragraph.
- [§5.5] The phrase 'still within 1 σ' for the TOI-4010 c predicted mass-loss rate is ambiguous; specify that it is within 1σ of the predicted rate's uncertainty, since the central predicted value exceeds the 95% upper limit.
- [Figure 3] The model-prediction lines (blue, purple, pink, orange) are only identified in the caption, not in a figure legend. Adding a legend would improve readability.
- [Data availability] The paper does not include a data availability statement. The reduced transmission spectra and posterior samples should be made available, at minimum via a repository link.
Circularity Check
No significant circularity: the forward-model predictions are independent of the non-detection data, and co-author code citations are real, non-load-bearing support.
full rationale
The derivation chain is not circular. The observed non-detections are converted into mass-loss upper limits using p-winds (§4.1), a forward Parker-wind retrieval in which Mdot and T0 are fitted to the data. The 'expectations' that the paper claims are contradicted come from pyTPCI (§4.2), a separate one-dimensional radiative-hydrodynamics code that is run from stated planetary parameters (mass, radius, semi-major axis), solar abundances, and the adopted HD 85512 stellar spectrum; its predicted Mdot and He* signals are not functions of the p-winds posterior, so they are genuinely independent predictions rather than fitted inputs renamed as predictions. The same is true of the AIOLOS fractionation runs (§5.4) and the photoevolver/Kubyshkina past-evaporation histories (§5.5), which use separate published models and stellar evolution tracks. The paper's main caveat is that TOI-4010 lacks a measured high-energy spectrum and HD 85512 is used as a proxy (§4.1); the robustness tests in §5.1 vary only the XUV normalization, not the spectral energy distribution, so a different SED shape could change the He* population and weaken the claimed inconsistency. That is a substantive astrophysical uncertainty and a limitation, but it is not circularity: the prediction is not defined in terms of the non-detection, and the model-data comparison remains a genuine consistency test conditional on the assumed SED. The self-citations to co-author codes (pyTPCI/Rosener et al. 2025, AIOLOS/Schulik & Booth 2023, photoevolver/Fernández Fernández et al. 2023, and the methodology in Zhang et al. 2022b, 2025) are to published, externally checkable simulations whose assumptions do not include the target non-detections, and no uniqueness theorem is invoked to forbid alternative explanations. The paper in fact explores metallicity, magnetic fields, winds, and fractionation as independent alternatives. Therefore no circular step can be exhibited, and the appropriate finding is no significant circularity.
Assumptions & free parameters
free parameters (5)
- log10 mass loss rate (p-winds retrieval) =
upper limits: 10.17, 10.53, 10.50 (log10 g/s) for b, c, d; marginalized posterior
- isothermal outflow temperature T0 (p-winds retrieval) =
not reported as best fit; prior U(3900,15000) K
- XUV scaling factor for robustness tests =
1 (nominal), 0.2, 0.1, 0.0667 (reductions by 5, 10, 15)
- atmospheric metallicity Z in pyTPCI models =
1, 10, 30, 100, 200 times solar
- initial envelope mass fraction for TOI-4010 b =
1%, 2%, 5%
assumptions (8)
- domain assumption HD 85512 MUSCLES spectrum is a valid proxy for TOI-4010's high-energy (XUV) spectrum
- domain assumption Outflow is solar composition (90% H, 10% He by number) for the retrieval and baseline forward models
- domain assumption A 1D isothermal Parker wind model (p-winds) adequately maps He* absorption to mass loss rate and temperature
- domain assumption pyTPCI lower boundary condition of particle density 10^14 cm^-3 at the planet's radius and inclusion of atomic species with solar abundance > 1e-5 (no molecules)
- ad hoc to paper AIOLOS fractionation setup: lower boundary at 10 mbar, helium injected at 1 nbar homopause pressure, molecular cooling from Malygin et al. (2014) tables
- domain assumption Planetary parameters (masses, radii, ages, orbital distances) from Kunimoto et al. (2023) are accurate
- domain assumption The current upper limit on Mdot can be used as a constant rate to estimate atmospheric lifetimes (Mp/Mdot > 110 Gyr)
- domain assumption For past evaporation, the spin evolution models of Johnstone et al. (2021) and the mass loss model of Kubyshkina et al. (2018) describe the star's XUV history and escape physics
Cite this review
Pith. "Pith review of Stringent Upper Bounds on Atmospheric Mass Loss from Three Neptune-Sized Planets in the TOI-4010 System." pith.science (2026). https://pith.science/paper/RO74YKTO
@misc{pith2026250821166,
  author       = {Pith},
  title        = {Pith review of: Stringent Upper Bounds on Atmospheric Mass Loss from Three Neptune-Sized Planets in the TOI-4010 System},
  year         = {2026},
  howpublished = {\url{https://pith.science/paper/RO74YKTO}},
  note         = {Machine review of arXiv:2508.21166}
}
abstract
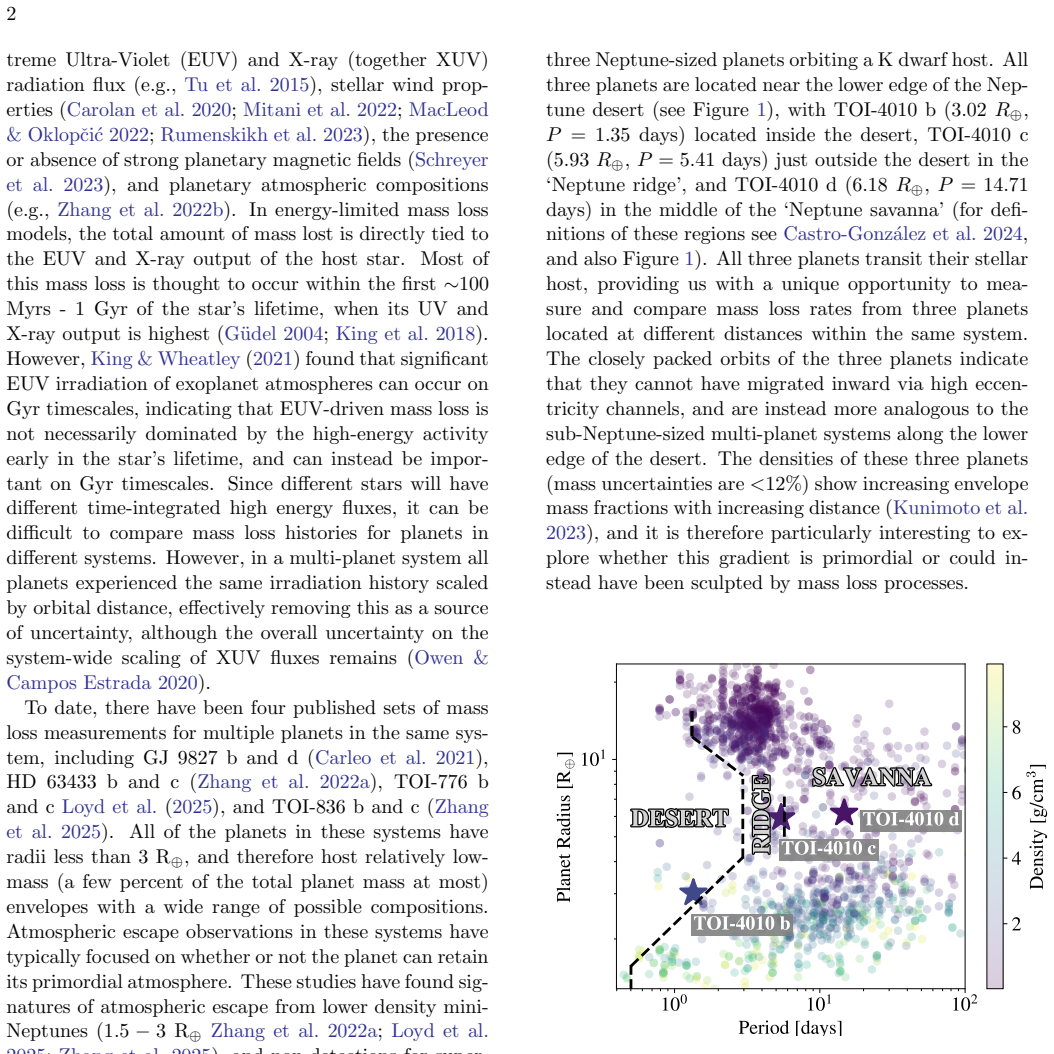
Photoevaporative models predict that the lower edge of the Neptune desert is sculpted by atmospheric mass loss. However, the stellar high energy fluxes that power hydrodynamic escape and set predicted mass loss rates can be uncertain by multiple orders of magnitude. These uncertainties can be bypassed by studying mass loss for planets within the same system, as they have effectively undergone scaled versions of the same irradiation history. The TOI-4010 system is an ideal test case for mass loss models, as it contains three Neptune-sized planets with planet b located in the `Neptune desert', planet c in the `Neptune ridge', and planet d in the `Neptune savanna'. Using Keck/NIRSPEC, we measured the metastable helium transit depths of all three planets in order to search for evidence of atmospheric escape. We place upper bounds on the excess helium absorption of 1.23\%, 0.81\%, and 0.87\% at 95\% confidence for TOI-4010~b, c and d respectively. We fit our transmission spectra with Parker wind models and find that this corresponds to 95th-percentile upper limits of $10^{10.17}$g~s$^{-1}$, $10^{10.53}$g~s$^{-1}$, and $10^{10.50}$g~s$^{-1}$ on the mass loss rates of TOI-4010~b, c, and d respectively. Our non-detections are inconsistent with expectations from one-dimensional hydrodynamic models for solar composition atmospheres. We consider potential reductions in signal from a decreased host star XUV luminosity, planetary magnetic fields, enhanced atmospheric metallicities, and fractionation, and explore the implications of our measurements for the past evaporation histories of all three planets.
Figures


Figures from the paper (5 more)


Reference graph
Works this paper leans on
-
[1]
Akeson, R. L., Chen, X., & et al. 2013, Publications of the Astronomical Society of the Pacific, 125, 989, doi: 10.1086/672273
doi:10.1086/672273 2013
-
[2]
Aschwanden, M. J. 2014, in Encyclopedia of the Solar System (Third Edition), third edition edn., ed. T. Spohn, D. Breuer, & T. V. Johnson (Boston: Elsevier), 235–259, doi: https://doi.org/10.1016/B978-0-12-415845-0.00011-6 Astropy Collaboration, Price-Whelan, A. M., & et al. 2018, The Astronomical Journal, 156, 123, doi: 10.3847/1538-3881/aabc4f —. 2022, ...
-
[3]
K., Sandel, B
Atreya, S. K., Sandel, B. R., & Romani, P. N. 1991, in Uranus, ed. J. T. Bergstralh, E. D. Miner, & M. S. Matthews, 110–146
1991
-
[4]
2013, in Planets, Stars and Stellar Systems
Bagenal, F. 2013, in Planets, Stars and Stellar Systems. Volume 3: Solar and Stellar Planetary Systems, ed. T. D
2013
-
[5]
Oswalt, L. M. French, & P. Kalas, 251, doi: 10.1007/978-94-007-5606-9 6
-
[6]
2018, The Astrophysical Journal, 866, L2, doi: 10.3847/2041-8213/aade90
Bailey, E., & Batygin, K. 2018, The Astrophysical Journal, 866, L2, doi: 10.3847/2041-8213/aade90
-
[7]
Batygin, K., Bodenheimer, P. H., & Laughlin, G. P. 2016, The Astrophysical Journal, 829, 114, doi: 10.3847/0004-637X/829/2/114 Beaug´ e, C., & Nesvorn´ y, D. 2013, The Astrophysical Journal, 763, 12, doi: 10.1088/0004-637X/763/1/12 14
-
[8]
2021, The Astronomical Journal, 161, 136, doi: 10.3847/1538-3881/abdb2f
Carleo, I., Youngblood, A., Redfield, S., & et al. 2021, The Astronomical Journal, 161, 136, doi: 10.3847/1538-3881/abdb2f
Show all 84 references
-
[9]
A., Plavchan, P., Villarreal D’Angelo, C., & Hazra, G
Carolan, S., Vidotto, A. A., Plavchan, P., Villarreal D’Angelo, C., & Hazra, G. 2020, Monthly Notices of the Royal Astronomical Society, 498, L53, doi: 10.1093/mnrasl/slaa127
2020 doi
-
[10]
Carolan, S. e. a. 2021, MNRAS, 500, 3382, doi: 10.1093/mnras/staa3431 Castro-Gonz´ alez, A., Bourrier, V., & et al. 2024, Astronomy and Astrophysics, 689, A250, doi: 10.1051/0004-6361/202450957
2021 doi
-
[11]
C., & Kasting, J
Catling, D. C., & Kasting, J. F. 2017, Atmospheric Evolution on Inhabited and Lifeless Worlds
2017
-
[12]
Chen, H., & Rogers, L. A. 2016, ApJ, 831, 180, doi: 10.3847/0004-637X/831/2/180
2016 doi
- [13]
-
[14]
2016, ApJ, 820, 3, doi: 10.3847/0004-637X/820/1/3
Christie, D., Arras, P., & Li, Z.-Y. 2016, ApJ, 820, 3, doi: 10.3847/0004-637X/820/1/3
2016 doi
-
[15]
C., Watson, C
Costes, J. C., Watson, C. A., de Mooij, E., & et al. 2021, Monthly Notices of the Royal Astronomical Society, 505, 830, doi: 10.1093/mnras/stab1183
2021 doi
-
[16]
Crossfield, I. J. M., Dragomir, D., & et al. 2020, ApJ, 903, L7, doi: 10.3847/2041-8213/abbc71 Dos Santos, L. A. 2023, in , Vol. 370, Winds of Stars and Exoplanets, ed. A. A. Vidotto, L. Fossati, & J. S. Vink, 56–71, doi: 10.1017/S1743921322004239 Dos Santos, L. A., Vidotto, A...
2020 doi
-
[17]
Dragomir, D., Crossfield, I. J. M., & et al. 2020, ApJ, 903, L6, doi: 10.3847/2041-8213/abbc70 Fern´ andez Fern´ andez, J., Wheatley, P. J., & King, G. W. 2023, MNRAS, 522, 4251, doi: 10.1093/mnras/stad1257 Fern´ andez Fern´ andez, J., Wheatley, P. J., King, G. W., &
2020 doi
-
[18]
Jenkins, J. S. 2024, Monthly Notices of the Royal Astronomical Society, 527, 911, doi: 10.1093/mnras/stad3263
2024 doi
-
[19]
W., Lang, D., & Goodman, J
Foreman-Mackey, D., Hogg, D. W., Lang, D., & Goodman, J. 2013, Publications of the Astronomical Society of the Pacific, 125, 306, doi: 10.1086/670067 G¨ udel, M. 2004, A&A Review, 12, 71, doi: 10.1007/s00159-004-0023-2
2013 doi
-
[20]
2023, Astronomy and Astrophysics, 676, A130, doi: 10.1051/0004-6361/202346419
Guilluy, G., Bourrier, V., & et al. 2023, Astronomy and Astrophysics, 676, A130, doi: 10.1051/0004-6361/202346419
2023 doi
-
[21]
R., Millman, K
Harris, C. R., Millman, K. J., & et al. 2020, Nature, 585, 357, doi: 10.1038/s41586-020-2649-2
2020 doi
-
[22]
M., Pepin, R
Hunten, D. M., Pepin, R. O., & Walker, J. C. G. 1987, Icarus, 69, 532, doi: 10.1016/0019-1035(87)90022-4
1987 doi
-
[23]
Hunter, J. D. 2007, Computing in Science and Engineering, 9, 90, doi: 10.1109/MCSE.2007.55
2007 doi
-
[24]
O., Wende-von Berg, S., & et al
Husser, T. O., Wende-von Berg, S., & et al. 2013, Astronomy and Astrophysics, 553, A6, doi: 10.1051/0004-6361/201219058
2013 doi
-
[25]
Ida, S., & Lin, D. N. C. 2008, The Astrophysical Journal, 673, 487, doi: 10.1086/523754
2008 doi
-
[26]
E., Pavlyuchenkov, Y
Ionov, D. E., Pavlyuchenkov, Y. N., & Shematovich, V. I. 2018, Monthly Notices of the Royal Astronomical Society, 476, 5639, doi: 10.1093/mnras/sty626
2018 doi
-
[27]
P., Bartel, M., & G¨ udel, M
Johnstone, C. P., Bartel, M., & G¨ udel, M. 2021, Astronomy and Astrophysics, 649, A96, doi: 10.1051/0004-6361/202038407
2021 doi
-
[28]
P., G¨ udel, M., Brott, I., & L¨ uftinger, T
Johnstone, C. P., G¨ udel, M., Brott, I., & L¨ uftinger, T. 2015, A&A, 577, A28, doi: 10.1051/0004-6361/201425301
2015 doi
-
[29]
W., & Wheatley, P
King, G. W., & Wheatley, P. J. 2021, Monthly Notices of the Royal Astronomical Society, 501, L28, doi: 10.1093/mnrasl/slaa186
2021 doi
-
[30]
W., Wheatley, P
King, G. W., Wheatley, P. J., Salz, M., et al. 2018, MNRAS, 478, 1193, doi: 10.1093/mnras/sty1110
2018 doi
-
[31]
V., et al
Kubyshkina, D., Fossati, L., Erkaev, N. V., et al. 2018, A&A, 619, A151, doi: 10.1051/0004-6361/201833737
2018 doi
-
[32]
2019, The Journal of Open Source Software, 4, 1143, doi: 10.21105/joss.01143
Kumar, R., Carroll, C., Hartikainen, A., & Martin, O. 2019, The Journal of Open Source Software, 4, 1143, doi: 10.21105/joss.01143
2019 doi
-
[33]
2023, The Astronomical Journal, 166, 7, doi: 10.3847/1538-3881/acd537
Kunimoto, M., Vanderburg, A., & et al. 2023, The Astronomical Journal, 166, 7, doi: 10.3847/1538-3881/acd537
2023 doi
-
[34]
A., Mamajek, E
Laliotis, K., Burt, J. A., Mamajek, E. E., & et al. 2023, The Astronomical Journal, 165, 176, doi: 10.3847/1538-3881/acc067
2023 doi
-
[35]
F., Chassefi` ere, E., et al
Lammer, H., Kasting, J. F., Chassefi` ere, E., et al. 2008, SSRv, 139, 399, doi: 10.1007/s11214-008-9413-5 Lamp´ on, M., L´ opez-Puertas, M., Czesla, S., et al. 2021, A&A, 648, L7, doi: 10.1051/0004-6361/202140423
2008 doi
-
[36]
2024, Astronomy and Astrophysics, 688, A43, doi: 10.1051/0004-6361/202450240
Linssen, D., Shih, J., MacLeod, M., & Oklopˇ ci´ c, A. 2024, Astronomy and Astrophysics, 688, A43, doi: 10.1051/0004-6361/202450240
2024 doi
-
[37]
C., Oklopˇ ci´ c, A., & MacLeod, M
Linssen, D. C., Oklopˇ ci´ c, A., & MacLeod, M. 2022, Astronomy and Astrophysics, 667, A54, doi: 10.1051/0004-6361/202243830
2022 doi
-
[38]
D., & Fortney, J
Lopez, E. D., & Fortney, J. J. 2013, The Astrophysical Journal, 776, 2, doi: 10.1088/0004-637X/776/1/2
2013 doi
- [39]
-
[40]
Loyd, R. O. P., Schreyer, E., Owen, J. E., & et al. 2025, Nature, 638, 636, doi: 10.1038/s41586-024-08490-x 15
2025 doi
-
[41]
S., Kjeldsen, H., & et al
Lundkvist, M. S., Kjeldsen, H., & et al. 2016, Nature Communications, 7, 11201, doi: 10.1038/ncomms11201
2016 doi
-
[42]
2022, The Astrophysical Journal, 926, 226, doi: 10.3847/1538-4357/ac46ce
MacLeod, M., & Oklopˇ ci´ c, A. 2022, The Astrophysical Journal, 926, 226, doi: 10.3847/1538-4357/ac46ce
2022 doi
-
[43]
Malsky, I., Rogers, L., Kempton, E. M. R., & Marounina, N. 2023, Nature Astronomy, 7, 57, doi: 10.1038/s41550-022-01823-8
2023 doi
-
[44]
2014, A&A, 568, A91, doi: 10.1051/0004-6361/201423768
Henning, T. 2014, A&A, 568, A91, doi: 10.1051/0004-6361/201423768
2014 doi
-
[45]
2022, Monthly Notices of the Royal Astronomical Society, 512, 855, doi: 10.1093/mnras/stac556
Mitani, H., Nakatani, R., & Yoshida, N. 2022, Monthly Notices of the Royal Astronomical Society, 512, 855, doi: 10.1093/mnras/stac556
2022 doi
-
[46]
A., Chiang, E
Murray-Clay, R. A., Chiang, E. I., & Murray, N. 2009, ApJ, 693, 23, doi: 10.1088/0004-637X/693/1/23
2009 doi
-
[47]
2022, ApJ, 937, 72, doi: 10.3847/1538-4357/ac86ca NASA Exoplanet Archive
Nakayama, A., Ikoma, M., & Terada, N. 2022, ApJ, 937, 72, doi: 10.3847/1538-4357/ac86ca NASA Exoplanet Archive. 2024, Planetary Systems, Version: 2024-01-23 12:42, NExScI-Caltech/IPAC, doi: 10.26133/NEA12 Oklopˇ ci´ c, A., & Hirata, C. M. 2018, The Astrophysical Journal, 855, ...
2022 doi
- [48]
-
[49]
F., Bouchy, F., & Helled, R
Otegi, J. F., Bouchy, F., & Helled, R. 2019, A&A, 634, A43, doi: 10.1051/0004-6361/201936482
2019 doi
-
[50]
Owen, J. E. 2019, Annual Review of Earth and Planetary Sciences, 47, 67, doi: 10.1146/annurev-earth-053018-060246
2019 doi
-
[51]
E., & Adams, F
Owen, J. E., & Adams, F. C. 2014, MNRAS, 444, 3761, doi: 10.1093/mnras/stu1684
2014 doi
-
[52]
E., & Alvarez, M
Owen, J. E., & Alvarez, M. A. 2016, ApJ, 816, 34, doi: 10.3847/0004-637X/816/1/34
2016 doi
-
[53]
E., & Campos Estrada, B
Owen, J. E., & Campos Estrada, B. 2020, MNRAS, 491, 5287, doi: 10.1093/mnras/stz3435
2020 doi
-
[54]
E., & Lai, D
Owen, J. E., & Lai, D. 2018, Monthly Notices of the Royal Astronomical Society, 479, 5012, doi: 10.1093/mnras/sty1760
2018 doi
- [55]
-
[56]
2011, Astronomy and Astrophysics, 534, A58, doi: 10.1051/0004-6361/201117055
Pepe, F., Lovis, C., S´ egransan, D., & et al. 2011, Astronomy and Astrophysics, 534, A58, doi: 10.1051/0004-6361/201117055
2011 doi
-
[57]
2003, A&A, 397, 147, doi: 10.1051/0004-6361:20021560
Ventura, P. 2003, A&A, 397, 147, doi: 10.1051/0004-6361:20021560
2003 doi
-
[58]
G., Owen, J
Rogers, J. G., Owen, J. E., & Schlichting, H. E. 2024, Monthly Notices of the Royal Astronomical Society, 529, 2716, doi: 10.1093/mnras/stae563
2024 doi
-
[59]
Rosener, R., Zhang, M., & Bean, J. L. 2025, The Astrophysical Journal, 980, 34, doi: 10.3847/1538-4357/ada6ab
2025 doi
-
[60]
S., Khodachenko, M
Rumenskikh, M. S., Khodachenko, M. L., & et al. 2023, Monthly Notices of the Royal Astronomical Society, 526, 4120, doi: 10.1093/mnras/stad2846
2023 doi
-
[61]
2025, The Astronomical Journal, 169, 104, doi: 10.3847/1538-3881/ada49f
Saidel, M., Vissapragada, S., Spake, J., & et al. 2025, The Astronomical Journal, 169, 104, doi: 10.3847/1538-3881/ada49f
2025 doi
-
[62]
C., & Schmitt, J
Salz, M., Czesla, S., Schneider, P. C., & Schmitt, J. H. M. M. 2016, Astronomy and Astrophysics, 586, A75, doi: 10.1051/0004-6361/201526109
2016 doi
- [63]
-
[64]
Schulik, M., & Booth, R. A. 2023, MNRAS, 523, 286, doi: 10.1093/mnras/stad1251
2023 doi
- [65]
-
[66]
2015, Astronomy and Astrophysics, 576, A77, doi: 10.1051/0004-6361/201423932
Smette, A., Sana, H., & et al. 2015, Astronomy and Astrophysics, 576, A77, doi: 10.1051/0004-6361/201423932
2015 doi
-
[67]
J., Sing, D
Spake, J. J., Sing, D. K., & et al. 2018, Nature, 557, 68, doi: 10.1038/s41586-018-0067-5 Szab´ o, G. M., & Kiss, L. L. 2011, The Astrophysical Journal, 727, L44, doi: 10.1088/2041-8205/727/2/L44
2018 doi
-
[68]
B., Arras, P., & Li, Z.-Y
Trammell, G. B., Arras, P., & Li, Z.-Y. 2011, ApJ, 728, 152, doi: 10.1088/0004-637X/728/2/152
2011 doi
-
[69]
P., G¨ udel, M., & Lammer, H
Tu, L., Johnstone, C. P., G¨ udel, M., & Lammer, H. 2015, Astronomy and Astrophysics, 577, L3, doi: 10.1051/0004-6361/201526146
2015 doi
-
[70]
A., & Cleary, A
Vidotto, A. A., & Cleary, A. 2020, MNRAS, 494, 2417, doi: 10.1093/mnras/staa852
2020 doi
-
[71]
2020, Nature Methods, 17, 261, doi: 10.1038/s41592-019-0686-2
Virtanen, P., Gommers, R., & et al. 2020, Nature Methods, 17, 261, doi: 10.1038/s41592-019-0686-2
2020 doi
-
[72]
A., & et al
Vissapragada, S., Knutson, H. A., & et al. 2022, The Astronomical Journal, 164, 234, doi: 10.3847/1538-3881/ac92f2
2022 doi
-
[73]
2024, The Astrophysical Journal, 962, L19, doi: 10.3847/2041-8213/ad23cf
Vissapragada, S., McCreery, P., & et al. 2024, The Astrophysical Journal, 962, L19, doi: 10.3847/2041-8213/ad23cf
2024 doi
-
[74]
2021, ApJ, 914, 99, doi: 10.3847/1538-4357/abf1ed
Wang, L., & Dai, F. 2021, ApJ, 914, 99, doi: 10.3847/1538-4357/abf1ed
2021 doi
-
[75]
J., Drake, J
Wright, N. J., Drake, J. J., Mamajek, E. E., & Henry, G. W. 2011, ApJ, 743, 48, doi: 10.1088/0004-637X/743/1/48
2011 doi
-
[76]
2020, Icarus, 345, 113740, doi: 10.1016/j.icarus.2020.113740 16
Yoshida, T., & Kuramoto, K. 2020, Icarus, 345, 113740, doi: 10.1016/j.icarus.2020.113740 16
2020
-
[77]
2022, ApJ, 934, 137, doi: 10.3847/1538-4357/ac7be7
Yoshida, T., Terada, N., Ikoma, M., & Kuramoto, K. 2022, ApJ, 934, 137, doi: 10.3847/1538-4357/ac7be7
2022 doi
-
[78]
2024, Progress in Earth and Planetary Science, 11, 59, doi: 10.1186/s40645-024-00666-3
Yoshida, T., Terada, N., & Kuramoto, K. 2024, Progress in Earth and Planetary Science, 11, 59, doi: 10.1186/s40645-024-00666-3
2024 doi
-
[79]
2017, The Astrophysical Journal, 843, 31, doi: 10.3847/1538-4357/aa76dd
Youngblood, A., France, K., & et al. 2017, The Astrophysical Journal, 843, 31, doi: 10.3847/1538-4357/aa76dd
2017 doi
-
[80]
J., Gacesa, M., & Catling, D
Zahnle, K. J., Gacesa, M., & Catling, D. C. 2019, GeoCoA, 244, 56, doi: 10.1016/j.gca.2018.09.017
2019 doi
-
[81]
J., & Kasting, J
Zahnle, K. J., & Kasting, J. F. 1986, Icarus, 68, 462, doi: 10.1016/0019-1035(86)90051-5
1986 doi
-
[82]
L., Wilson, D., & et al
Zhang, M., Bean, J. L., Wilson, D., & et al. 2025, The Astronomical Journal, 169, 204, doi: 10.3847/1538-3881/adb490
2025 doi
-
[83]
A., & et al
Zhang, M., Knutson, H. A., & et al. 2022a, The Astronomical Journal, 163, 68, doi: 10.3847/1538-3881/ac3f3b
-
[84]
A., Wang, L., Dai, F., & Barrag´ an, O
Zhang, M., Knutson, H. A., Wang, L., Dai, F., & Barrag´ an, O. 2022b, The Astronomical Journal, 163, 67, doi: 10.3847/1538-3881/ac3fa7
Reviewed August 5, 2026 · model on record in the stance chip above.
Discussion (0). Sign in to comment.