REVIEW 3 major objections 4 minor 54 references
Structured Basis Function Networks: Loss-Centric Multi-Hypothesis Ensembles with Controllable Diversity
T0 review · 3 major / 4 minor · reviewed 2026-08-05 · deepseek-v4-flash
Pith's one-line read Structured Basis Function Networks claim to unify multi-hypothesis prediction and ensemble learning by aggregating base predictors at the Bregman centroid of the task loss, with a tunable diversity parameter that controls the bias-variance-
desk verdict The method is a reasonable incremental extension, but the identical MNIST/CIFAR-10 numbers in Tables 7–10 make the empirical core unusable as printed. read the letter →
The pith
A machine-rendered reading of the paper's core claim, the machinery that carries it, and where it could break.
The reading
What carries the argument
The load-bearing object is the structured basis function network (s-BFN): a radial-basis feature map Phi(D_i; theta) = [phi(||D_i - C_k||/gamma_k)] over the vector of all base predictions, followed by a linear head alpha (and a temperature-scaled softmax in classification). This map is what the paper identifies with the Bregman centroid z_hat = argmin_z sum_j alpha_j B_phi(z_j, z); the feature centers are running statistics of base predictions, and alpha is fit by least squares or gradient descent. The diversity mechanism is the epsilon-modulated update delta_i^(j) = 1-epsilon for the best predictor and epsilon/(M-1) for the rest, which controls how winner-takes-all the training is and thus
What would settle it
On a regression problem with M known base predictors, compute the exact Bregman centroid for squared loss - the weighted arithmetic mean sum_j alpha_j f_j / sum_j alpha_j - and compare it with the s-BFN output Phi(D_i) alpha on a held-out set. If the two disagree on a material fraction of inputs (beyond optimization tolerance), the claim that s-BFN implements centroidal aggregation is falsified; likewise for cross-entropy, compare to the KL centroid of the base probability vectors.
Extended reading notes
Core claim
The paper's central claim is that a combiner built as a structured basis function network over base-prediction vectors coincides with the loss-induced Bregman centroid, so that the same framework covers regression and classification by choosing the matching divergence. For squared loss, the combiner is a linear readout of radial-basis features over the concatenated scalars; for cross-entropy, it is a temperature-scaled softmax over radial-basis features of the base models' probability vectors. The combiner weights admit a closed-form ridge solution in the Euclidean case and gradient-based training in general, and a diversity parameter epsilon modulates each base learner's update so that the
Load-bearing premise
The paper assumes that a radial-basis function whose centers are running statistics of base predictions can actually represent the loss-induced Bregman centroid, so that training the combiner with the task loss gives a truly loss-aware ensemble; if that representational assumption fails, the combiner still minimizes training loss but the centroidal interpretation is unsupported.
Editorial extensions
If this is right
- If the central claim holds, multi-hypothesis prediction and ensembling share one principled combination rule: the Bregman centroid of the loss, rather than ad hoc averaging or gating.
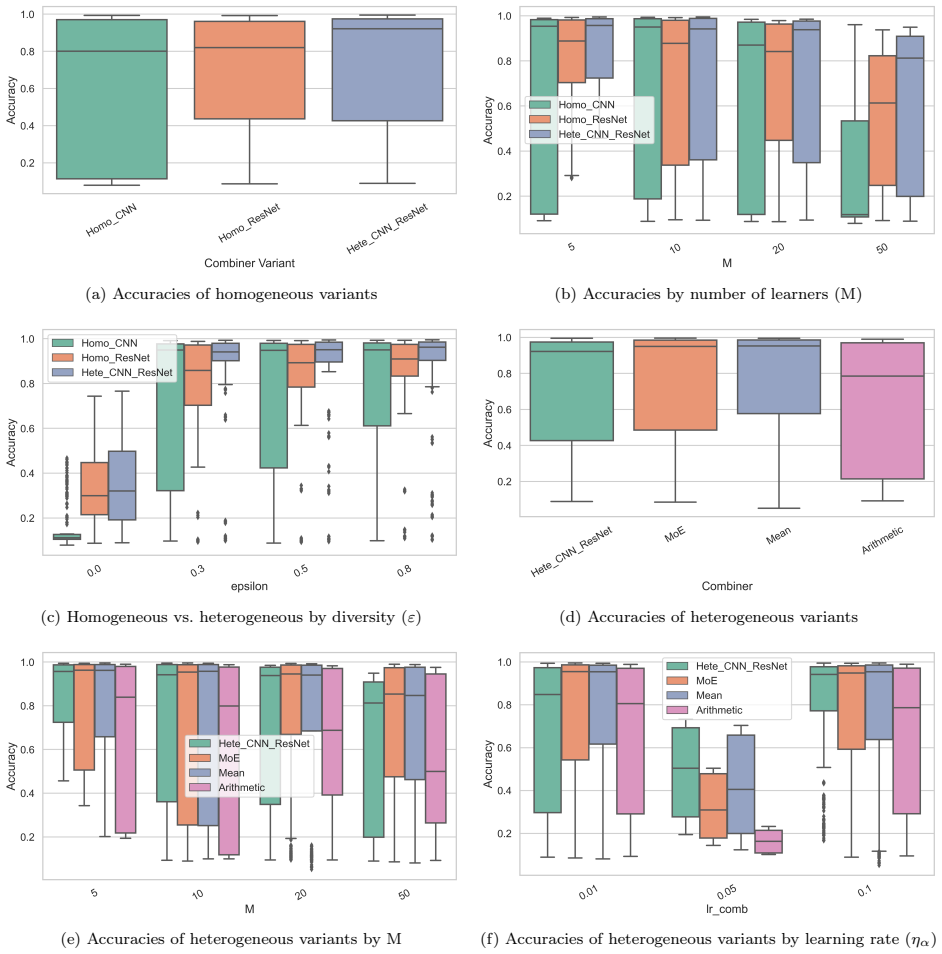
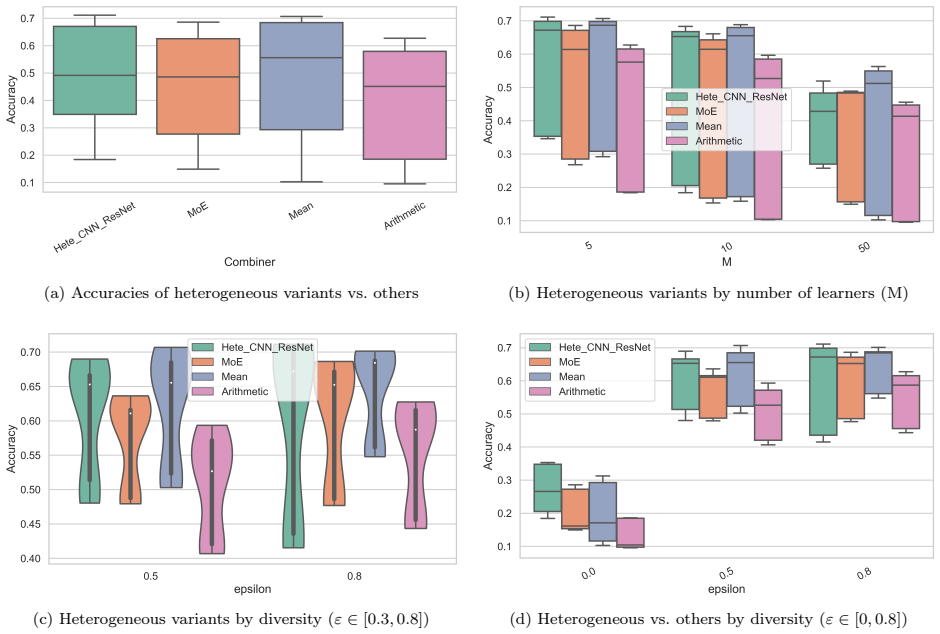
- Practitioners get a direct knob over the bias-variance-diversity trade-off, with evidence that intermediate diversity (epsilon in roughly [0.3, 0.8]) and heterogeneous base architectures give the best accuracy.
- The closed-form least-squares solution for squared losses and gradient-based training for arbitrary losses means the same framework can be extended to non-Euclidean losses such as Itakura-Saito divergence.
- The reported ranking of combiners - s-BFN above logit averaging, MoE, and arithmetic mean - implies that learned probability-space aggregation can be a robust default for deep ensembles, especially when base models are miscalibrated.
- Optimal ensemble size depends on dataset complexity and diversity, so capacity should be scaled jointly with diversity rather than treated as an independent hyperparameter.
Reading between the lines
- An extension the paper leaves implicit: if the centroidal identification is taken literally, s-BFN should reproduce the exact Bregman centroid as the number of basis functions and training data grow; one testable prediction is that accuracy gains concentrate where base predictions are well separated into Voronoi cells.
- The epsilon mechanism suggests a continuous family of training objectives between hard winner-takes-all and uniform updates; scheduling epsilon over training or per hypothesis could adapt diversity to local data complexity more flexibly than a global constant.
- Because the combiner feeds on softmax probabilities rather than logits, its advantage over logit averaging is likely most pronounced when base softmax outputs are miscalibrated; temperature-scaling the base probabilities before the RBF map is a natural intervention the paper does not explore.
- The representational claim that RBF features with running-statistic centers can express the loss centroid is the fragile link; a parameter-free diagnostic comparing s-BFN outputs to closed-form centroids on held-out base predictions would directly probe it.
Editorial analysis
A structured set of objections, weighed in public.
Referee Report
Summary. The paper introduces Structured Basis Function Networks (s-BFN), a combiner that maps a concatenation of base-predictor outputs through a radial-basis feature map and a linear readout, with the claimed property that the resulting prediction is the Bregman centroid induced by the task loss (squared loss for regression, cross-entropy for classification). A tunable diversity parameter ε modulates base-learner updates, and the framework admits both a closed-form ridge solution and gradient-based training. Experiments on tabular regression and MNIST/Fashion-MNIST/CIFAR-10 image classification are presented to support claims that s-BFN outperforms logit averaging, Mixture-of-Experts, and arithmetic-mean baselines, and to study a complexity–capacity–diversity trade-off.
Significance. If the central claims held, the paper would offer a useful synthesis of multi-hypothesis prediction and loss-geometry-aware ensembling. The closed-form ridge estimator (Eq. 7) and the gradient updates in Section 3.3.2 are standard and internally consistent, and the explicit diversity-control mechanism is a practical idea. However, the empirical core is compromised by an internal inconsistency in the reported tables, and the theoretical link between the s-BFN output and the Bregman centroid is asserted rather than proven. As printed, the paper does not support its headline empirical claims.
major comments (3)
- [Tables 7–10 (Section 4.5)] Tables 7, 8, 9, and 10 report exactly identical values for MNIST and CIFAR-10: Table 7 gives the same sRBF/MoE/Base accuracies (49.10/47.96/39.71 and 32.70/33.45/30.38), Table 8 gives identical best-configuration accuracies, Table 9 gives identical train/eval times, FLOPs, and parameters, and Table 10 gives identical sensitivity values for every ε. MNIST and CIFAR-10 are different datasets, so exact equality to two decimals across all metrics cannot occur by chance. This indicates a copy/paste or labeling error. Section 4.4's central claim that 's-BFN achieves the highest accuracy, followed by logit averaging, MoE, and arithmetic-mean' across datasets is therefore unsupported by the printed evidence. This is a load-bearing error: the main empirical contribution cannot be verified without corrected tables or the underlying raw results/code.
- [Section 3.2.1, Figure 1] The paper asserts that the s-BFN output Φ(Di)α is the Bregman centroid of the base predictions, but no derivation or theorem establishes this. For cross-entropy, the Bregman centroid under KL divergence is a weighted geometric mean of probability vectors (equivalently, softmax of weighted logits). The s-BFN instead applies a radial-basis feature map to concatenated probability vectors and a linear readout; even if α is trained with the task loss, this does not imply that the resulting prediction equals the centroid. The RBF feature map may not be expressive enough, and no convergence or representational result is given. This matters because 'centroidal aggregation' is a central claim of the abstract and introduction. At minimum, the paper should state this as an approximation and provide a concrete test (e.g., synthetic mixtures where the true centroid is known) or a proof under explicit
- [Section 4.4 and Figures 3–8] Several quantitative claims about the complexity–capacity–diversity trade-off are based on figures that are described but whose numerical values are not reported in tables. For instance, the claims that 'accuracy peaks at moderate M on MNIST' and 'on CIFAR-10, capacity gains materialize only when diversity is sufficiently high' are asserted from plots without accompanying summary statistics or error bars in the text. Given that the only dataset-level tables (Tables 7–10) contain the MNIST/CIFAR-10 duplication, these figure-dependent conclusions are not independently checkable from the manuscript. Please provide per-configuration numerical results or a data/code release.
minor comments (4)
- [Algorithm 1] The regularization term in the update is written inconsistently: Eq. (8) uses λ1^j ∇θj Rθj(θj), while Algorithm 1 writes λ1^j/N sgn(θj). Please align the notation and specify the exact regularization used.
- [Section 3.2.1] The phrase 'the ensemble output must follow the associated centroidal rule' is stated as fact. Since the Bregman centroid is the optimal combiner for a given loss only under a specific aggregation model, please qualify this statement and cite the precise assumptions from Wood et al. (2024).
- [Various] There is no code or data availability statement. Given the empirical inconsistencies, providing code or raw output tables would be essential for reproducibility.
- [Appendix A] The comparison between GBF and RBF-KMeans is useful, but the description of center initialization says GBF centers are 'uniformly assigned' while RBF-KMeans centers are 'derived from unsupervised clustering.' Please clarify whether GBF centers are fixed or learned, and how this affects the claimed advantages.
Circularity Check
No circularity found: the s-BFN combiner is trained by direct loss minimization (ridge or gradient), and the Bregman-centroid claim, while under-derived, is an assertion rather than an equation that reduces to its own input.
full rationale
Walking the derivation chain, Section 3.3 defines the s-BFN output as Φ(D_i)α and Eq. (7) is the standard ridge-regression solution; Algorithms 1–2 minimize MSE and cross-entropy respectively. The paper asserts in Section 3.2.1 and Figure 1 that the s-BFN output is the loss-induced Bregman centroid, but training α by the task loss is not, by construction, equivalent to solving ẑ = argmin_z Σ_j α_j Bφ(z_j, z). That is a missing derivation / support gap, not a circular reduction: no equation is defined in terms of the result it is used to predict, and no fitted parameter is renamed as a prediction. The self-citation to Dominguez et al. (2025) for the closed-form estimator is not load-bearing because Eq. (7) is derived in the present text; the Bregman-centroid background is cited from Wood et al. (2024), which is not a self-citation. I also flag that Tables 7–10 report identical MNIST and CIFAR-10 numbers, which is an empirical/internal-consistency problem, but it is a correctness issue rather than circularity. No step in the paper reduces its stated prediction to the data or fitted values by definition, so the circularity score is 0.
Assumptions & free parameters
free parameters (7)
- diversity parameter epsilon =
0.35 best on tabular regression; 0.5-0.8 best on image classification
- number of hypotheses/base learners M =
2,5,10,20,35 searched; best configurations use M=5 or 10
- RBF centers C and scales gamma =
computed from running statistics (G1-G3) or updated by gradient (Algorithm 2)
- regularization lambda1, lambda2 =
lambda1 in {0,0.0001,0.01,0.07}; lambda2 in {0,3,5,7}
- learning rates eta_theta, eta_alpha =
0.03, 0.3, 1.0 searched; best classification runs use eta_alpha=0.1
- temperature T =
3 for best configurations
- number of RBF units K =
K=M for regression; K can be M*k for classification, k unspecified
assumptions (4)
- domain assumption The optimal way to combine base predictions for a given loss is the Bregman centroid of those predictions (Wood et al., 2024).
- ad hoc to paper A radial-basis feature map with centers and scales computed from running statistics can represent the Bregman centroid sufficiently well.
- domain assumption Base predictors trained with the epsilon-modulated update in Eq. (9) will specialize in the desired way without mode collapse.
- domain assumption The hyperparameter grid (Table 3) and holdout splits provide unbiased estimates of generalization.
Cite this review
Pith. "Pith review of Structured Basis Function Networks: Loss-Centric Multi-Hypothesis Ensembles with Controllable Diversity." pith.science (2026). https://pith.science/paper/JLAKFJ4R
@misc{pith2026250902792,
  author       = {Pith},
  title        = {Pith review of: Structured Basis Function Networks: Loss-Centric Multi-Hypothesis Ensembles with Controllable Diversity},
  year         = {2026},
  howpublished = {\url{https://pith.science/paper/JLAKFJ4R}},
  note         = {Machine review of arXiv:2509.02792}
}
read the original abstract
Existing approaches to predictive uncertainty rely either on multi-hypothesis prediction, which promotes diversity but lacks principled aggregation, or on ensemble learning, which improves accuracy but rarely captures the structured ambiguity. This implicitly means that a unified framework consistent with the loss geometry remains absent. The Structured Basis Function Network addresses this gap by linking multi-hypothesis prediction and ensembling through centroidal aggregation induced by Bregman divergences. The formulation applies across regression and classification by aligning predictions with the geometry of the loss, and supports both a closed-form least-squares estimator and a gradient-based procedure for general objectives. A tunable diversity mechanism provides parametric control of the bias-variance-diversity trade-off, connecting multi-hypothesis generalisation with loss-aware ensemble aggregation. Experiments validate this relation and use the mechanism to study the complexity-capacity-diversity trade-off across datasets of increasing difficulty with deep-learning predictors.
Figures


Figures from the paper (5 more)



Reference graph
Works this paper leans on
-
[1]
write newline
" write newline "" before.all 'output.state := FUNCTION n.dashify 't := "" t empty not t #1 #1 substring "-" = t #1 #2 substring "--" = not "--" * t #2 global.max substring 't := t #1 #1 substring "-" = "-" * t #2 global.max substring 't := while if t #1 #1 substring * t #2 global.max substring 't := if while FUNCTION word.in bbl.in ":" * " " * FUNCTION f...
-
[2]
write newline
" write newline "" before.all 'output.state := FUNCTION n.dashify 't := "" t empty not t #1 #1 substring "-" = t #1 #2 substring "--" = not "--" * t #2 global.max substring 't := t #1 #1 substring "-" = "-" * t #2 global.max substring 't := while if t #1 #1 substring * t #2 global.max substring 't := if while FUNCTION word.in bbl.in ":" * " " * FUNCTION f...
-
[3]
write newline
" write newline "" before.all 'output.state := FUNCTION n.dashify 't := "" t empty not t #1 #1 substring "-" = t #1 #2 substring "--" = not "--" * t #2 global.max substring 't := t #1 #1 substring "-" = "-" * t #2 global.max substring 't := while if t #1 #1 substring * t #2 global.max substring 't := if while FUNCTION word.in bbl.in ":" * " " * FUNCTION f...
-
[4]
Pathologies of Predictive Diversity in Deep Ensembles
Abe, T., Buchanan, E. K., Pleiss, G., and Cunningham, J. P. (2023). Pathologies of predictive diversity in deep ensembles. CoRR , abs/2302.00704
work page Pith review arXiv 2023
-
[5]
Arghira, N., Hawarah, L., Ploix, S., and Jacomino, M. (2012). Prediction of appliances energy use in smart homes. Energy , 48(1):128--134. 6th Dubrovnik Conference on Sustainable Development of Energy Water and Environmental Systems, SDEWES 2011
work page 2012
-
[6]
Bishop, C. M. (1995). Neural networks for pattern recognition . Oxford
work page 1995
-
[7]
Bregman, L. (1967). The relaxation method of finding the common point of convex sets and its application to the solution of problems in convex programming. USSR Computational Mathematics and Mathematical Physics , 7(3):200--217
work page 1967
-
[8]
Breiman, L. (1996). Bagging predictors. Mach. Learn. , 24(2):123–140
work page 1996
Show all 54 references
-
[9]
Brown, G. (2004). Diversity in neural network ensembles . PhD thesis, Citeseer
2004
-
[10]
M., Feldheim, V., and Deramaix, D
Candanedo, L. M., Feldheim, V., and Deramaix, D. (2017). Data driven prediction models of energy use of appliances in a low-energy house. Energy and Buildings , 140:81--97
2017
-
[11]
Cetin, K., Tabares-Velasco, P., and Novoselac, A. (2014). Appliance daily energy use in new residential buildings: Use profiles and variation in time-of-use. Energy and Buildings , 84:716--726
2014
-
[12]
De Vito , S., Massera, E., Piga, M., Martinotto, L., and Di Francia , G. (2008). On field calibration of an electronic nose for benzene estimation in an urban pollution monitoring scenario. Sensors and Actuators B: Chemical , 129(2):750--757
2008
-
[13]
R., Shahzad, M., and Hong, X
Dominguez, A. R., Shahzad, M., and Hong, X. (2025). Structured radial basis function network: Modelling diversity for multiple hypotheses prediction. In Bramer, M. and Stahl, F., editors, Artificial Intelligence XLI , pages 88--101, Cham. Springer Nature Switzerland
2025
-
[14]
Dosovitskiy, A., Beyer, L., Kolesnikov, A., Weissenborn, D., Zhai, X., Unterthiner, T., Dehghani, M., Minderer, M., Heigold, G., Gelly, S., Uszkoreit, J., and Houlsby, N. (2021). An image is worth 16x16 words: Transformers for image recognition at scale. In International Confe...
2021
-
[15]
Fort, S., Hu, H., and Lakshminarayanan, B. (2019). Deep ensembles: A loss landscape perspective. ArXiv , abs/1912.02757
2019 arXiv
-
[16]
Germain, P., Lacasse, A., Laviolette, F., Marchand, M., and Roy, J.-F. (2015). Risk bounds for the majority vote: From a pac-bayesian analysis to a learning algorithm. Journal of Machine Learning Research , 16:787--860
2015
-
[17]
Grandvalet, Y., d'Alch \'e Buc, F., and Ambroise, C. (2001). Boosting mixture models for semi-supervised learning. In Dorffner, G., Bischof, H., and Hornik, K., editors, Artificial Neural Networks --- ICANN 2001 , pages 41--48, Berlin, Heidelberg. Springer Berlin Heidelberg
2001
-
[18]
Guzm\' a n-rivera, A., Batra, D., and Kohli, P. (2012). Multiple choice learning: Learning to produce multiple structured outputs. In Pereira, F., Burges, C., Bottou, L., and Weinberger, K., editors, Advances in Neural Information Processing Systems , volume 25. Curran Associates, Inc
2012
-
[19]
Guzman-Rivera, A., Kohli, P., Batra, D., and Rutenbar, R. (2014). Efficiently Enforcing Diversity in Multi-Output Structured Prediction . In Kaski, S. and Corander, J., editors, Proceedings of the Seventeenth International Conference on Artificial Intelligence and Statistics ,...
2014
-
[20]
E., Vinyals, O., and Dean, J
Hinton, G. E., Vinyals, O., and Dean, J. (2015). Distilling the knowledge in a neural network. ArXiv , abs/1503.02531
2015 arXiv
-
[21]
Ho, T. K. and Basu, M. (2002). Complexity measures of supervised classification problems. IEEE Transactions on Pattern Analysis and Machine Intelligence , 24(3):289--300
2002
-
[22]
Huang, G., Li, Y., Pleiss, G., Liu, Z., Hopcroft, J., and Weinberger, K. (2017). Snapshot ensembles: Train 1, get m for free
2017
-
[23]
Kondratyuk, D., Tan, M., Brown, M., and Gong, B. (2020). When ensembling smaller models is more efficient than single large models
2020
-
[24]
Krizhevsky, A. (2009). Learning multiple layers of features from tiny images
2009
-
[25]
and Vedelsby, J
Krogh, A. and Vedelsby, J. (1994). Neural network ensembles, cross validation, and active learning. In Tesauro, G., Touretzky, D., and Leen, T., editors, Advances in Neural Information Processing Systems , volume 7. MIT Press
1994
-
[26]
and Whitaker, C
Kuncheva, L. and Whitaker, C. (2003). Measures of diversity in classifier ensembles and their relationship with the ensemble accuracy. Machine Learning , 51:181--207
2003
-
[27]
Lakshminarayanan, B., Pritzel, A., and Blundell, C. (2017). Simple and scalable predictive uncertainty estimation using deep ensembles. In Proceedings of the 31st International Conference on Neural Information Processing Systems , NIPS'17, page 6405–6416, Red Hook, NY, USA. Cu...
2017
-
[28]
Lecun, Y., Bottou, L., Bengio, Y., and Haffner, P. (1998). Gradient-based learning applied to document recognition. Proceedings of the IEEE , 86(11):2278--2324
1998
-
[29]
Leemann, T., Sackmann, M., Thielecke, J., and Hofmann, U. (2021). Distribution preserving multiple hypotheses prediction for uncertainty modeling. CoRR , abs/2110.02858
2021 arXiv
-
[30]
and Lee, G
Li, C. and Lee, G. H. (2019). Generating multiple hypotheses for 3d human pose estimation with mixture density network. In 2019 IEEE/CVF Conference on Computer Vision and Pattern Recognition (CVPR) , pages 9879--9887
2019
-
[31]
Li, W., Liu, H., Tang, H., and Wang, P. (2023a). Multi-hypothesis representation learning for transformer-based 3d human pose estimation. Pattern Recognition , 141:109631
-
[32]
Li, Z., Ren, K., Yang, Y., Jiang, X., Yang, Y., and Li, D. (2023b). Towards inference efficient deep ensemble learning. In Proceedings of the Thirty-Seventh AAAI Conference on Artificial Intelligence and Thirty-Fifth Conference on Innovative Applications of Artificial Intellig...
-
[33]
Liu, X., Peng, H., Zheng, N., Yang, Y., Hu, H., and Yuan, Y. (2023). Efficientvit: Memory efficient vision transformer with cascaded group attention. In 2023 IEEE/CVF Conference on Computer Vision and Pattern Recognition (CVPR) , pages 14420--14430
2023
-
[34]
Mienye, I. D. and Sun, Y. (2022). A survey of ensemble learning: Concepts, algorithms, applications, and prospects. IEEE Access , 10:99129--99149
2022
-
[35]
H., Sinthong, P., and Kalagnanam, J
Nie, Y., Nguyen, N. H., Sinthong, P., and Kalagnanam, J. (2022). A time series is worth 64 words: Long-term forecasting with transformers. ArXiv , abs/2211.14730
2022 arXiv
-
[36]
Rosset, S., Zou, H., and Hastie, T. (2006). Multi-class adaboost. Statistics and its interface , 2
2006
-
[37]
Rupprecht, C., Laina, I., DiPietro, R., Baust, M., Tombari, F., Navab, N., and Hager, G. D. (2017). Learning in an uncertain world: Representing ambiguity through multiple hypotheses. In Proceedings of the IEEE International Conference on Computer Vision , pages 3591--3600
2017
-
[38]
H., Khosravi, A., Alinejad-Rokny, H., Lam, H., Fuller-Tyszkiewicz, M., Acharya, U
Shoeibi, A., Khodatars, M., Jafari, M., Ghassemi, N., Moridian, P., Alizadehsani, R., Ling, S. H., Khosravi, A., Alinejad-Rokny, H., Lam, H., Fuller-Tyszkiewicz, M., Acharya, U. R., Anderson, D., Zhang, Y., and Gorriz, J. M. (2023). Diagnosis of brain diseases in fusion of neu...
2023
-
[39]
Tassi, C. R. N., Gawlikowski, J., Fitri, A. U., and Triebel, R. (2022). The impact of averaging logits over probabilities on ensembles of neural networks. In Pedroza, G., Chen, X. C., Hern \' a ndez - Orallo, J., Huang, X., Espinoza, H., Mallah, R., McDermid, J. A., and Castil...
2022
-
[40]
Tax, D., Duin, R., and Breukelen, M. (1997). Comparison between product and mean classifier combination rules. In Pudil, J. and Grim, J., editors, Proc. 1st International Workshop Statistical Techniques in Pattern Recognition , pages 165--170
1997
-
[41]
and GHOSH, J
TUMER, K. and GHOSH, J. (1996). Error correlation and error reduction in ensemble classifiers. Connection Science , 8(3-4):385--404
1996
-
[42]
and Nakano, R
Ueda, N. and Nakano, R. (1996). Generalization error of ensemble estimators. In Proceedings of International Conference on Neural Networks (ICNN'96) , volume 1, pages 90--95 vol.1
1996
-
[43]
Vito, S. (2008). Air Quality . UCI Machine Learning Repository. DOI : https://doi.org/10.24432/C59K5F
2008 doi
-
[44]
M., Movshovitz - Attias, Y., and Eban, E
Wang, X., Kondratyuk, D., Christiansen, E., Kitani, K. M., Movshovitz - Attias, Y., and Eban, E. (2022). Wisdom of committees: An overlooked approach to faster and more accurate models. In The Tenth International Conference on Learning Representations, ICLR 2022, Virtual Event...
2022
-
[45]
Wilson, A. G. and Izmailov, P. (2020). Bayesian deep learning and a probabilistic perspective of generalization. In Larochelle, H., Ranzato, M., Hadsell, R., Balcan, M., and Lin, H., editors, Advances in Neural Information Processing Systems , volume 33, pages 4697--4708. Curr...
2020
-
[46]
Wolpert, D. H. (1992). Stacked generalization. Neural Networks , 5(2):241--259
1992
-
[47]
M., Reeve, H
Wood, D., Mu, T., Webb, A. M., Reeve, H. W. J., Luj\' a n, M., and Brown, G. (2024). A unified theory of diversity in ensemble learning. J. Mach. Learn. Res. , 24(1)
2024
-
[48]
Xiao, H., Rasul, K., and Vollgraf, R. (2017). Fashion-mnist: a novel image dataset for benchmarking machine learning algorithms. arXiv preprint arXiv:1708.07747
2017 arXiv
-
[49]
Yuan, T., Xu, Z., Liu, B., and Tang, Y. (2025). Adaptive metric for knowledge distillation by deep bregman divergence. Neural Networks , page 108016
2025
-
[50]
Zeng, A., Chen, M., Zhang, L., Xu, Q., Ma, S., and Liao, W. (2023). Are transformers effective for time series forecasting? In Proceedings of the AAAI Conference on Artificial Intelligence , volume 37, pages 11121--11128
2023
-
[51]
Zhou, C., Peng, Y., Huang, W., Miao, X., Cao, Y., Wang, X., and Kong, X. (2025). A dynamic ensemble learning model for robust graph neural networks. Neural Networks , 191:107810
2025
-
[52]
Zhou, H., Zhang, S., Peng, J., Zhang, S., Li, J., Xiong, H., and Zhang, W. (2022). Fedformer: Frequency enhanced decomposed transformer for long-term series forecasting. In Proceedings of the International Conference on Machine Learning (ICML) , pages 27268--27286
2022
-
[53]
and Lishudi, D
Zinchenko, S. and Lishudi, D. (2024). Star algorithm for neural network ensembling. Neural Networks , 170:364--375
2024
-
[54]
N., Ali, M
Çisil Güldoğuş, B., Abdullah, A. N., Ali, M. A., and Özöǧür Akyüz, S. (2025). Pruning the ensemble of convolutional neural networks using second-order cone programming. Neural Networks , 189:107544
2025
Reviewed August 5, 2026 · model on record in the stance chip above.
Discussion (0). Sign in to comment.