Confidence intervals for the Poisson distribution
Pith reviewed 2026-05-18 19:29 UTC · model grok-4.3
The pith
Garwood confidence intervals should be used to report results from Poisson sampling in physics.
A machine-rendered reading of the paper's core claim, the machinery that carries it, and where it could break.
Core claim
After considering performance with respect to several desirable properties we recommend summarizing the results of Poisson sampling with confidence intervals proposed by Garwood. We note that the p-values obtained from these intervals are well-behaved and intuitive, providing for consistent treatment. We also find that averaging intervals can be problematic if the underlying Poisson distributions are not used.
What carries the argument
Garwood's confidence intervals, selected after comparing their performance on p-value behavior, consistency, and other properties against conventional and alternative techniques.
If this is right
- Poisson sampling results can be summarized with consistent and intuitive p-values using Garwood intervals.
- Averaging intervals requires using the original Poisson distributions to avoid problems.
- Physicists gain a uniform way to describe results across different count measurements.
Where Pith is reading between the lines
- Standard adoption could reduce confusion in how uncertainties are reported across experiments.
- The approach may influence limit-setting procedures in low-count regimes.
- Practical tests in existing analysis software would show whether the recommendation improves reporting workflows.
Load-bearing premise
The chosen desirable properties for evaluation, such as p-value behavior and consistency, are the most relevant criteria for practical use in physics data reporting rather than other statistical measures like exact coverage guarantees.
What would settle it
A specific physics analysis example where an alternative interval method shows superior p-value intuition or consistency compared to Garwood intervals would challenge the recommendation.
Figures


read the original abstract
The Poisson probability distribution is frequently encountered in physical science measurements. In spite of the simplicity and familiarity of this distribution, there is considerable confusion among physicists concerning the description of results obtained via Poisson sampling. The goal of this paper is to mitigate this confusion by examining and comparing the properties of both conventional and popular alternative techniques. We concern ourselves in particular with the description of results, as opposed to interpretation. After considering performance with respect to several desirable properties we recommend summarizing the results of Poisson sampling with confidence intervals proposed by Garwood. We note that the p-values obtained from these intervals are well-behaved and intuitive, providing for consistent treatment. We also find that averaging intervals can be problematic if the underlying Poisson distributions are not used.
Editorial analysis
A structured set of objections, weighed in public.
Referee Report
Summary. The manuscript compares conventional and alternative techniques for constructing confidence intervals for the Poisson distribution in the context of physical science measurements. It evaluates these methods with respect to several desirable properties, including p-value behavior and consistency, and recommends the Garwood intervals for summarizing results from Poisson sampling. The paper notes that these intervals yield well-behaved and intuitive p-values and highlights problems with averaging intervals when the underlying Poisson distributions are not accounted for.
Significance. If the evaluation of properties is comprehensive and the recommendation is supported, this work could help standardize the reporting of Poisson-distributed measurements and reduce confusion among physicists. The emphasis on descriptive properties rather than interpretive ones aligns with practical needs in data analysis for low-count regimes.
major comments (1)
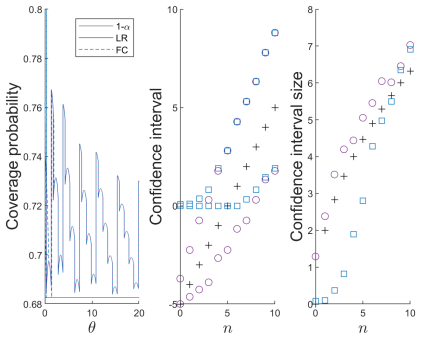
- [Evaluation of properties and recommendation] The recommendation for Garwood intervals rests on p-value behavior and consistency. However, the defining property of a confidence interval is its frequentist coverage probability (at least the nominal level for all true parameter values). The manuscript does not report explicit calculations or tabulations of the coverage function for Garwood intervals (or comparators) across a range of small Poisson means, where discreteness effects are strongest. This is a load-bearing omission for the central claim, as alternatives are frequently criticized for undercovering in exactly these regimes.
minor comments (1)
- [Abstract] The abstract refers to 'several desirable properties' without enumerating them; a brief list in the abstract or introduction would improve accessibility.
Simulated Author's Rebuttal
We thank the referee for their thoughtful and constructive review of our manuscript. We address the major comment below.
read point-by-point responses
-
Referee: The recommendation for Garwood intervals rests on p-value behavior and consistency. However, the defining property of a confidence interval is its frequentist coverage probability (at least the nominal level for all true parameter values). The manuscript does not report explicit calculations or tabulations of the coverage function for Garwood intervals (or comparators) across a range of small Poisson means, where discreteness effects are strongest. This is a load-bearing omission for the central claim, as alternatives are frequently criticized for undercovering in exactly these regimes.
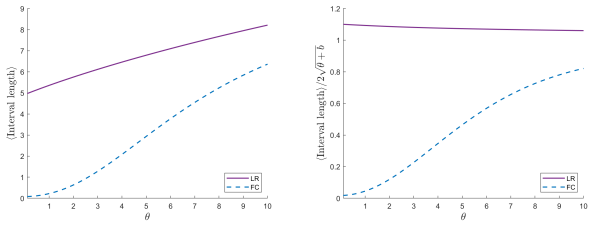
Authors: We agree that frequentist coverage is the defining property of a confidence interval and that explicit evaluation of the coverage function is important, particularly for small Poisson means where discreteness effects are pronounced. Our manuscript prioritizes properties directly relevant to the descriptive use of intervals in physical measurements—such as p-value behavior, intuitiveness, and consistency—because these address common sources of confusion among physicists when reporting results. Nevertheless, we acknowledge the value of also presenting coverage calculations to provide a fuller assessment. In the revised manuscript we will add explicit tabulations and figures showing the coverage probability of the Garwood intervals and the comparator methods over a range of small means (for example, λ = 0 to 10). This addition will allow readers to evaluate coverage alongside the other performance characteristics already discussed. revision: yes
Circularity Check
No circularity: recommendation derived from comparison of independent prior methods
full rationale
The paper evaluates established techniques for Poisson confidence intervals by comparing their performance on properties such as p-value behavior and consistency, drawing from prior statistical literature (e.g., Garwood intervals). No steps reduce claims to self-definitions, fitted inputs renamed as predictions, or load-bearing self-citations. The central recommendation rests on external benchmarks rather than internal construction, making the derivation self-contained.
Axiom & Free-Parameter Ledger
axioms (1)
- domain assumption The Poisson distribution is the correct model for the counting measurements under consideration.
Lean theorems connected to this paper
-
IndisputableMonolith/Cost/FunctionalEquation.leanwashburn_uniqueness_aczel unclear?
unclearRelation between the paper passage and the cited Recognition theorem.
After considering performance with respect to several desirable properties we recommend summarizing the results of Poisson sampling with confidence intervals proposed by Garwood.
What do these tags mean?
- matches
- The paper's claim is directly supported by a theorem in the formal canon.
- supports
- The theorem supports part of the paper's argument, but the paper may add assumptions or extra steps.
- extends
- The paper goes beyond the formal theorem; the theorem is a base layer rather than the whole result.
- uses
- The paper appears to rely on the theorem as machinery.
- contradicts
- The paper's claim conflicts with a theorem or certificate in the canon.
- unclear
- Pith found a possible connection, but the passage is too broad, indirect, or ambiguous to say the theorem truly supports the claim.
Forward citations
Cited by 1 Pith paper
-
Poisson Empirical Bayes via Gamma-Smoothed Nonparametric Maximum Likelihood
A Gamma-smoothed NPMLE for Poisson empirical Bayes achieves optimal nearly parametric rates for posterior means and enables asymptotically exact, shorter marginal coverage confidence sets under compact support.
Reference graph
Works this paper leans on
-
[1]
F. James and M. Roos. Statistical notes on the problem of experimental observations near an unphysical region. Phys. Rev. D , 44:299–301, 1991
work page 1991
-
[2]
F. T. Solmitz. Analysis of experiments in particle physics. Annual Review of Nuclear and Particle Science , 14:375–402, 1964
work page 1964
-
[3]
J. Neyman. Outline of a theory of statistical estimation based on the classi- cal theory of probability. Philosophical Transactions of the Royal Society of London. Series A, Mathematical and Physical Sciences , 236:333–380, 1937. 51
work page 1937
-
[4]
Steven D. Biller and Scott M. Oser. Another look at confidence intervals: Proposal for a more relevant and transparent approach. Nuclear Instru- ments and Methods in Physics Research Section A , 774:103–119, 2015
work page 2015
-
[5]
R.A. Fisher. Inverse probability. Proceedings of the Cambridge Philosoph- ical Society, 26:528–535
- [6]
-
[7]
Y. H. Wang. Fiducial intervals: What are they? The American Statistician, 54(2):105–111, 2000
work page 2000
-
[8]
Maurice G. Kendall and Alan Stuart. The Advanced Theory of Statistics, 3rd edition. Hafner Publishing Company, New York, 1973
work page 1973
-
[9]
I. Narsky and F. C. Porter. Statistical analysis techniques in particle physics: Fits, density estimation and supervised learning . Wiley-VCH, Weinheim, Germany, 2014
work page 2014
-
[10]
W. L. Stevens. Fiducial limits of the parameter of a discontinuous distri- bution. Biometrika, 37:117–129, 1950
work page 1950
-
[11]
Robert Cousins. A method which eliminates the discreteness in Poisson confidence limits and lessens the effect of moving cuts specifically to elimi- nate candidate events. Nucl. Instrum. Meth. A , 337:557–565, 1994
work page 1994
-
[12]
Interval estimation using the likelihood function
Frank Porter. Interval estimation using the likelihood function. Nucl. Instrum. Meth. A , 368:793–803, 1996
work page 1996
-
[13]
Paul W. Vos and Suzanne Hudson. Evaluation criteria for discrete confi- dence intervals: Beyond coverage and length. The American Statistician , 59:137–141, 2005
work page 2005
-
[14]
Mathematical Statistics, 2nd edition
Jun Shao. Mathematical Statistics, 2nd edition. Springer-Verlag, New York, 2003
work page 2003
- [15]
-
[16]
Karim F. Hirji. Exact Analysis of Discrete Data . Chapman&Hall/CRC, 2006
work page 2006
-
[17]
V. V. Patil and H. V. Kulkarni. Comparison of confidence intervals for the Poisson mean: Some new aspects. Revstat Statistical Journal, 10, 2012
work page 2012
-
[18]
Exact confidence intervals and hypoth- esis tests for parameters of discrete distributions
M˚ ans Thulin and Silvelyn Zwanzig. Exact confidence intervals and hypoth- esis tests for parameters of discrete distributions. Bernoulli, 28:459–502, 2017. 52
work page 2017
-
[19]
F. Garwood. Fiducial limits for the Poisson distribution. Biometrika, 28:437–442, 1936
work page 1936
-
[20]
Edwin L. Crow and Robert S. Gardner. Confidence intervals for the expec- tation of a Poisson variable. Biometrika, 46:441–453, 1959
work page 1959
-
[21]
Refining poisson confidence intervals
George Casella and Christian Robert. Refining poisson confidence intervals. The Canadian Journal of Statistics , 17:45–57, 1989
work page 1989
-
[22]
Confidence curves and improved exact confidence intervals for discrete distributions
Helge Blaker. Confidence curves and improved exact confidence intervals for discrete distributions. Canadian Journal of Statistics, 28:783–798, 2000
work page 2000
-
[23]
Exact short poisson confidence intervals
Paul Kabaila and John Byrne. Exact short poisson confidence intervals. The Canadian Journal of Statistics , 29:99–106, 2001
work page 2001
-
[24]
Theodore E. Sterne. Remarks on confidence or fiducial limits. Biometrika, 41:275–278, 1954
work page 1954
-
[25]
Matthew C. Somerville and Rebekkah S. Brown. Exact likelihood ratio and score confidence intervals for the binomial proportion. Pharmaceut. Statist., 12:120–128, 2013
work page 2013
-
[26]
M. F. Schilling and B. Holladay. Length minimization for Poisson con- fidence procedures. Communications in Statistics—Theory and Methods , 46(2):861–873
-
[27]
Edwin L. Crow. Confidence intervals for a proportion. Biometrika, 43:423– 435, 1956
work page 1956
-
[28]
Paul W. Vos and Suzanne Hudson. Problems with binomial two-sided tests and the associated confidence intervals. Aust. N. Z. Stat. , 50:81–89, 2008
work page 2008
-
[29]
Herman Chernoff. A property of some type A regions. Ann. Math. Stat., 22:472–474, 1951. https://projecteuclid.org/download/pdf 1/ euclid.aoms/1177729598
-
[30]
K. Ulm. A simple method to calculate the confidence interval of a standardized mortality ratio (SMR). American Journal of Epidemiology , 131:373–375, 1990
work page 1990
-
[31]
Michael Fay. poisson.exact. https://www.rdocumentation.org/packages/ exactci/versions/1.3-3/topics/poisson.exact, accessed May 1, 2020
work page 2020
-
[32]
Navas and others (Particle Data Group)
S. Navas and others (Particle Data Group). Review of particle properties. Phts. Rev. D , page 030001, 2024
work page 2024
-
[33]
P. M. Kulkarni, R. C. Tripathi, and J. E. Michalek. Maximum (Max) and mid-P confidence intervals and p values for the standardized mortality and incidence ratios. American Journal of Epidemiology , 147(1):83–83, 1998. 53
work page 1998
-
[34]
An invariant form for the prior probability in estimation problems
Harold Jeffreys. An invariant form for the prior probability in estimation problems. Proc. R. Soc. Lond. A , 186:453–461, 1946
work page 1946
-
[35]
Alexander L. Read. Modified frequentist analysis of search results (The CL(s) method). In Workshop on Confidence Limits , pages 81–101, 8 2000
work page 2000
-
[36]
A. L. Read. Presentation of search results: The CL(s) technique. Journal of Physics G: Nuclear and Particle Physics , 28(10):2693–2704, 2002
work page 2002
-
[37]
G. Zech. Upper limits in experiments with background or measurement errors. Nucl. Instrum. Methods Phys. Res. A , 277:608–610, 1989
work page 1989
-
[38]
X. Qian, A. Tan, J. J. Ling, Y. Nakajima, and C. Zhang. The Gaussian CLs method for searches of new physics. Nucl. Instrum. Meth. A , 827:63–78, 2016
work page 2016
-
[39]
Gary J. Feldman and Robert D. Cousins. A unified approach to the classical statistical analysis of small signals. Phys. Rev. D , 57:3873–3889, 1998
work page 1998
-
[40]
John P. Wendell and Josef Schmee. Likelihood confidence intervals for proportions in finite populations. The American Statistician , 55:55–61, 2001. 54
work page 2001
discussion (0)
Sign in with ORCID, Apple, or X to comment. Anyone can read and Pith papers without signing in.