REVIEW 3 major objections 5 minor 92 references
ALMA molecular gas kinematics pin NGC 7052's black hole at 2.5 billion solar masses and lower the galaxy's stellar mass-to-light ratio by 10%.
Reviewed by Pith at T0; open to challenge. T0 means a machine referee read the full paper against a public rubric. the ladder, T0–T4 →
A new ALMA-based dynamical model confirms the central black hole of NGC 7052 weighs about 2.5 billion solar masses and revises the galaxy's I-band stellar mass-to-light ratio down by 10%.
T0 review reviewed 2026-08-05 challenge →
load-bearing objection Careful remeasurement of NGC 7052's SMBH confirms Smith et al.; the improved stellar model gives a 10% lower M/L, but the absolute M/L is distance-limited and the uncertainty reporting needs cleanup. the 3 major comments →
Revisiting the supermassive black hole mass of NGC 7052 using high spatial resolution molecular gas observed with ALMA
The pith
A machine-rendered reading of the paper's core claim, the machinery that carries it, and where it could break.
The reading
Core claim
Forward-modeling the ALMA CO cube as a thin, circularly rotating disk yields MBH = (2.50 ± 0.37 [stat] ± 0.8 [sys]) × 10^9 Msun and M/LF814W = 4.08 ± 0.23 ± 0.4 Msun/Lsun (3σ). The model includes a point-mass black hole, a PSF-deconvolved multi-Gaussian stellar distribution, and the molecular disk's own gravity, and fits the data with residuals ≲15 km/s. No-black-hole models fail to reproduce the central velocity upturn; an over-massive 4.5×10^9 Msun black hole overproduces it. The result confirms the earlier ALMA measurement, lowers the stellar M/L by 10%, and rejects the older ionized-gas estimate of ~3.9×10^8 Msun.
What carries the argument
The mechanism is forward modeling of the 12CO(2-1) data cube: a mock cube is generated assuming circular orbits in the combined potential of a point-mass black hole, a deprojected multi-Gaussian expansion (MGE) stellar mass distribution, and an MGE molecular-gas mass distribution, then convolved with the beam and compared with the data via Bayesian MCMC. The black-hole signal is the central rise in line-of-sight velocity within ~0.5 arcsec, where the black hole dominates the enclosed mass; the beam (0.31x0.23 arcsec) is ~1.5 times smaller than the sphere of influence (R_SOI≈0.45 arcsec, xi≈3.5), so the SMBH's influence is resolved.
Load-bearing premise
The adopted distance to NGC 7052 (69.3 Mpc) is the load-bearing premise: the black-hole mass scales linearly with distance, and the alternative 46.4 Mpc estimate would lower it by about 30%, outside the paper's quoted 3σ statistical band.
What would settle it
Measure the distance to NGC 7052 with an independent method accurate to ~10% (e.g., surface brightness fluctuations or a resolved maser distance). If the distance is 46.4 Mpc, MBH scales to ≈1.7×10^9 Msun, outside the quoted 3σ statistical band; if it is near 69.3 Mpc, the result stands.
If this is right
- NGC 7052 becomes a secure high-mass point for black-hole scaling relations, lying within 1σ of the standard M-sigma relations as a slight positive outlier consistent with recent dry-merger growth.
- Lowering the I-band mass-to-light ratio by 10% changes the partition of enclosed mass between stars and black hole at the resolution scale, sharpening the black-hole constraint.
- The CO kinematics rule out the ionized-gas black-hole mass of ~3.9×10^8 Msun; even allowing an elevated M/L cannot reproduce the central velocity rise.
- Because the molecular gas mass (~2.2×10^9 Msun) is comparable to the black hole mass, including gas self-gravity is necessary for unbiased MBH and M/L estimates in galaxies with massive circumnuclear disks.
- The success at three times lower resolution than the earlier ALMA data indicates that, as long as the beam resolves the sphere of influence, intermediate-resolution CO observations are sufficient to measure MBH, including when a central hole in the gas disk is smeared out.
Where Pith is reading between the lines
- If the alternative Tully-Fisher distance of 46.4 Mpc were correct, the black-hole mass would drop by ~30% to about 1.7×10^9 Msun, placing NGC 7052 closer to the predicted M-sigma sequence; the paper reports this sensitivity but keeps the 69.3 Mpc distance in its headline.
- The improved mass-model recipe (PSF deconvolution, wide-field MGE, gas self-gravity) could be applied to the higher-resolution cube of the same galaxy; if the result still gives 2.5×10^9 Msun, the method's robustness to beam size and central-hole smearing would be directly demonstrated.
- More generally, galaxies with large circumnuclear CO disks and gas masses near their black-hole mass may need the same gas-self-gravity correction, so prior MBH values in such systems could be re-examined.
- A resolved measurement of the molecular gas vertical thickness and velocity-dispersion profile in NGC 7052, from deeper ALMA observations, would test whether the razor-thin, constant-dispersion assumption hides a small MBH bias.
Editorial analysis
A structured set of objections, weighed in public.
Referee Report
Summary. The paper re-derives the central black hole mass and stellar mass-to-light ratio of NGC 7052 from ALMA 12CO(2-1) observations at 0.31"×0.23" resolution. The authors construct an improved stellar mass model from the HST/WFPC2 WFC F814W image with PSF deconvolution and a wider field, add a molecular-gas mass model with M_gas≈2.2×10^9 M_sun, and fit the full data cube with KinMS using two prescriptions for the CO distribution (SkySampler and a two-Gaussian analytic model). They find M_BH≈(2.50±0.37 [stat]±0.8 [sys])×10^9 M_sun and M/L_F814W≈4.08±0.23 [stat]±0.4 [sys] M_sun/L_sun, consistent with Smith et al. (2021) but with M/L 10% lower. A series of robustness tests (thick disk, radial sigma_gas profiles, radial M/L profiles, unmasked MGE) leaves M_BH within roughly 10% of the adopted value.
Significance. If correct, this is a useful confirmation of the SMBH mass in NGC 7052 using only intermediate-resolution ALMA data, and it supports the view that resolving the sphere of influence, rather than pushing to the highest possible resolution, is the key requirement for molecular-gas black-hole measurements. The forward-modeling of the full data cube, the PSF-deconvolved wide-field stellar MGE, and the explicit inclusion of gas self-gravity (M_gas comparable to M_BH) are clear improvements over the previous analysis. The agreement between two independent gas-distribution prescriptions and the extensive robustness tests strengthen the dynamical measurement. However, the distance dependence of the stellar M/L and the treatment of the gas MGE in the potential need to be resolved before the headline error bars and the 10% M/L comparison can be taken at face value.
major comments (3)
- [Section 4.5.1 and Abstract] The distance systematic is propagated only to M_BH (M_BH ∝ D) and not to M/L_F814W. At fixed observed surface brightness in Lsun pc^-2, the stellar mass within a given angular radius scales as D^2, while the dynamical mass at that radius scales as D; the fitted M/L therefore scales roughly as 1/D over the region where stars contribute. With the alternative D=46.4 Mpc, the central M/L would be ≈6.1, far outside the quoted ±0.4 systematic. Thus the abstract's M/L value and the claim of a 10% lower M/L relative to Smith et al. are contingent on the adopted distance. Please propagate the distance uncertainty to M/L or explicitly state that M/L is quoted for the adopted distance only.
- [Section 3.3 and Section 4.1] The molecular gas MGE is fit to the zeroth-moment map of the 12CO(2-1) cube, and the text states that deconvolution with the synthesized beam is skipped because 'this was already accounted for when generating the zeroth-moment map.' The zeroth-moment map is beam-convolved, so this MGE is a smoothed representation of the intrinsic gas distribution. The MGE is then used in the galaxy mass model (Section 3.4) and in the KinMS circular-velocity calculation (Section 4.1). Since M_gas≈2.2×10^9 M_sun is comparable to M_BH, the gas potential is based on an over-smoothed mass distribution, which could bias the inferred M_BH. Please quantify the effect by using a deconvolved gas MGE (or fitting in the uv-plane), or demonstrate that the bias is below the quoted uncertainties.
- [Section 4.4, Table 5, Abstract] Section 4.4 states 'All uncertainties are given at the 1σ confidence level,' while the abstract quotes ±0.37×10^9 M_sun as the statistical uncertainty and labels the result as 3σ. Table 5 shows the 1σ uncertainty on log M_BH is ±0.02 dex (≈±0.12×10^9 M_sun), while the 3σ value is ±0.06 dex (≈±0.38×10^9 M_sun); the abstract uses the 3σ value. The 1σ/3σ convention must be made consistent between the abstract, the text, and the table so that the headline precision is unambiguous.
minor comments (5)
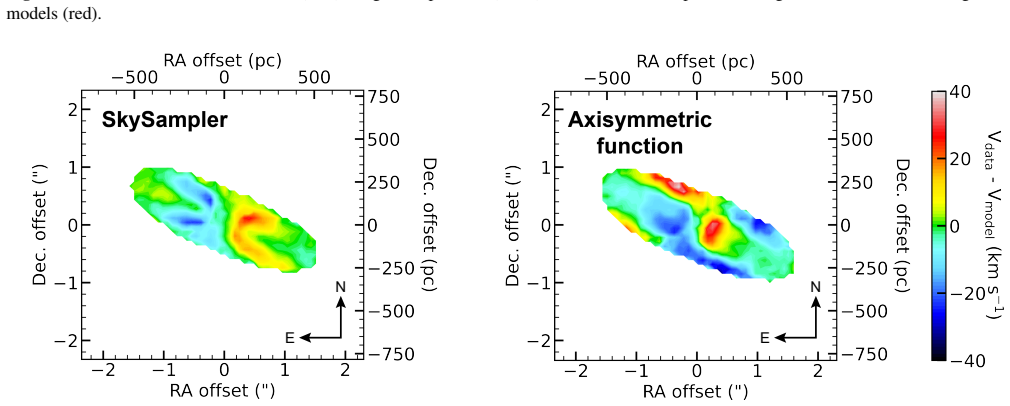
- [Section 4.4/Figures 9-12] The text says the SkySampler model 'significantly reduces differences' in the residual velocity field, yet the reported chi^2 values are lower for the axisymmetric model (chi2_red,min=0.754 vs 0.867). Please reconcile or explain this model-selection inconsistency.
- [Section 4.5.6 and Table 6] The claim that M_BH differs by 'less than 10% and 2% for the linear and Gaussian profiles' does not match Table 6: the linear profile gives log M_BH=9.41 vs default 9.40 (≈2%), while the Gaussian gives 9.37 (≈6%). Please correct the percentages.
- [Table 5] Under the 'Analytically axisymmetric function' block, the 'Mass model' rows appear duplicated from the SkySampler block (identical log M_BH and M/L values). This is likely a copy-paste error and should be checked.
- [Section 4.5.3] The sentence about 'less than 14% and 22% for the exponential and Gaussian sigma_gas(r) profiles' is unclear, and the fitted M_BH values quoted in that section differ from the default by only ~5-9%, not 14-22%. Please clarify the intended comparison.
- [Various] Minor typos: 'entire the image' (Section 3.2), '10 6 gas particles' should be '10^6' (Section 4.2.1), and 'Nanc ¸ay' formatting (Section 4.5.1).
Circularity Check
No significant circularity: MBH and M/L are obtained by forward-modeling the ALMA data cube with free parameters; comparison models and external checks are not used to set the result.
full rationale
The MBH and M/L estimates are derived by forward-modeling the observed ALMA 12CO(2-1) data cube with the KinMS tool (Section 4.1), fitting nine free parameters (including log MBH and M/L) via MCMC against the full 3D cube (Section 4.3). The stellar mass model is an MGE fit to HST imaging scaled by a fitted M/L; the gas mass model is fixed from the CO flux and a standard XCO factor (Section 3.3). The no-BH and 4.5e9 Msun models in Figure 10 are illustrative comparisons, not calibration inputs, and the consistency check against Smith et al. (2021) is an independent, externally published measurement using different ALMA data. Self-citations (e.g., Nguyen et al. 2020, 2022, 2025a,b) are methodological context and are not load-bearing: the central code (KinMS) and the data are external. The only near-loop is the iterative use of the best-fit M/L when constructing the stellar mass model in Section 3.2, but this is standard simultaneous fitting, not a definitional identity, because M/L is a free parameter constrained by the same cube rather than derived from MBH. Section 4.5.1 explicitly acknowledges MBH ∝ D with a ~30% systematic from the two distance estimates, but it does not propagate the distance uncertainty to M/L; this is a robustness gap in the quoted M/L error bar, not a circularity, since M/L is fitted independently and is not defined in terms of MBH or the headline result.
Axiom & Free-Parameter Ledger
free parameters (9)
- log(MBH/Msun) =
9.40 (MBH = 2.50e9 Msun)
- M/L_F814W (Msun/Lsun) =
4.08
- f (Jy km/s) =
41.81
- i (degrees) =
73.49
- Gamma (degrees) =
63.90
- sigma_gas (km/s) =
14.11
- x_c (arcsec) =
-0.010
- y_c (arcsec) =
-0.017
- v_off (km/s) =
-13.234
axioms (7)
- domain assumption Molecular gas follows circular orbits in a razor-thin disk.
- domain assumption Observed CO linewidths are dominated by beam smearing and projection, modeled with a constant velocity dispersion.
- domain assumption Stellar mass follows the I-band light with a constant M/L, and dark matter is negligible within the CO disk.
- domain assumption The distance to NGC 7052 is 69.3 Mpc.
- domain assumption CO-to-H2 conversion factor X_CO = 2e20 cm^-2 (K km/s)^-1 and 12CO(2-1)/12CO(1-0) ratio of unity.
- domain assumption The SMBH is a point mass at the kinematic center, coincident with the radio continuum peak.
- domain assumption The stellar light distribution is axisymmetric and the MGE deprojection is unique at the fitted inclination.
Cite this review
Pith. "Pith review of Revisiting the supermassive black hole mass of NGC 7052 using high spatial resolution molecular gas observed with ALMA." pith.science (2026). https://pith.science/paper/22Z63AFO
@misc{pith2026250902956,
  author       = {Pith},
  title        = {Pith review of: Revisiting the supermassive black hole mass of NGC 7052 using high spatial resolution molecular gas observed with ALMA},
  year         = {2026},
  howpublished = {\url{https://pith.science/paper/22Z63AFO}},
  note         = {Machine review of arXiv:2509.02956}
}
abstract
We present our dynamical mass constraints on the central supermassive black hole (SMBH) in the early-type galaxy NGC 7052 using high spatial-resolution observations of $^{12}$CO(2-1) emission from the Atacama Large Millimeter/submillimeter Array (ALMA). The data were obtained during ALMA Cycle 7 and have a synthesized beam size of 0''.29 $\times$ 0''.22 (97 $\times$ 73 pc$^2$). The dynamical model yielded an SMBH mass of $\approx (2.50 \pm 0.37 \, [{\rm statistical}] \pm 0.8 \, [{\rm systematic}]) \times 10^9$ M$_{\odot}$ and a stellar-$I$ band mass-to-light ratio of $\approx 4.08 \pm 0.23\, [{\rm statistical}] \pm 0.4 \, [{\rm systematic}]$ M$_{\odot}$/L$_{\odot}$ ($3\sigma$ confidence intervals). Although our new ALMA observation has three times lower spatial resolution than previous ALMA data, it still resolves the SMBH's sphere of influence with a spatial resolution that is 1.5 times smaller than this sphere radius. While our $M_{\rm BH}$ estimate is fully consistent with the previous determination, the $I$-band mass-to-light ratio is lower by 10%. This difference arises from our improved galaxy mass model, which incorporates both the molecular gas distribution and the extended stellar mass in the outer regions of the galaxy, components that were previously neglected.
Figures




Reference graph
Works this paper leans on
-
[1]
Ahn, C. P., Seth, A. C., Cappellari, M., et al. 2018, ApJ, 858, 102, doi: 10.3847/1538-4357/aabc57
-
[2]
Alatalo, K., Davis, T. A., Bureau, M., et al. 2013, MNRAS, 432, 1796, doi: 10.1093/mnras/sts299 Astropy Collaboration, Price-Whelan, A. M., Lim, P. L., et al. 2022, ApJ, 935, 167, doi: 10.3847/1538-4357/ac7c74
-
[3]
J., Hack, W
Avila, R. J., Hack, W. J., & STScI AstroDrizzle Team. 2012, in American Astronomical Society Meeting Abstracts, Vol. 220, American Astronomical Society Meeting Abstracts #220, 135.13
2012
-
[4]
Barth, A. J., Boizelle, B. D., Darling, J., et al. 2016a, ApJL, 822, L28, doi: 10.3847/2041-8205/822/2/L28
-
[5]
Barth, A. J., Darling, J., Baker, A. J., et al. 2016b, ApJ, 823, 51, doi: 10.3847/0004-637X/823/1/51
-
[6]
C., Markham, M., Rosborough, S., et al
Bentz, M. C., Markham, M., Rosborough, S., et al. 2023a, ApJ, 959, 25, doi: 10.3847/1538-4357/ad08b8
-
[7]
Bentz, M. C., Onken, C. A., Street, R., & Valluri, M. 2023b, ApJ, 944, 29, doi: 10.3847/1538-4357/acab62
-
[8]
1996, A&AS, 117, 393, doi: 10.1051/aas:1996164
Bertin, E., & Arnouts, S. 1996, A&AS, 117, 393, doi: 10.1051/aas:1996164
-
[9]
Boizelle, B. D., Barth, A. J., Walsh, J. L., et al. 2019, ApJ, 881, 10, doi: 10.3847/1538-4357/ab2a0a
-
[10]
Boizelle, B. D., Walsh, J. L., Barth, A. J., et al. 2021, ApJ, 908, 19, doi: 10.3847/1538-4357/abd24d
-
[11]
Bolatto, A. D., Wolfire, M., & Leroy, A. K. 2013, ARA&A, 51, 207, doi: 10.1146/annurev-astro-082812-140944
-
[12]
Braatz, J. A., Wilson, A. S., & Henkel, C. 1996, ApJS, 106, 51, doi: 10.1086/192328
-
[13]
2024,, 2.0.2 Zenodo, doi: 10.5281/zenodo.13989456
Bradley, L., Sip˝ocz, B., Robitaille, T., et al. 2024,, 2.0.2 Zenodo, doi: 10.5281/zenodo.13989456
-
[14]
2002, A&A, 383, 104, doi: 10.1051/0004-6361:20011714
Capetti, A., Celotti, A., Chiaberge, M., et al. 2002, A&A, 383, 104, doi: 10.1051/0004-6361:20011714
-
[15]
Capetti, A., Trussoni, E., Celotti, A., Feretti, L., & Chiaberge, M. 2000, Monthly Notices of the Royal Astronomical Society, 318, 493, doi: 10.1046/j.1365-8711.2000.03823.x 22 H. N. Ngo et al
arXiv 2000
-
[16]
2002, MNRAS, 333, 400, doi: 10.1046/j.1365-8711.2002.05412.x
Cappellari, M. 2002, MNRAS, 333, 400, doi: 10.1046/j.1365-8711.2002.05412.x
arXiv 2002
-
[17]
2008, MNRAS, 390, 71, doi: 10.1111/j.1365-2966.2008.13754.x
Cappellari, M. 2008, MNRAS, 390, 71, doi: 10.1111/j.1365-2966.2008.13754.x
arXiv 2008
-
[18]
2016, ARA&A, 54, 597, doi: 10.1146/annurev-astro-082214-122432
Cappellari, M. 2016, ARA&A, 54, 597, doi: 10.1146/annurev-astro-082214-122432
-
[19]
2020, MNRAS, 494, 4819, doi: 10.1093/mnras/staa959
Cappellari, M. 2020, MNRAS, 494, 4819, doi: 10.1093/mnras/staa959
-
[20]
2013, MNRAS, 432, 1709, doi: 10.1093/mnras/stt562
Cappellari, M., Scott, N., Alatalo, K., et al. 2013, MNRAS, 432, 1709, doi: 10.1093/mnras/stt562
-
[21]
Dame, T. M. 2011, arXiv e-prints, arXiv:1101.1499. https://arxiv.org/abs/1101.1499
Pith/arXiv arXiv 2011
-
[22]
Davis, T. A. 2014, MNRAS, 443, 911, doi: 10.1093/mnras/stu1163
-
[23]
A., Bureau, M., Cappellari, M., Sarzi, M., & Blitz, L
Davis, T. A., Bureau, M., Cappellari, M., Sarzi, M., & Blitz, L. 2013, Nature, 494, 328, doi: 10.1038/nature11819
-
[24]
A., Bureau, M., Onishi, K., et al
Davis, T. A., Bureau, M., Onishi, K., et al. 2017, MNRAS, 468, 4675, doi: 10.1093/mnras/stw3217
-
[25]
Davis, T. A., Nguyen, D. D., Seth, A. C., et al. 2020, MNRAS, 496, 4061, doi: 10.1093/mnras/staa1567 de Juan, L., Colina, L., & Golombek, D. 1996, A&A, 305, 776
-
[26]
Dominiak, P., Bureau, M., Davis, T. A., et al. 2024, Monthly Notices of the Royal Astronomical Society, 529, 1597, doi: 10.1093/mnras/stae314
-
[27]
Donato, D., Sambruna, R. M., & Gliozzi, M. 2004, ApJ, 617, 915, doi: 10.1086/425575
doi:10.1086/425575 2004
-
[28]
Dressler, A., & Richstone, D. O. 1988, ApJ, 324, 701, doi: 10.1086/165930
doi:10.1086/165930 1988
-
[29]
1994, A&A, 285, 723
Emsellem, E., Monnet, G., & Bacon, R. 1994, A&A, 285, 723
1994
-
[30]
2000, ApJL, 539, L9, doi: 10.1086/312838
Ferrarese, L., & Merritt, D. 2000, ApJL, 539, L9, doi: 10.1086/312838
doi:10.1086/312838 2000
-
[31]
Gao, F., Braatz, J. A., Reid, M. J., et al. 2017, ApJ, 834, 52, doi: 10.3847/1538-4357/834/1/52
-
[32]
Gonzalez-Serrano, J. I., & Perez-Fournon, I. 1992, AJ, 104, 535, doi: 10.1086/116252
-
[33]
Goulding, A. D., Greene, J. E., Ma, C.-P., et al. 2016, ApJ, 826, 167, doi: 10.3847/0004-637X/826/2/167
-
[34]
Greene, J. E. 2012, Nature Communications, 3, 1304, doi: 10.1038/ncomms2314
-
[35]
Greene, J. E., Strader, J., & Ho, L. C. 2020, ARA&A, 58, 257, doi: 10.1146/annurev-astro-032620-021835
-
[36]
2022, in American Astronomical Society Meeting
Gu, M. 2022, in American Astronomical Society Meeting
2022
-
[37]
240, American Astronomical Society Meeting #240, 123.04 G¨ ultekin, K., Richstone, D
Abstracts, Vol. 240, American Astronomical Society Meeting #240, 123.04 G¨ ultekin, K., Richstone, D. O., Gebhardt, K., et al. 2009, ApJ, 698, 198, doi: 10.1088/0004-637X/698/1/198
-
[38]
2001, Bernoulli, 7, 223 H¨aring-Neumayer, N., Cappellari, M., Rix, H
Haario, H., Saksman, E., & Tamminen, J. 2001, Bernoulli, 7, 223 H¨aring-Neumayer, N., Cappellari, M., Rix, H. W., et al. 2006, ApJ, 643, 226, doi: 10.1086/501494
-
[39]
Harris, C. R., Millman, K. J., van der Walt, S. J., et al. 2020, Nature, 585, 357, doi: 10.1038/s41586-020-2649-2 H¨ogbom, J. A. 1974, A&AS, 15, 417
-
[40]
Holtzman, J. A., Hester, J. J., Casertano, S., et al. 1995, PASP, 107, 156, doi: 10.1086/133533
doi:10.1086/133533 1995
-
[41]
Hunter, J. D. 2007, Computing In Science & Engineering, 9, 90, doi: 10.1109/MCSE.2007.55
-
[42]
2019, A&A, 625, A118, doi: 10.1051/0004-6361/201935034
Keppler, M., Teague, R., Bae, J., et al. 2019, A&A, 625, A118, doi: 10.1051/0004-6361/201935034
-
[43]
2001, in American Institute of Physics Conference Series, Vol
Kormendy, J., & Gebhardt, K. 2001, in American Institute of Physics Conference Series, Vol. 586, 20th Texas Symposium on relativistic astrophysics, ed. J. C. Wheeler & H. Martel, 363–381, doi: 10.1063/1.1419581
-
[44]
Kormendy, J., & Ho, L. C. 2013, ARA&A, 51, 511, doi: 10.1146/annurev-astro-082708-101811 Krajnovi´c, D., Cappellari, M., & McDermid, R. M. 2018, MNRAS, 473, 5237, doi: 10.1093/mnras/stx2704
-
[45]
E., Hook, R
Krist, J. E., Hook, R. N., & Stoehr, F. 2011, in Society of Photo-Optical Instrumentation Engineers (SPIE) Conference
2011
-
[46]
8127, Optical Modeling and Performance Predictions V, ed
Series, Vol. 8127, Optical Modeling and Performance Predictions V, ed. M. A. Kahan, 81270J, doi: 10.1117/12.892762
-
[47]
Lauer, T. R., Faber, S. M., Richstone, D., et al. 2007, ApJ, 662, 808, doi: 10.1086/518223
doi:10.1086/518223 2007
-
[48]
Ma, C.-P., Greene, J. E., McConnell, N., et al. 2014, ApJ, 795, 158, doi: 10.1088/0004-637X/795/2/158
-
[49]
1998, AJ, 115, 2285, doi: 10.1086/300353
Magorrian, J., Tremaine, S., Richstone, D., et al. 1998, AJ, 115, 2285, doi: 10.1086/300353
doi:10.1086/300353 1998
-
[50]
P., Waters, B., Schiebel, D., Young, W., & Golap, K
McMullin, J. P., Waters, B., Schiebel, D., Young, W., & Golap, K. 2007, in Astronomical Society of the Pacific Conference Series, Vol. 376, Astronomical Data Analysis Software and Systems XVI, ed. R. A. Shaw, F. Hill, & D. J. Bell, 127
2007
-
[51]
2009, A&A, 497, 359, doi: 10.1051/0004-6361/200810801
Memola, E., Trinchieri, G., Wolter, A., Focardi, P., & Kelm, B. 2009, A&A, 497, 359, doi: 10.1051/0004-6361/200810801
-
[52]
Mitzkus, M., Cappellari, M., & Walcher, C. J. 2017, MNRAS, 464, 4789, doi: 10.1093/mnras/stw2677
-
[53]
1995, Nature, 373, 127, doi: 10.1038/373127a0
Miyoshi, M., Moran, J., Herrnstein, J., et al. 1995, Nature, 373, 127, doi: 10.1038/373127a0
doi:10.1038/373127a0 1995
-
[54]
Morganti, R., Fanti, C., Fanti, R., Parma, P., & de Ruiter, H. R. 1987, A&A, 183, 203
1987
-
[55]
Nguyen, D. D. 2017, arXiv e-prints, arXiv:1712.02470, doi: 10.48550/arXiv.1712.02470
-
[56]
Nguyen, D. D. 2019, in ALMA2019: Science Results and Cross-Facility Synergies, 106, doi: 10.5281/zenodo.3585410
-
[57]
D., Cappellari, M., & Pereira-Santaella, M
Nguyen, D. D., Cappellari, M., & Pereira-Santaella, M. 2023, MNRAS, 526, 3548, doi: 10.1093/mnras/stad2860
-
[58]
Nguyen, D. D., Seth, A. C., Reines, A. E., et al. 2014, ApJ, 794, 34, doi: 10.1088/0004-637X/794/1/34
-
[59]
Nguyen, D. D., Seth, A. C., den Brok, M., et al. 2017, ApJ, 836, 237, doi: 10.3847/1538-4357/aa5cb4
-
[60]
Nguyen, D. D., Seth, A. C., Neumayer, N., et al. 2018, ApJ, 858, 118, doi: 10.3847/1538-4357/aabe28 Molecular-based SMBH measurement of NGC 7052 23
-
[61]
Nguyen, D. D., Seth, A. C., Neumayer, N., et al. 2019, ApJ, 872, 104, doi: 10.3847/1538-4357/aafe7a
-
[62]
Nguyen, D. D., den Brok, M., Seth, A. C., et al. 2020, ApJ, 892, 68, doi: 10.3847/1538-4357/ab77aa
-
[63]
D., Izumi, T., Thater, S., et al
Nguyen, D. D., Izumi, T., Thater, S., et al. 2021, MNRAS, 504, 4123, doi: 10.1093/mnras/stab1002
-
[64]
D., Bureau, M., Thater, S., et al
Nguyen, D. D., Bureau, M., Thater, S., et al. 2022, MNRAS, 509, 2920, doi: 10.1093/mnras/stab3016
-
[65]
Nguyen, D. D., Ngo, H. N., Le, T. Q. T., et al. 2025a, A&A, 698, L9, doi: 10.1051/0004-6361/202554672
-
[66]
Nguyen, D. D., Cappellari, M., Ngo, H. N., et al. 2025b, AJ, 170, 124, doi: 10.3847/1538-3881/ade9ba
-
[67]
1991, A&A, 244, L37
Nieto, J.-L., Bender, R., & Surma, P. 1991, A&A, 244, L37
1991
-
[68]
L., McClure, R., Fletcher, J
Nieto, J. L., McClure, R., Fletcher, J. M., et al. 1990, A&A, 235, L17
1990
-
[69]
North, E. V., Davis, T. A., Bureau, M., et al. 2019, MNRAS, 490, 319, doi: 10.1093/mnras/stz2598
-
[70]
Onishi, K., Iguchi, S., Davis, T. A., et al. 2017, MNRAS, 468, 4663, doi: 10.1093/mnras/stx631
-
[71]
Pandya, V., Greene, J. E., Ma, C.-P., et al. 2017, ApJ, 837, 40, doi: 10.3847/1538-4357/aa5ebc
-
[72]
R., Fanti, C., & Fanti, R
Parma, P., de Ruiter, H. R., Fanti, C., & Fanti, R. 1986, A&AS, 64, 135
1986
-
[73]
Rau, U., & Cornwell, T. J. 2011, A&A, 532, A71, doi: 10.1051/0004-6361/201117104
-
[74]
Ruffa, I., Davis, T. A., Cappellari, M., et al. 2023, MNRAS, 522, 6170, doi: 10.1093/mnras/stad1119
-
[75]
Rusli, S. P., Erwin, P., Saglia, R. P., et al. 2013, The Astronomical Journal, 146, 160, doi: 10.1088/0004-6256/146/6/160
-
[76]
P., Opitsch, M., Erwin, P., et al
Saglia, R. P., Opitsch, M., Erwin, P., et al. 2016, ApJ, 818, 47, doi: 10.3847/0004-637X/818/1/47
-
[77]
Sahu, N., Graham, A. W., & Davis, B. L. 2019, ApJ, 876, 155, doi: 10.3847/1538-4357/ab0f32
-
[78]
Smith, M. D., Bureau, M., Davis, T. A., et al. 2019, MNRAS, 485, 4359, doi: 10.1093/mnras/stz625
-
[79]
Smith, M. D., Bureau, M., Davis, T. A., et al. 2021, MNRAS, 503, 5984, doi: 10.1093/mnras/stab791
-
[80]
Terrazas, B. A., Bell, E. F., Woo, J., & Henriques, B. M. B. 2017, ApJ, 844, 170, doi: 10.3847/1538-4357/aa7d07
This paper was first reviewed by deepseek-v4-flash on August 5, 2026.
discussion (0)
Sign in with ORCID, Apple, or X to comment. Anyone can read and Pith papers without signing in.