REVIEW 4 major objections 5 minor 43 references
ALBATROSS: Cheap Filtration Based Geometry via Stochastic Sub-Sampling
T0 review · 4 major / 5 minor · reviewed 2026-08-05 · deepseek-v4-flash
Pith's one-line read The paper's central claim is that stochastic sub-sampling makes topological data analysis (TDA) cheap enough to map the human cortex's functional geometry, and the resulting map is mostly hyperbolic.
desk verdict Real memory win; circular geometry testing. read the letter →
The pith
A machine-rendered reading of the paper's core claim, the machinery that carries it, and where it could break.
The reading
What carries the argument
The object that carries the argument is the Betti curve of a filtered simplicial complex, which counts n-dimensional holes in the clique complex of a weighted adjacency matrix as the threshold varies. ALBATROSS replaces the full complex with an average over many random sub-samples of size n, a stochastic sub-sampling estimate; it then searches candidate geometries (Euclidean, hyperbolic shell or full space, or a shuffled null) by minimizing a normalized l1-plus-integrated-Betti-value objective, and converts the fit into p-values through a central-limit-theorem z-statistic with Bonferroni and Fisher corrections.
What would settle it
Split the sub-samples into two halves: use one half to select each model's parameters (minimizing normalized l1 plus integrated-Betti-value distance) and the other half to compute the reported p-values. If ALBATROSS's geometry claims are genuine, 'consistent with hyperbolic' should survive the split for most parcels and for the global matrices; if the p-values collapse, the geometry finding is an artifact of using the same data to fit and test.
Extended reading notes
Core claim
On the paper's own terms, the discovery is that ALBATROSS turns filtered-simplicial-complex TDA from a supercomputer-scale computation into a laptop-scale one, and that doing so exposes a coherent geometric organization in the human cortex: the resting-state functional connectivity of every individual studied is consistent with a hyperbolic space at the global level, and most parcels show local hyperbolic geometry. The authors are careful to frame this as statistical consistency with candidate model spaces rather than direct proof that the cortex 'is' hyperbolic. What would follow is that cortical functional organization has a negatively curved, hierarchical structure, with local topology va
Load-bearing premise
The protocol assumes that p-values obtained by comparing the empirical Betti curves to the model that was chosen to best fit those same curves are valid evidence of geometric consistency; if that post-model-selection comparison is not controlled, the reported 'consistent with hyperbolic' results are in-sample fit statistics rather than confirmatory tests.
Editorial extensions
If this is right
- TDA on matrices with hundreds of rows and columns moves from a 475 GB compute node to a 24 GB laptop, so researchers without institutional clusters can run geometry checks.
- The same protocol applies to any weighted adjacency matrix, not just neuroimaging, and the two validation datasets show it generalizes across data types.
- Because classic network-science measures are a subset of filtered-complex information, ALBATROSS also provides a route to large-scale versions of measures such as rich-club structure.
- If the cortical finding is correct, most of the brain's functional parcels sit in a negatively curved space, linking local connectivity topology to the brain's global hierarchical organization.
- Memory use stays roughly constant for a chosen sub-sample size, so the approach scales to datasets that would otherwise be untouchable.
Reading between the lines
- The candidate-geometry family is limited to Euclidean, hyperbolic, and shuffled null spaces; including spherical or product geometries could reclassify the 39 parcels currently inconsistent with all three, so the 'hyperbolic' label is relative to that family.
- Because the same data choose and then test the model, the reported p-values are likely optimistic; a held-out split of sub-samples would turn ALBATROSS into a general model-selection tool whose geometry calls are confirmatory.
- The correlation between local hyperbolic radius and global radial coordinate predicts a testable signature: interventions that shift a region's global hierarchical position should change its local Betti curves even when local signal quality is unchanged.
- Replacing the radial sampling density in the hyperbolic model with the exact hyperbolic volume element could change the best-fit radii and noise levels, though probably not the coarse geometry family.
Editorial analysis
A structured set of objections, weighed in public.
Referee Report
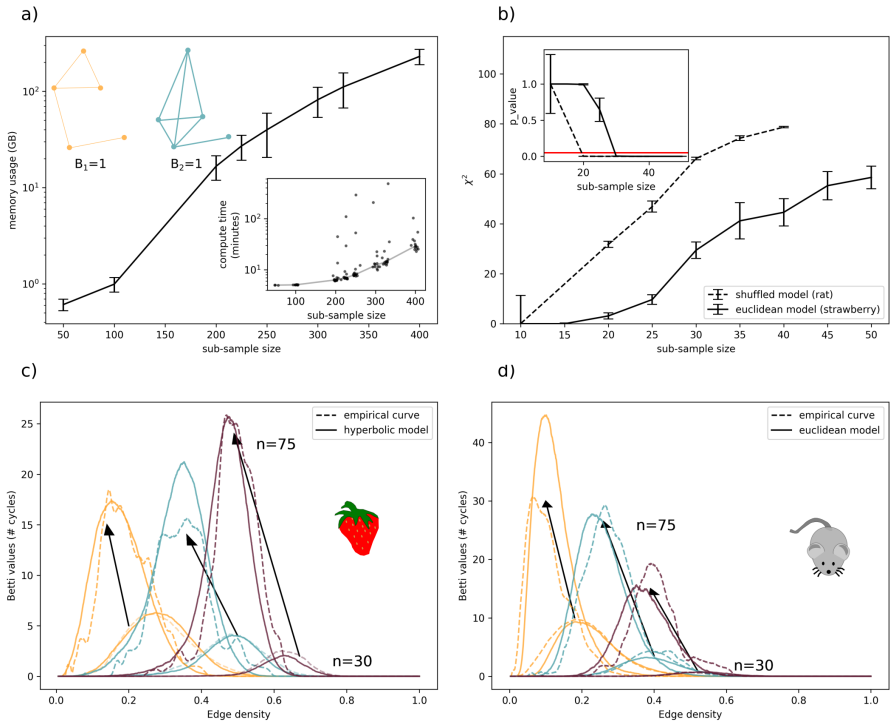
Summary. This paper introduces ALBATROSS, a protocol for computing Betti curves of filtered simplicial complexes of large adjacency matrices by stochastic sub-sampling. The protocol computes average empirical Betti curves from random subsamples, searches over Euclidean, hyperbolic, and shuffled candidate models using integrated Betti value (ibv) and L1-distance statistics, and then uses a CLT-based z-test combined by Fisher's method to produce p-values. The authors validate the approach on strawberry odor and hippocampal place-cell datasets and apply it to resting-state fMRI functional connectivity matrices from 392 cortical parcels in 10 HCP subjects, reporting that all ten global matrices and 353/392 local parcels are consistent with hyperbolic geometry, and that local hyperbolic radius correlates with the global radial coordinate (Spearman rs = 0.52).
Significance. If the statistical inference were valid, this paper would make a useful practical contribution: the memory benchmarks (e.g., roughly 71 GB for a direct n=300 computation versus 1.5 GB for ALBATROSS with n=30 on a laptop) and the public code would substantially lower the barrier to TDA on large biological datasets. The HCP application is also novel in scale. However, the statistical engine of the paper is not valid as implemented: the hypothesis tests use the same statistics that were minimized during model selection, and the CLT variance is mis-scaled. The headline geometric conclusions are therefore unsupported, and the central claim that ALBATROSS provides valid statistical geometry inference is not established.
major comments (4)
- [Online Methods, Eqs. 10–12 and Eqs. 4–5] Circular model selection and testing. The best-fit model is chosen by minimizing the objective Σ_{k=1}^3 (l1^k + ibv^k) in Eq. 12, where l1^k and ibv^k are exactly the normalized L1-distance and integrated Betti value statistics defined in Eqs. 10–11. The subsequent hypothesis test in Eqs. 4–5 evaluates the same empirical Betti curves against that selected model using the same L1 and ibv statistics. No split-sample, hold-out, or post-selection adjustment is provided. Consequently, the observed statistics are minimizers of the same functional used to build the null distribution, and the p-values in Supplementary Table 5 and the 'consistent with hyperbolic' statements in Figure 3 are in-sample fit statistics rather than valid hypothesis tests. The same issue affects the strawberry and hippocampal validation results.
- [Online Methods, Eq. 3] Incorrect CLT variance scaling. For a mean of r independent resamplings, the variance of the mean is Var(β_r)/r, not Var(β_r)·r. As written, Eq. 3 inflates the variance by a factor of r^2 relative to the correct expression and deflates every Z statistic in Eq. 4 by a factor of r. For r=100, this is a two-order-of-magnitude change in the test statistic, so all reported p-values would change after correction.
- [Online Methods, Eq. 7] Hyperbolic radial density and unspecified dimension. The radial density p(r) ∼ sinh((d−1)r) is not the radial marginal of the uniform measure in d-dimensional hyperbolic space; the correct density is proportional to sinh^{d−1}(r). For d>2, the simulated 'hyperbolic' model is a different, non-uniform ensemble, so consistency with that model does not directly imply consistency with hyperbolic geometry. The manuscript applies 3-D hyperbolic MDS but does not report the d used in the Betti-curve fits; d is absent from the Bayesian-optimization parameter list and from Supplementary Tables 3–5. The sampler should be corrected or the model explicitly re-described as a non-uniform radial model.
- [Online Methods, Statistical Inference] The 'shuffled' candidate space is mentioned repeatedly in the main text, Figure 3, and Supplementary Table 5, but the manuscript never specifies how the shuffled adjacency matrices are generated. Without this definition, the claim that zero parcels are consistent with the a-geometric shuffled model is not reproducible or interpretable.
minor comments (5)
- [Online Methods, Eq. 8] The denominator in the cosine formula reads ||xi||||xi||; it should be ||xi|| ||xj||.
- [Figure 3 and main text] Figure 3a states that all parcels had topology consistent with a hyperbolic shell, but the main text says 353 of 392 regions are consistent and 39 are inconsistent with any candidate space. This contradiction needs to be resolved.
- [Supplementary Table 3] The listed n values contain duplicates and omissions: n ∈ [10,15,20,25,40,45,50,45,50,55] should be cleaned. Also, the table reports only rmax and rmin; the best-fit d and noise level ε are described as varying but are not tabulated, which hampers reproducibility.
- [Main text and Online Methods] There are repeated typos: 'stoachstic' (main text), 'itegrated' (Online Methods), and 'the first n Betti numbers' should be 'the first three Betti numbers' in context.
- [Supplementary Table 5] p-values are printed as 0.0. After Bonferroni correction and Fisher's method, p-values cannot be exactly zero; they should be reported with inequalities such as p < 1e-10.
Circularity Check
P-values supporting hyperbolic-geometry claims are computed after model selection on the same l1/ibv statistics, making them in-sample fit statistics rather than valid tests.
-
fitted input called prediction
[Online Methods, 'Statistical Inference' (Eqs 3-5) vs. 'Grid search for best fit euclidean geometry' and 'Bayesian optimization for best fit hyperbolic geometry' (Eqs 10-12)]
"Finally, the grid point with the smallest combined metric,P3 k=1 l1k + ibvk, is chosen as the best fit model. ... Our objective function is defined as: argmax(ε,rmin,rmax)obj = − 3X k=1 lk 1 + ibvk (12) ... These Z statistics are computed for the L1-distance between empirical and best fit geometric Betti curves and for the area under the Betti curves (11)."
The normalized l1 and ibv discrepancies in Eqs 10-11 are the terms of the model-selection objective (Eq 12: minimized by grid search for Euclidean models; the negative sum is maximized by Bayesian optimization for hyperbolic models). The same 'L1-distance between empirical and best fit geometric Betti curves and ... area under the Betti curves' define the Z statistics in Eq 4, whose null distribution is obtained by re-sampling from the selected best-fit model (Eq 3). Thus the empirical test statistic is the minimum of the objective used to pick the model: it is a selection-minimized in-sample quantity, not a draw from the null distribution. Consequently the p-values (Bonferroni-corrected, Fisher-combined in Eq 5) and the resulting 'consistent with Hyperbolic geometry' classifications (Figu
full rationale
The central circularity is selective inference: model parameters are chosen by minimizing the exact l1 and ibv discrepancies that are then used as test statistics against a null derived from the chosen model, with no split-sample or post-selection adjustment. The p-values in Figure 3 and Supplementary Table 5 are therefore in-sample fit statistics, undermining the load-bearing geometric conclusions for the cortex. However, the paper is not wholly circular: the memory-reduction engineering claim is benchmarked independently, and ALBATROSS reproduces earlier full-data conclusions for strawberry odors and hippocampal place cells, providing external support for the pipeline's ability to recover known geometry. These independent elements keep the score below 8. Separately, Eq 7's radial density p(r) ~ sinh((d-1)*r) is not the standard hyperbolic volume element; that is a modeling/correctness concern distinct from circularity and is not counted in the score.
Assumptions & free parameters
free parameters (8)
- subsample_size_n =
n=35 for HCP; n in [10,55] in validation
- iterations_I =
I=150 for HCP; 100 to 1000 in validation
- euclidean_dimension_d =
Grid searched over d in [1,100]; e.g., 12-64 for place cells
- euclidean_noise_epsilon =
Grid searched over [0.0,0.15]; low values for place cells
- hyperbolic_rmax =
Selected by BO over [1e-6,1]; e.g., rmax=5 for strawberry
- hyperbolic_rmin =
Selected by BO over [1e-6,0.99]; e.g., 0.9 for strawberry, 0.0 for place cells
- hyperbolic_noise_epsilon =
Selected by BO over [1e-6,1]; varies considerably with n and I
- hyperbolic_dimension_d =
Fixed; 3 for the cortex analysis, not searched
assumptions (6)
- domain assumption Stochastic subsampling of an adjacency matrix yields Betti curves representative of the full matrix
- standard math The central limit theorem applies to Betti-curve measures across independent subsample iterations
- standard math Fisher's method is valid for the six combined p-values
- domain assumption The shuffled adjacency matrix is a valid a-geometric null model
- ad hoc to paper Uniform sampling of the hyperbolic shell uses radial density p(r) ~ sinh((d-1)r)
- ad hoc to paper Best-fit model parameters need not be held out before goodness-of-fit testing
invented entities (1)
-
No new physical or mathematical entities introduced
Cite this review
Pith. "Pith review of ALBATROSS: Cheap Filtration Based Geometry via Stochastic Sub-Sampling." pith.science (2026). https://pith.science/paper/SCTKAQDK
@misc{pith2026250903681,
  author       = {Pith},
  title        = {Pith review of: ALBATROSS: Cheap Filtration Based Geometry via Stochastic Sub-Sampling},
  year         = {2026},
  howpublished = {\url{https://pith.science/paper/SCTKAQDK}},
  note         = {Machine review of arXiv:2509.03681}
}
read the original abstract
Topological data analysis (TDA) detects geometric structure in biological data. However, many TDA algorithms are memory intensive and impractical for massive datasets. Here, we introduce a statistical protocol that reduces TDA's memory requirements and gives access to scientists with modest computing resources. We validate this protocol against two empirical datasets, showing that it replicates previous findings with much lower memory requirements. Finally, we demonstrate the power of the protocol by mapping the topology of functional correlations for the human cortex at high spatial resolution, something that was previously infeasible without this novel approach.
Figures


Reference graph
Works this paper leans on
-
[1]
A. E. Sizemore, J. E. Phillips-Cremins, R. Ghrist, D. S. Bassett, Network Neuroscience 3, 656 (2019)
work page 2019
-
[2]
Wasserman, Annual review of statistics and its application 5, 501 (2018)
L. Wasserman, Annual review of statistics and its application 5, 501 (2018)
work page 2018
-
[3]
J. M. Shine, et al., Nature neuroscience 22, 289 (2019)
work page 2019
- [4]
-
[5]
A. K. Suresh, et al., elife 9, e58848 (2020)
work page 2020
- [6]
-
[7]
Mead, Journal of the Royal Statistical Society: Series D (The Statistician) 41, 27 (1992)
A. Mead, Journal of the Royal Statistical Society: Series D (The Statistician) 41, 27 (1992)
work page 1992
- [8]
Show all 43 references
-
[9]
Giusti, Algebraic topology and neuroscience: A bibliography (2018)
C. Giusti, Algebraic topology and neuroscience: A bibliography (2018). 11
2018
-
[10]
Giusti, E
C. Giusti, E. Pastalkova, C. Curto, V . Itskov, Proceedings of the National Academy of Sci- ences 112, 13455 (2015)
2015
-
[11]
Y . Zhou, B. H. Smith, T. O. Sharpee,Science advances 4, eaaq1458 (2018)
2018
-
[12]
Y . Zhou, T. O. Sharpee,Iscience 24, 102225 (2021)
2021
-
[13]
Singh, et al., Journal of Vision 8, 11 (2008)
G. Singh, et al., Journal of Vision 8, 11 (2008)
2008
-
[14]
R. K. Luneburg (1947)
1947
-
[15]
Indow, The global structure of visual space , vol
T. Indow, The global structure of visual space , vol. 1 (World Scientific, 2004)
2004
-
[16]
Bauer, Journal of Applied and Computational Topology 5, 391 (2021)
U. Bauer, Journal of Applied and Computational Topology 5, 391 (2021)
2021
-
[18]
Curto, Bulletin of the American Mathematical Society 54, 63 (2017)
C. Curto, Bulletin of the American Mathematical Society 54, 63 (2017)
2017
-
[19]
Giusti, R
C. Giusti, R. Ghrist, D. S. Bassett, Journal of Computational Neuroscience 41, 1 (2016)
2016
-
[20]
D. S. Bassett, O. Sporns, Nature neuroscience 20, 353 (2017)
2017
-
[21]
Sporns, Networks of the Brain (MIT press, 2010)
O. Sporns, Networks of the Brain (MIT press, 2010)
2010
-
[22]
Bendich, J
P. Bendich, J. S. Marron, E. Miller, A. Pieloch, S. Skwerer,The Annals of Applied Statistics 10 (2016)
2016
-
[23]
N. O. Malott, A. M. Sens, P. A. Wilsey, 2020 IEEE International Conference on Big Data (Big Data) (IEEE, 2020), pp. 2681–2690
2020
- [24]
-
[25]
M. A. Koyama, V . Robins, K. Turner,arXiv preprint arXiv:2412.07805 (2024). 12
2024 arXiv
-
[26]
M. A. Koyama, F. Memoli, V . Robins, K. Turner,arXiv preprint arXiv:2307.16333 (2023)
2023 arXiv
-
[27]
Zhang, P
H. Zhang, P. D. Rich, A. K. Lee, T. O. Sharpee, Nature Neuroscience 26, 131 (2023)
2023
-
[28]
Bubenik, M
P. Bubenik, M. Hull, D. Patel, B. Whittle, Inverse Problems 36, 025008 (2020)
2020
-
[29]
R. C. Craddock, G. A. James, P. E. Holtzheimer III, X. P. Hu, H. S. Mayberg,Human brain mapping 33, 1914 (2012)
1914
-
[30]
Jiang, T
X. Jiang, T. Zhang, S. Zhang, K. M. Kendrick, T. Liu, Psychoradiology 1, 23 (2021)
2021
- [31]
-
[32]
R. W. Ghrist, Elementary applied topology, vol. 1 (Createspace Seattle, 2014)
2014
-
[33]
Ghrist, Bulletin of the American Mathematical Society 45, 61 (2008)
R. Ghrist, Bulletin of the American Mathematical Society 45, 61 (2008)
2008
-
[34]
C. R. Harris, et al., Nature 585, 357 (2020)
2020
-
[35]
Sedgwick, Bmj 344 (2012)
P. Sedgwick, Bmj 344 (2012)
2012
-
[36]
R. A. Fisher, Breakthroughs in statistics (Springer, 1992), pp. 66–70
1992
-
[37]
P. I. Frazier, arXiv preprint arXiv:1807.02811 (2018)
2018 arXiv
-
[38]
C. K. Williams, C. E. Rasmussen, Gaussian processes for machine learning , vol. 2 (MIT press Cambridge, MA, 2006)
2006
-
[39]
Balandat, et al., Advances in neural information processing systems 33, 21524 (2020)
M. Balandat, et al., Advances in neural information processing systems 33, 21524 (2020)
2020
-
[40]
Praturu, T
A. Praturu, T. O. Sharpee, Iscience 27 (2024)
2024
-
[41]
M. L. Schwieterman, et al., PloS one 9, e88446 (2014). 13
2014
-
[42]
Y . Wang, S. Romani, B. Lustig, A. Leonardo, E. Pastalkova, Nature neuroscience 18, 282 (2015)
2015
-
[43]
Pastalkova, V
E. Pastalkova, V . Itskov, A. Amarasingham, G. Buzs´aki, Science 321, 1322 (2008)
2008
-
[44]
M. F. Glasser, et al., Neuroimage 80, 105 (2013). Acknowledgments The authors thank Tatyana Sharpee for sharing code and helping to replicate the sampling of points from candidate hyperbolic spaces and Salar Fattahi for helpful discussions around Bayesian optimization. Concept...
2013
Reviewed August 5, 2026 · model on record in the stance chip above.
Discussion (0). Continue with ORCID to comment.