REVIEW 4 major objections 5 minor 2 references
Using Deep Learning to Identify Artificial Satellite Trails in Multi-band Photometric Astronomical Images
T0 review · 4 major / 5 minor · reviewed 2026-08-05 · deepseek-v4-flash
Pith's one-line read ASA-U-Net — U-Net plus atrous spatial pyramid pooling, channel attention, and residual connections — segments satellite trails in real survey images better than plain U-Net, gaining 7.7 IoU points on the faintest channel.
desk verdict Useful dataset, overclaimed results: the paper's own tables contradict the FP/FN reduction claim. read the letter →
The pith
A machine-rendered reading of the paper's core claim, the machinery that carries it, and where it could break.
The reading
What carries the argument
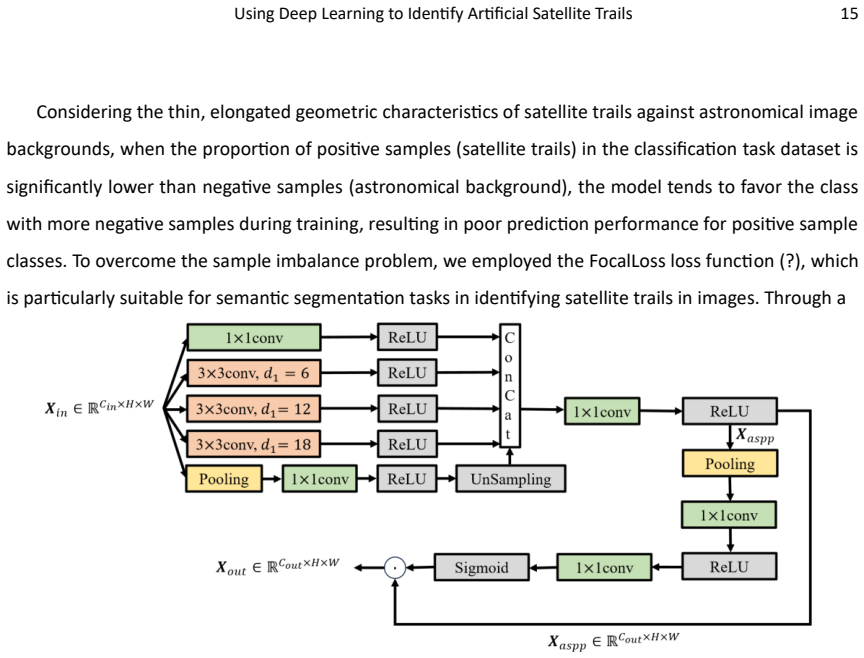
Two modules carry the argument. The Satellite-Aware Convolutional Network (SACN) block replaces U-Net's double convolution: a residual two-3×3-convolution path added to the input, followed by channel attention — global average pooling per channel, a 1×1 convolution squeeze (reduction ratio 16), ReLU, a 1×1 convolution, sigmoid — rescaling each channel toward trail features and away from background. The CA-ASPP module at the bottleneck runs five parallel branches: a 1×1 convolution, three atrous 3×3 convolutions (dilation rates 6, 12, 18), and a global-pooling branch; outputs are concatenated, fused by a 1×1 convolution, and reweighted by the same attention, so one layer covers both broad bri
What would settle it
Re-run the same train/test protocol with several random seeds or a k-fold split: if the IoU gap over U-Net on the red and yellow channels (1.94 and 0.51 points) does not exceed the seed-to-seed spread, the claimed superiority is not established. Independently, inject synthetic trails of known flux, width, and position into clean Mephisto frames, retrain both models, and compare masks against the known ground truth — this separates model skill from annotation error and tests whether the 8-bit PNG conversion or human labeling, rather than the architecture, is the true limiter on faint trails.
Extended reading notes
Core claim
The paper's central claim: three additions to U-Net — a residual block with channel attention, and a five-branch atrous spatial pyramid pooling (ASPP) bottleneck with attention — let the network keep, reweight, and fuse features ordinary downsampling discards, most visibly where trails are faintest. On the blue-channel dataset, IoU rises from 68.53% to 76.23% and recall from 73.96% to 89.09% versus the U-Net baseline; red and yellow channels gain 1.94 and 0.51 IoU points. The blue-channel ablation shows each module helping alone (ASPP +5.94 IoU, attention block +4.05) and most together, with recall reported to climb a further 9.18 points once both are present. The author's reading: ASA-U-Net
Load-bearing premise
The reported advantage over plain U-Net rests on a single training/test split with no repeated runs or uncertainty estimates, so the gains — especially the small ones on the red and yellow channels — could fall within run-to-run variance; and the hand-drawn pixel labels used as ground truth cap every reported metric at the accuracy of human annotation.
Editorial extensions
If this is right
- The same model, with one fixed training recipe, can be dropped into the Mephisto data-processing pipeline to mark or mask satellite trails on nightly images without hand-tuning parameters per frame.
- The largest measured gains are on the u/v blue-channel data, where trails are faintest and photometric contamination is most damaging, so the method's practical value lands where traditional line detectors fail most often.
- Pixel-level masks rather than line detections mean the model both finds trails and localizes them, letting downstream photometry reject or replace exactly the contaminated pixels.
- The three-channel coverage (fringing, dense stellar fields, faint trails) is a direct test of robustness: the same architecture stays on top across all three regimes in the reported metrics.
- Because the model is trained on real rather than simulated trails, it captures genuine trail morphologies (saturation, curvature across the field, varying brightness along the streak) that synthetic training sets might miss.
Reading between the lines
- A natural extension the paper does not run: multi-seed or k-fold retraining so the reported IoU gaps carry error bars, which would harden the comparison against run-to-run variance.
- The same thin-line, low-positive-fraction pattern applies to cosmic-ray hits, meteor streaks, and asteroid trails; if ASA-U-Net's machinery generalizes, retraining on those labels should show similar gains on the faintest frames.
- The conversion from FITS to 8-bit PNG silently discards dynamic range; training on the full bit depth of the original frames could plausibly push faint-trail recall even higher than the reported 89.09%.
- Since the annotation ceiling is human labeling, injecting synthetic trails of known flux into clean frames would separate true segmentation quality from label noise and put an upper bound on all reported metrics.
Editorial analysis
A structured set of objections, weighed in public.
Referee Report
Summary. The paper proposes ASA-U-Net, a U-Net variant augmented with residual connections, channel attention, and an atrous spatial pyramid pooling (ASPP) module with channel attention, for pixel-level segmentation of artificial satellite trails in multi-band astronomical images from the Mephisto telescope. The authors construct a labeled dataset by manually annotating satellite trails in 512x512 image patches from 172 FITS files across three channels (red, yellow, blue). They train the model separately per channel and report comparisons against a plain U-Net baseline plus ablation studies. The central claim is that ASA-U-Net reduces both false positives and false negatives relative to U-Net and outperforms traditional detection methods.
Significance. If validated, ASA-U-Net would provide a practical deep-learning tool for masking satellite trails in survey images, a timely problem given the growth of LEO constellations. The paper's strengths are the use of real telescope data with challenging characteristics (fringing, dense stellar fields, faint trails), manual ground-truth annotation, and an ablation design that isolates the contributions of the proposed modules. However, the evaluation is thin: results come from a single train/test split with no error bars or statistical tests, and no quantitative comparison against traditional methods is provided despite the abstract's claim. More seriously, the highlighted claim of simultaneous false-positive and false-negative reductions is contradicted by the paper's own tables. These issues prevent the results from being accepted as they stand.
major comments (4)
- [§4.1, Tables 1-3] The claim that 'ASA-U-Net demonstrates a significant reduction in both false positives and false negatives relative to the original U-Net' is not supported by the reported metrics. Using Precision and Recall on a fixed test set, FP/P = Recall*(1-Precision)/Precision and FN/P = 1 - Recall. For the red channel, FP/P rises from ~5.9% (U-Net) to ~6.3% (ASA-U-Net); for the blue channel, FP/P rises from ~12.1% to ~13.4%. For the yellow channel, Recall falls (92.21→91.71), so FN/P increases. Thus in no channel do both error types decrease. The per-channel FP/FN characterization must be revised or the claim removed.
- [Abstract and §4.2] The abstract and Section 4.2 claim superiority 'compared to traditional methods' and state that ASA-U-Net 'does not require line detection algorithms such as Hough.' Yet no quantitative comparison is made against Hough transform, Radon transform, SExtractor, matched filtering, or any other non-deep-learning detector. The only baseline is plain U-Net. To support the abstract, either add such comparisons or temper the claim to 'compared with the U-Net baseline.'
- [§4.2, Tables 1-3] The reported improvements are not accompanied by error bars, repeated runs, or statistical significance tests. For example, yellow-channel IoU improves by only 0.51% (85.99→86.50), and red-channel precision actually decreases (93.74→93.52). Without multiple training runs or confidence intervals, it is unclear whether the ASA-U-Net gains are reproducible or within run-to-run variance. This is load-bearing because the central claim is superiority of ASA-U-Net.
- [§2.2 and §4.2] The dataset description is incomplete for reproducibility. While 172 FITS files are mentioned, the number of 512x512 patches per channel, the train/validation/test partition sizes, and how patches were selected are not stated. This makes it impossible to interpret the metric differences or to reproduce the evaluation. Please provide these details, ideally along with the dataset/code availability link referenced only as 'The catalog is available online.'
minor comments (5)
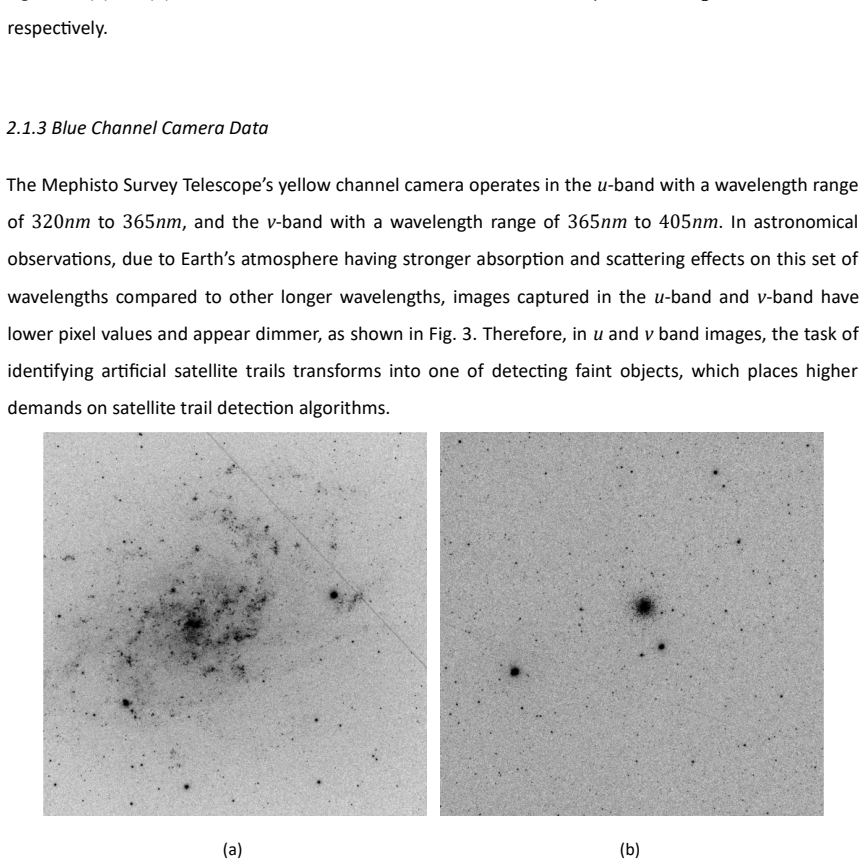
- [§2.1.3] The blue channel camera is described as operating in the u/v bands, but the text says 'yellow channel camera operates in the u-band' — this should be 'blue channel camera.'
- [§3.2] The Focal Loss function is cited with '(?)' and no reference. Give a proper citation (e.g., Lin et al. 2017, Focal Loss for Dense Object Detection).
- [§1, §2] Several cross-references are broken: 'Section ??' appears in the introduction, and Figure references (e.g., 'Fig. 1') are fine but the organization paragraph should be updated. Also, the phrase 'The catalog is available online' lacks a URL.
- [Fig. 12, Fig. 13] The figure captions contain stray '(a)' labels above the image panels; clean the layout so each subfigure is clearly labeled.
- [§3.1.2, Eq. (4)] Equation (4) is rendered incompletely: the concatenation notation is split across lines and the 'Upsample' branch is not fully defined. Clarify the dimensions and the global context branch.
Circularity Check
No significant circularity: ASA-U-Net is trained on labeled data and evaluated on a held-out test set; no prediction reduces to a fit or self-citation chain.
full rationale
The paper's central claim is an empirical segmentation-performance comparison: ASA-U-Net is trained on manually labeled Mephisto images and evaluated on held-out test images (Section 4, Tables 1-3). There is no step in which a fitted parameter is renamed as a prediction, no quantity is defined in terms of another quantity it is supposed to predict, and no uniqueness or modeling assumption is imported from the authors' prior work. The dataset construction and manual labelme annotations are standard ground-truth generation, not an input that forces the reported metric gaps. The references to U-Net, ASPP, channel attention, and FocalLoss are standard external methods, not load-bearing self-citations. The skeptic observation that Section 4.1's 'significant reduction in both false positives and false negatives' is not supported by Tables 1-3 (FP rises on red and blue, FN rises on yellow) is an internal-consistency/correctness concern, not a circularity concern. Similarly, the absence of error bars and the unspecified FocalLoss parameters are reproducibility and reporting limitations, not circular reasoning. No circular step can be identified from the paper's own equations or citations.
Assumptions & free parameters
free parameters (6)
- reduction ratio r =
16
- dilation rates (r1,r2,r3) =
6, 12, 18
- initial learning rate =
0.0001
- weight decay =
0.01
- FocalLoss alpha/gamma
- training epochs =
100
assumptions (5)
- domain assumption Manual labelme annotations accurately identify all satellite trail pixels used as ground truth.
- domain assumption Conversion from FITS to 8-bit PNG preserves the satellite trail signal, including faint u/v band trails.
- domain assumption The selected images and patches are representative of Mephisto survey data.
- domain assumption A single train/validation/test split yields stable metric estimates.
- standard math Focal Loss improves learning under class imbalance as described in the cited (missing) reference.
Cite this review
Pith. "Pith review of Using Deep Learning to Identify Artificial Satellite Trails in Multi-band Photometric Astronomical Images." pith.science (2026). https://pith.science/paper/ALXDH353
@misc{pith2026250904081,
  author       = {Pith},
  title        = {Pith review of: Using Deep Learning to Identify Artificial Satellite Trails in Multi-band Photometric Astronomical Images},
  year         = {2026},
  howpublished = {\url{https://pith.science/paper/ALXDH353}},
  note         = {Machine review of arXiv:2509.04081}
}
abstract
This research addresses the growing challenge of artificial satellite trail interference in ground-based astronomical observations by developing an efficient deep learning identification method. With the proliferation of satellite constellations in low Earth orbit, accurate detection of satellite trails has become crucial for preserving astronomical data quality. Using multi-band photometric survey observational data from the $Multi-channel$ $Photometric$ $Survey$ $Telescope$ (Mephisto) of Yunnan University , we constructed a specialized dataset of astronomical images containing satellite trails. We propose a novel ASA-U-Net model that integrates atrous spatial pyramid pooling with channel attention mechanisms into the U-Net architecture to effectively capture sparse satellite trail features that traditional semantic segmentation models often miss during downsampling. The model was implemented and validated on actual telescope data, demonstrating superior performance in end-to-end detection and marking of satellite trails compared to traditional methods. This approach significantly improves data processing precision without requiring manual parameter adjustments, making it suitable for processing massive nightly survey data and enhancing the quality of astronomical data products.
Figures


Figures from the paper (11 more)




Reference graph
Works this paper leans on
-
[1]
Andreoni I., et al., 2024, Rubin ToO 2024: Envisioning the Vera C. Rubin Observatory LSST Target of Opportunity program (arXiv:2411.04793), https://arxiv.org/abs/2411.04793 2 Bertin E., Arnouts S., 1996, aaps, 117, 393 2 Buslaev A., Iglovikov V. I., Khvedchenya E., Parinov A., Druzhinin M., Kalinin A. A., 2020, Information, 11 9 Chambers K. C., et al., 20...
arXiv 2024
-
[2]
Astronomers, Cambridge University Press 2 Hu J., Shen L., Albanie S., Sun G., Wu E., 2019, Squeeze-and-Excitation Networks (arXiv:1709.01507), https://arxiv.org/abs/1709.01507 4, 10 Kollo N., Akiyama Y ., Peethambaran J., 2023, in 2023 20th Conference on Robots and Vision (CRV). pp 256–264, doi:10.1109/CRV60082.2023.00040 3 Lecun Y ., Bottou L., Bengio Y ...
arXiv 2019
Reviewed August 5, 2026 · model on record in the stance chip above.
Discussion (0). Sign in to comment.