REVIEW 5 major objections 5 minor 1 cited by
The paper reports the first detection of quasi-periodic microstructure, sub-millisecond intensity flicker, in the interpulse emission of pulsars, and confirms that the flicker's characteristic period tracks neutron-star spin across all clas
Reviewed by Pith at T0; open to challenge. T0 means a machine referee read the full paper against a public rubric. the ladder, T0–T4 →
T0 review · deepseek-v4-flash
2026-08-05 04:44 UTC pith:VAWHFYZB
load-bearing objection First IP microstructure detection is plausible but rests on manual selection without a null test; the real value is the new observational result, not the re-fitted P_mu-P relation. the 5 major comments →
FAST Observations of the Microstructure in Interpulse Pulsars
The pith
A machine-rendered reading of the paper's core claim, the machinery that carries it, and where it could break.
Core claim
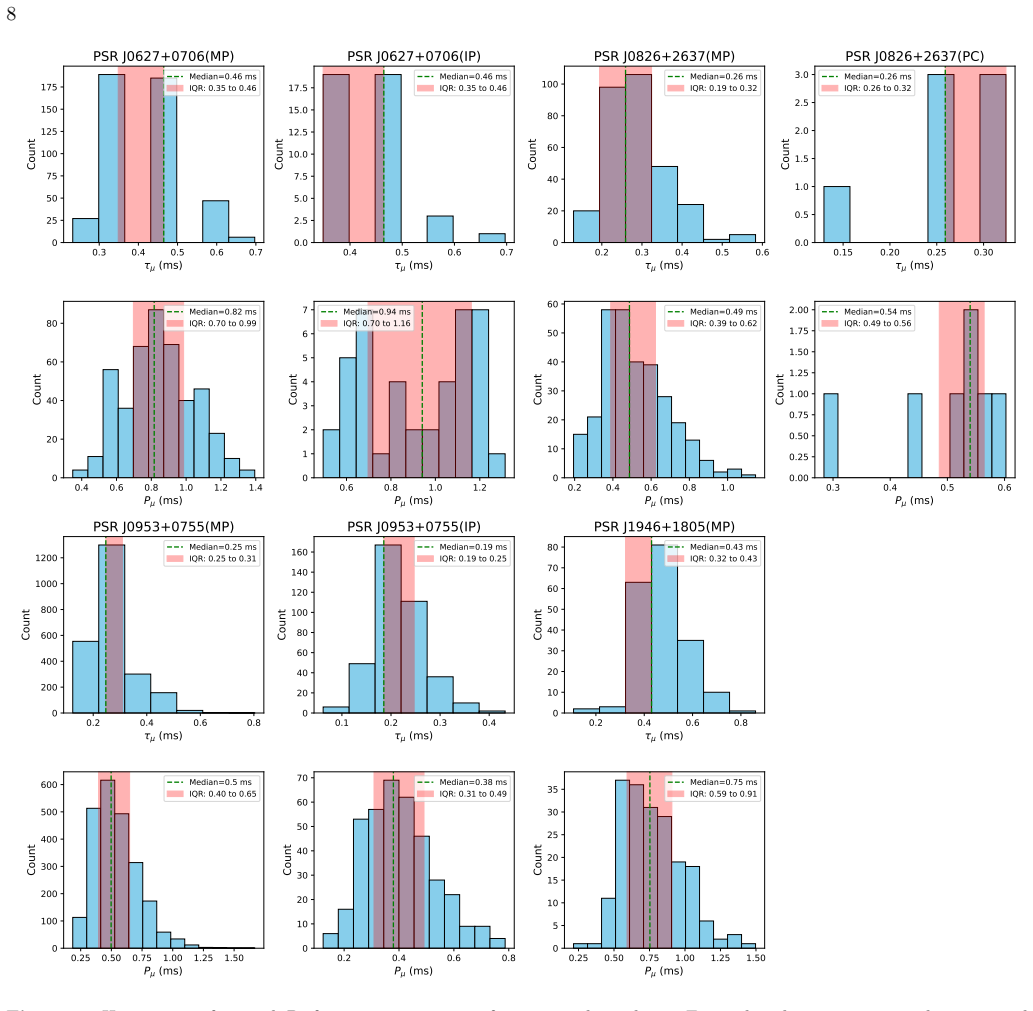
On its own terms, the discovery is that quasi-periodic microstructure is not confined to main pulses. From FAST single pulses, using autocorrelation-function (ACF) and fast-Fourier-transform (FFT) analysis of denoised pulse residuals, the authors identify sub-millisecond periodic modulation in the interpulses of PSR J0627+0706 (42 of 792 high-SNR pulses; Pµ = 0.94 ms) and PSR J0953+0755 (381 of 1021; Pµ = 0.38 ms), and in the post-cursor of PSR J0826+2637 (7 of 9 pulses, flagged as statistically insignificant). In J0627+0706 the interpulse flicker matches the main pulse within errors; in J0953+0755 it is finer. Re-fitting the population relation between Pµ and rotation period recovers Pµ(ms)
What carries the argument
The load-bearing analysis chain: (1) fold FAST single pulses, excise RFI, denoise with smoothing-spline regression, and strip low-frequency power via Nadaraya-Watson kernel smoothing at bandwidth 0.075×N_on, leaving residuals that hold only the fast flicker; (2) read the ACF's first minimum as the timescale τµ, and take the quasi-period Pµ from three estimators — ACF first minimum, FFT peak of the residual, FFT peak of the residual's ACF — reconciled by manual visual selection; (3) fit the power law Pµ = A·P^α in log space across ~40 objects spanning five decades in spin period. The fixed point of the study is the empirical P–Pµ relation, Pµ(ms) ≈ 1.34·P(s)^1.06, which the new interpulse mea
Load-bearing premise
The first-detection claim stands on the assumption that the ACF dips and FFT peaks — picked partly by eye, on as few as 7 to 42 usable interpulse pulses — really trace periodic flicker in the emission, and are not noise or residual radio interference that survived the cleaning.
What would settle it
Re-observe PSRs J0627+0706 and J0953+0755 at roughly five times finer time resolution than the current 49 µs, and require the same interpulse quasi-periodic peaks (Pµ ≈ 0.94 ms and ≈ 0.38 ms) and ACF first minima to reappear in independently cleaned residuals; if the peaks vanish or shift by more than the quoted errors, or if matching peaks appear in the ACF/FFT of pure noise processed the same way, the manual peak-picking was not seeing true interpulse microstructure.
If this is right
- Interpulse emission is no longer smooth by default: quasi-periodic sub-millisecond flicker occurs in IP components, so IP radiation is structured on the same rapid timescales as MP radiation.
- Within one pulsar, IP and MP flicker rates can differ (J0953+0755: Pµ = 0.38 ms vs 0.50 ms), giving a quantitative observable for how emission changes between the two sight-line cuts.
- The reconfirmed near-linear scaling, Pµ(ms) = (1.337±0.114)·P(s)^(1.063±0.038), across normal pulsars, MSPs, magnetars, RRATs, and long-period pulsars implies the flicker clock is set by rotation period itself, not by age or field.
- Applying that scaling to the quasi-periods measured in six FRBs predicts host spin periods from ~2 ms to ~122 s (Table 5), giving a testable handle on FRB central engines.
- For interpulse pulsars, microstructure similarity between MP and IP can flag whether the two components come from the same pole and even the same flux tube, complementing polarization-based geometry arguments.
Where Pith is reading between the lines
- If the IP–MP flicker comparison is a genuine geometric diagnostic, it can be pushed further than the paper goes: a modest survey of high-SNR interpulse pulsars could map IP/MP Pµ ratios against MP–IP longitude separation, testing whether the ratio tracks the angular distance between sampled field lines — a prediction the paper's two objects cannot decide.
- The paper's own resolution caveats (shortest τµ at 1–2× the sampling time) imply the fitted Pµ values may be upper limits; re-observations at finer time resolution could push τµ down and steepen the slope, so the near-unity exponent should be treated as provisional at the short-period end.
- The same reasoning that predicts FRB host periods can be inverted: for repeating FRBs with quasi-periodic substructure, independent evidence of periodicity (burst clustering or an identified associated source) should appear near the predicted spin period — a falsifiable link between FRB microstructure and neutron-star rotation.
- If the scaling is truly universal, the 6.45-hour coherent transient ASKAP J183950.5−075635.0 becomes a stress test: its substructure period should land near the power-law extension at P ≈ 23,000 s, which can be checked against current limits.
Editorial analysis
A structured set of objections, weighed in public.
Referee Report
Summary. The manuscript analyzes FAST single-pulse observations of four interpulse pulsars (J0627+0706, J0826+2637, J0953+0755, J1946+1805) with the goal of detecting and measuring quasi-periodic microstructure in both main pulses (MP) and interpulses (IP). The analysis pipeline follows Mitra et al. (2015): it denoises single pulses, removes low-frequency power with a kernel smoother, computes ACFs and FFTs of the residuals, and extracts the characteristic timescale tau_mu and quasi-period P_mu, with manual selection of pulses judged to show quasi-periodic behavior. The paper reports the first detection of quasi-periodic microstructure in IP emission (for J0627+0706 and J0953+0755), claims that MP and IP microstructure are consistent for J0627+0706 but that IP values are smaller for J0953+0755, and presents a refreshed P_mu-P power-law fit using literature plus four new MP measurements.
Significance. If the first-detection claim is correct, the paper fills a genuine observational gap: microstructure has been studied extensively in main pulses and in other neutron-star classes, but not in interpulse emission. The simultaneous MP-IP comparison is also a promising diagnostic for emission geometry, and the paper uses publicly released FAST data. The main weakness is that the detection pipeline relies heavily on manual selection and visual RFI rejection, and no false-alarm rate is computed. The headline conclusion therefore remains plausible but not quantitatively established. The P_mu-P relation is a useful update, although it is a confirmation rather than a new result and depends on the reliability of the new MP measurements.
major comments (5)
- [Section 3, steps 4-8; Table 3] No null test is provided for the detection of quasi-periodic microstructure. The residual extraction is effectively a high-pass filter, which can imprint oscillatory structure on white noise and produce ACF minima and FFT peaks. The reported detection rates are 42/792 = 5.3% for the J0627 IP and 381/1021 = 37% for the J0953 IP, but the reader cannot tell whether these rates exceed what the same pipeline would produce on pure noise or residual RFI. The authors should process off-pulse noise windows (or simulated noise) through the identical smoothing, residual, ACF/FFT, and manual-selection protocol and report the resulting false-alarm rate. This is load-bearing for Conclusion 1.
- [Section 3, step 7(1)] The text defines the first ACF minimum as tau_mu in step 6 and then again defines the first ACF minimum as P_mu in step 7(1). If taken literally, P_mu would equal tau_mu for every pulse, contradicting Table 3 (e.g., J0627+0706 MP: tau_mu = 0.46 ms, P_mu = 0.82 ms). The intended estimator must be specified precisely (e.g., first ACF maximum after zero, second minimum, or a harmonic relation from the FFT peak). Because P_mu enters the main conclusions and the P_mu-P fit, this ambiguity is not merely cosmetic.
- [Section 4.1.3 and Section 4.2; Figure 13; Table 3] The reported MP-IP differences for PSR J0953+0755 sit at the time-resolution limit. The paper states that the median Delta(tau_mu) = 0.06 ms equals the 49.152 microsecond bin width and median Delta(P_mu) = 0.11 ms equals twice that width. With such quantization, the observed "smaller IP" values could be a binning artifact. The authors acknowledge the resolution limit in the text, but they do not show that the distributions of Delta(tau_mu) and Delta(P_mu) are inconsistent with what would arise from a common underlying distribution after discretization. A bootstrap or simulated-bin test is needed before Conclusion 3 can be accepted.
- [Section 3, step 1; Table 2] Component boundaries are visually estimated for several pulsars and are used to define the phase windows from which single pulses are extracted. For J0953+0755 the MP/IP boundary is set by the minimum intensity after low-pass filtering, and for J0627+0706 and J1946+1805 the boundaries are "visually estimated." The IP detection results depend directly on these windows: if the IP window includes a small amount of MP or bridge emission, the residual statistics could be contaminated. The authors should test at least a few neighboring boundary choices and show that the IP detection rates and P_mu/tau_mu values are stable.
- [Section 4.2, Figures 10-13] The comparison between MP and IP (or PC) microstructure is stated qualitatively, with medians and interquartile ranges, but no statistical test is applied. For J0627+0706 the simultaneous-sample size is only 17 pulses, and for J0826+2637 the PC sample is 7 pulses; the paper itself flags the latter as not statistically significant. A two-sample test (e.g., KS or bootstrap) on the tau_mu and P_mu distributions, or at least a bootstrap confidence interval on the medians of Delta(tau_mu) and Delta(P_mu), is needed to support the claims of consistency in J0627+0706 and difference in J0953+0755.
minor comments (5)
- [Table 4; Conclusion] Table 4 lists "J1946+1905(MP)" but the pulsar is J1946+1805 throughout the rest of the paper. The conclusion also contains typos such as "mainpulse" and "exit" instead of "exist."
- [Section 3, step 7 and Figure 2] The notation is confusing: the same symbol P_mu is used for the candidate period from three methods, but the text does not explain how the three candidate values are reconciled when they differ. Also, figure axis labels read "Frequency (KHz)"; the unit should be kHz.
- [Section 3, step 1 and Figure 1] The caption of Figure 1 mentions vertical red lines in the top-right and bottom-left insets, but the figure description does not say what they mark. Table 2 gives phase ranges, but the relation between the table ranges and the inset rectangles is not always visually obvious.
- [Section 4.3, Table 4] The log-space least-squares fit appears to be unweighted, despite the data having asymmetric and heteroscedastic errors. Since some data points are duplicated (J2145-0750 and J1913+1330 appear twice) and one point (J0901-4046) is a rough estimate, a weighted fit or a bootstrap with an explicit treatment of the duplicate entries would be more robust. At minimum, the authors should state whether the shown uncertainties include the fit covariance.
- [Section 4.4] The statement that in the IP of J0953+0755 "almost all pulses exhibiting quasi-periodic microstructure are superimposed on low-frequency envelopes" is made without a count or fraction. Please provide the number of such pulses out of the 381 detected IP pulses.
Circularity Check
No significant circularity: the IP-microstructure detection and the P_mu-P fit are not derived from their own inputs; only minor, non-load-bearing self-citations occur.
full rationale
The paper's central claims are (1) first detection of quasi-periodic microstructure in interpulses, (2) a comparison of tau_mu and P_mu between MP and IP, and (3) a reconfirmation of the P_mu-P relation. None of these reduces by construction to its inputs. The detection pipeline (Section 3, steps 4-8) uses ACF first minima and FFT peaks on pulse residuals; it does not use the P_mu-P relation to decide what counts as a detection. The P_mu-P fit in Section 4.3 is a least-squares fit to a compiled dataset (Table 4) that includes the paper's new MP values as independent points; it is a fitted result, not an assumed input, so its agreement with prior work is an independent meta-analysis rather than a circular restatement. The paper explicitly notes limitations in Section 4.2 (small sample size, time resolution) and Section 4.1.2 (only 7 PC pulses), which supports a non-circular reading. The only self-citations are: (a) Dang et al. 2024 contributes one RRAT point to Table 4, and (b) Sun et al. 2025 supplies zeta values and polarization geometry in Section 5.2. These are not load-bearing: removing the Dang et al. point would not materially change the fit, and the IP-detection claim does not depend on Sun et al. The methodological concern about manual selection and the absence of a false-alarm null test is a statistical validity issue, not a circularity issue. Therefore no circular step is identified, and the paper is self-contained with respect to its main claims.
Axiom & Free-Parameter Ledger
free parameters (4)
- Power-law amplitude A =
1.337 +/- 0.114
- Power-law index alpha =
1.063 +/- 0.038
- Smoothing bandwidth H =
0.075 x N_on
- SNR screening threshold =
SNR > 15 and at least 5 on-pulse bins above 3 sigma of off-pulse
axioms (4)
- domain assumption The first minimum of the residual ACF measures the microstructure characteristic timescale tau_mu, and FFT peaks measure quasi-periodicity.
- ad hoc to paper Visual and manual selection can reliably identify genuine quasi-periodic single pulses and exclude RFI.
- domain assumption Component phase ranges assigned by visual inspection or by minimum-intensity separation are adequate for MP/IP comparison.
- domain assumption Microstructure persists within a magnetic flux tube, so similar or different P_mu and tau_mu between MP and IP indicate same or different tubes.
Cite this review
Pith. "Pith review of FAST Observations of the Microstructure in Interpulse Pulsars." pith.science (2026). https://pith.science/paper/VAWHFYZB
@misc{pith2026250905957,
  author       = {Pith},
  title        = {Pith review of: FAST Observations of the Microstructure in Interpulse Pulsars},
  year         = {2026},
  howpublished = {\url{https://pith.science/paper/VAWHFYZB}},
  note         = {Machine review of arXiv:2509.05957}
}
read the original abstract
In this study, we investigate the microstructure properties of four pulsars (PSRs J0953+0755 (B0950+08), J0627+0706, J0826+2637 (B0823+26) and J1946+1805 (B1944+17)) using the Five-hundred-meter Aperture Spherical radio Telescope (FAST), with particular emphasis on identifying microstructure within interpulse (IP). Through the application of autocorrelation function (ACF) analysis and fast Fourier transform (FFT) techniques, we have systematically examined the periodicity of microstructure in these pulsars. Our findings represent the first successful detection of microstructure within IP. Furthermore, we conducted a comprehensive statistical analysis comparing the characteristic timescales ($\tau_{\mu}$) and the characteristic periods $P_{\mu}$ of quasi-periodic microstructure between the main pulse (MP) and IP, and our results indicate that the $\tau_{\mu}$ and $P_{\mu}$ of microstructure across components appear consistent within measurement errors for PSR J0627+0706, but microstructure in IP are relatively smaller than those in MP for PSR J0953+0755. Furthermore, the relationship between $P_{\mu}$ of microstructure and the rotation period in neutron star populations was reconfirmed: $P_{\mu}(\text{ms})=(1.337\pm0.114)\times P(\text{s})^{(1.063\pm0.038)}$.
Figures




Forward citations
Cited by 1 Pith paper
-
FAST Pulsar Database IV. Spike subpulses and quasi-periodic subpulses of 25 pulsars observed by FAST
High-resolution FAST data reveal spike subpulses (strongly polarized, marginally resolved) in 21 pulsars and quasi-periodic subpulses (periods ~0.1-1 ms) in 13 pulsars, with checks for rotation period correlation.
Reference graph
Works this paper leans on
-
[1]
2019, MNRAS, 489, 4589, doi: 10.1093/mnras/stz2299
Arumugasamy, P., & Mitra, D. 2019, MNRAS, 489, 4589, doi: 10.1093/mnras/stz2299
-
[2]
1993, MNRAS, 264, 940, doi: 10.1093/mnras/264.4.940
Asseo, E. 1993, MNRAS, 264, 940, doi: 10.1093/mnras/264.4.940
-
[3]
C., Boriakoff, V., & Manchester, R
Backer, D. C., Boriakoff, V., & Manchester, R. N. 1973, Nature Physical Science, 243, 77, doi: 10.1038/physci243077a0
-
[4]
Bartel, N., Sieber, W., & Graham, D. A. 1980, A&A, 87, 282
work page 1980
-
[5]
Basu, R., & Mitra, D. 2019, MNRAS, 487, 4536, doi: 10.1093/mnras/stz1590 5 https://numpy.org/ 6 https://matplotlib.org/ 7 https://scipy.org/
-
[6]
Beloborodov, A. M. 2017, ApJL, 843, L26, doi: 10.3847/2041-8213/aa78f3
-
[7]
1977, MNRAS, 179, 311, doi: 10.1093/mnras/179.3.311
Benford, G. 1977, MNRAS, 179, 311, doi: 10.1093/mnras/179.3.311
-
[8]
Bochenek, C. D., Ravi, V., Belov, K. V., et al. 2020, Nature, 587, 59, doi: 10.1038/s41586-020-2872-x
-
[9]
1976, ApJL, 208, L43, doi: 10.1086/182229
Boriakoff, V. 1976, ApJL, 208, L43, doi: 10.1086/182229
-
[10]
Boriakoff, V., & Ferguson, D. C. 1981, in Pulsars: 13 Years of Research on Neutron Stars, ed. W. Sieber & R. Wielebinski, Vol. 95, 191–196
work page 1981
-
[11]
2022a, Nature Astronomy, 6, 828, doi: 10.1038/s41550-022-01688-x
Caleb, M., Heywood, I., Rajwade, K., et al. 2022a, Nature Astronomy, 6, 828, doi: 10.1038/s41550-022-01688-x
-
[12]
2022b, MNRAS, 510, 1996, doi: 10.1093/mnras/stab3223
Caleb, M., Rajwade, K., Desvignes, G., et al. 2022b, MNRAS, 510, 1996, doi: 10.1093/mnras/stab3223
-
[13]
Chen, J. L., Wen, Z. G., Yuan, J. P., et al. 2022, ApJ, 934, 24, doi: 10.3847/1538-4357/ac75d1 26
-
[14]
Chen, J. L., Wen, Z. G., Duan, X. F., et al. 2023, ApJ, 946, 2, doi: 10.3847/1538-4357/acbd97 CHIME/FRB Collaboration, Andersen, B. C., Bandura, K. M., et al. 2020, Nature, 587, 54, doi: 10.1038/s41586-020-2863-y Chime/Frb Collaboration, Andersen, B. C., Bandura, K.,
-
[15]
2022, Nature, 607, 256, doi: 10.1038/s41586-022-04841-8
Bhardwaj, M., et al. 2022, Nature, 607, 256, doi: 10.1038/s41586-022-04841-8
-
[16]
Cordes, J. M. 1976, ApJ, 208, 944, doi: 10.1086/154683
-
[17]
Cordes, J. M., & Hankins, T. H. 1977, ApJ, 218, 484, doi: 10.1086/155702
doi:10.1086/155702 1977
-
[18]
Cordes, J. M., Weisberg, J. M., & Hankins, T. H. 1990, AJ, 100, 1882, doi: 10.1086/115644
doi:10.1086/115644 1990
-
[19]
Craft, H. D., Comella, J. M., & Drake, F. D. 1968a, Nature, 218, 1122, doi: 10.1038/2181122a0
-
[20]
Craft, H. D., Sutton, J. M., & Comella, J. M. 1968b, Nature, 219, 1237, doi: 10.1038/2191237a0
-
[21]
Dang, S. J., Yuan, J. P., Shang, L. H., et al. 2024, MNRAS, 528, 1213, doi: 10.1093/mnras/stae046
-
[22]
Daugherty, J. K., & Harding, A. K. 1982, ApJ, 252, 337, doi: 10.1086/159561
doi:10.1086/159561 1982
-
[23]
2016, ApJL, 833, L10, doi: 10.3847/2041-8213/833/1/L10
De, K., Gupta, Y., & Sharma, P. 2016, ApJL, 833, L10, doi: 10.3847/2041-8213/833/1/L10
-
[24]
Deich, W. T. S., Cordes, J. M., Hankins, T. H., & Rankin, J. M. 1986, ApJ, 300, 540, doi: 10.1086/163831
doi:10.1086/163831 1986
-
[25]
Ferguson, D. C., Graham, D. A., Jones, B. B., Seiradakis, J. H., & Wielebinski, R. 1976, Nature, 260, 25, doi: 10.1038/260025a0
doi:10.1038/260025a0 1976
-
[26]
Pulse Profile Variability of PSR J1022+1001 in NANOGrav Data
Fiore, W., McLaughlin, M. A., Agazie, G., et al. 2024, arXiv e-prints, arXiv:2412.05452, doi: 10.48550/arXiv.2412.05452
work page internal anchor Pith review Pith/arXiv arXiv doi:10.48550/arxiv.2412.05452 2024
-
[27]
Hankins, T. H. 1971a, PhD thesis, University of California, San Diego —. 1971b, ApJ, 169, 487, doi: 10.1086/151164
-
[28]
Hankins, T. H., & Boriakoff, V. 1978, Nature, 276, 45, doi: 10.1038/276045a0
doi:10.1038/276045a0 1978
-
[29]
Hankins, T. H., & Cordes, J. M. 1981, ApJ, 249, 241, doi: 10.1086/159281
-
[30]
Hankins, T. H., & Fowler, L. A. 1986, ApJ, 304, 256, doi: 10.1086/164159
-
[31]
Hankins, T. H., Kern, J. S., Weatherall, J. C., & Eilek, J. A. 2003, Nature, 422, 141, doi: 10.1038/nature01477
-
[32]
Harris, C. R., Millman, K. J., van der Walt, S. J., et al. 2020, Nature, 585, 357, doi: 10.1038/s41586-020-2649-2
-
[33]
2018, MNRAS, 480, 3655, doi: 10.1093/mnras/sty2075
Hermsen, W., Kuiper, L., Basu, R., et al. 2018, MNRAS, 480, 3655, doi: 10.1093/mnras/sty2075
-
[34]
2004, MNRAS, 353, 1311, doi: 10.1111/j.1365-2966.2004.08157.x
Jordan, C. 2004, MNRAS, 353, 1311, doi: 10.1111/j.1365-2966.2004.08157.x
arXiv 2004
-
[35]
W., van Straten, W., & Manchester, R
Hotan, A. W., van Straten, W., & Manchester, R. N. 2004, PASA, 21, 302, doi: 10.1071/AS04022
doi:10.1071/as04022 2004
-
[36]
Hunter, J. D. 2007, Computing in Science & Engineering, 9, 90, doi: 10.1109/MCSE.2007.55
-
[37]
Jenet, F. A., Anderson, S. B., Kaspi, V. M., Prince, T. A., & Unwin, S. C. 1998, ApJ, 498, 365, doi: 10.1086/305529
doi:10.1086/305529 1998
-
[38]
Jessner, A., Popov, M. V., Kondratiev, V. I., et al. 2010, A&A, 524, A60, doi: 10.1051/0004-6361/201014806
-
[39]
2001, ApJL, 549, L101, doi: 10.1086/319154
Johnston, S., van Straten, W., Kramer, M., & Bailes, M. 2001, ApJL, 549, L101, doi: 10.1086/319154
-
[40]
J., Johnston, S., Weltevrede, P., & Kramer, M
Keith, M. J., Johnston, S., Weltevrede, P., & Kramer, M. 2010, MNRAS, 402, 745, doi: 10.1111/j.1365-2966.2009.15926.x
arXiv 2010
-
[41]
Kloumann, I. M., & Rankin, J. M. 2010, MNRAS, 408, 40, doi: 10.1111/j.1365-2966.2010.17114.x
arXiv 2010
-
[42]
2002, MNRAS, 334, 523, doi: 10.1046/j.1365-8711.2002.05478.x
Kramer, M., Johnston, S., & van Straten, W. 2002, MNRAS, 334, 523, doi: 10.1046/j.1365-8711.2002.05478.x
arXiv 2002
-
[43]
Stappers, B. W. 2024, Nature Astronomy, 8, 230, doi: 10.1038/s41550-023-02125-3
-
[44]
Kuzmin, A. D., Hamilton, P. A., Shitov, Y. P., et al. 2003, MNRAS, 344, 1187, doi: 10.1046/j.1365-8711.2003.06900.x
arXiv 2003
-
[45]
Lange, C., Kramer, M., Wielebinski, R., & Jessner, A. 1998, A&A, 332, 111
work page 1998
-
[46]
Lee, Y. W. J., Caleb, M., Murphy, T., et al. 2025, Nature Astronomy, 9, 393, doi: 10.1038/s41550-024-02452-z
-
[47]
Liu, K., Bassa, C. G., Janssen, G. H., et al. 2016, MNRAS, 463, 3239, doi: 10.1093/mnras/stw2223
-
[48]
Liu, K., Antoniadis, J., Bassa, C. G., et al. 2022, MNRAS, 513, 4037, doi: 10.1093/mnras/stac1082
-
[49]
Lower, M. E., Bailes, M., Shannon, R. M., et al. 2020, MNRAS, 494, 228, doi: 10.1093/mnras/staa615
-
[50]
2014, MNRAS, 442, L9, doi: 10.1093/mnrasl/slu046
Lyubarsky, Y. 2014, MNRAS, 442, L9, doi: 10.1093/mnrasl/slu046
-
[51]
Maciesiak, K., Gil, J., & Ribeiro, V. A. R. M. 2011, MNRAS, 414, 1314, doi: 10.1111/j.1365-2966.2011.18471.x
arXiv 2011
-
[52]
Majid, W. A., Pearlman, A. B., Prince, T. A., et al. 2021, ApJL, 919, L6, doi: 10.3847/2041-8213/ac1921
-
[53]
Manchester, R. N., Hobbs, G. B., Teoh, A., & Hobbs, M. 2005, AJ, 129, 1993, doi: 10.1086/428488
doi:10.1086/428488 2005
-
[54]
Manchester, R. N., & Lyne, A. G. 1977, MNRAS, 181, 761, doi: 10.1093/mnras/181.4.761
-
[55]
Melikidze, G. I., Gil, J. A., & Pataraya, A. D. 2000, ApJ, 544, 1081, doi: 10.1086/317220
doi:10.1086/317220 2000
-
[56]
Mitra, D., Arjunwadkar, M., & Rankin, J. M. 2015, ApJ, 806, 236, doi: 10.1088/0004-637X/806/2/236
-
[57]
Mitra, D., Basu, R., Melikidze, G. I., & Arjunwadkar, M. 2020, MNRAS, 492, 2468, doi: 10.1093/mnras/stz3620 27
-
[58]
2022, Research in Astronomy and Astrophysics, 22, 124004, doi: 10.1088/1674-4527/ac995d
Niu, J.-R., Zhu, W.-W., Zhang, B., et al. 2022, Research in Astronomy and Astrophysics, 22, 124004, doi: 10.1088/1674-4527/ac995d
-
[59]
2023, A&A, 678, A149, doi: 10.1051/0004-6361/202243339
Pastor-Marazuela, I., van Leeuwen, J., Bilous, A., et al. 2023, A&A, 678, A149, doi: 10.1051/0004-6361/202243339
-
[60]
Pilkington, J. D. H., Hewish, A., Bell, S. J., & Cole, T. W. 1968, Nature, 218, 126, doi: 10.1038/218126a0
doi:10.1038/218126a0 1968
-
[61]
Popov, M. V., Bartel, N., Cannon, W. H., et al. 2002, A&A, 396, 171, doi: 10.1051/0004-6361:20021402
-
[62]
Sobey, C., Young, N. J., Hessels, J. W. T., et al. 2015, MNRAS, 451, 2493, doi: 10.1093/mnras/stv1066
-
[63]
Soglasnov, V. A., Smirnova, T. V., Popov, M. V., & Kuz’min, A. D. 1981, Soviet Ast., 25, 442
work page 1981
-
[64]
The emission geometry of pulsars with interpulses
Sun, S. N., Wang, N., Yan, W. M., & Wang, S. Q. 2025, arXiv e-prints, arXiv:2503.13824, doi: 10.48550/arXiv.2503.13824
work page internal anchor Pith review Pith/arXiv arXiv doi:10.48550/arxiv.2503.13824 2025
-
[65]
2025, MNRAS, doi: 10.1093/mnras/staf570
Tang, Z., Zhang, S., Wang, J., Yang, X., & Wu, X. 2025, MNRAS, doi: 10.1093/mnras/staf570
-
[66]
2022a, ApJ, 933, 231, doi: 10.3847/1538-4357/ac501f —
Thompson, C. 2022a, ApJ, 933, 231, doi: 10.3847/1538-4357/ac501f —. 2022b, ApJ, 933, 232, doi: 10.3847/1538-4357/ac51d4
-
[67]
2024, Ap&SS, 369, 21, doi: 10.1007/s10509-024-04284-9 van Straten, W., & Bailes, M
Tian, J., Xu, X., Bai, J., et al. 2024, Ap&SS, 369, 21, doi: 10.1007/s10509-024-04284-9 van Straten, W., & Bailes, M. 2011, PASA, 28, 1, doi: 10.1071/AS10021
-
[68]
Vaughan, A. E., & Large, M. I. 1970, Nature, 225, 167, doi: 10.1038/225167a0
doi:10.1038/225167a0 1970
-
[69]
Virtanen, P., Gommers, R., Oliphant, T. E., et al. 2020, Nature Methods, 17, 261, doi: 10.1038/s41592-019-0686-2
-
[70]
Wang, N., Manchester, R. N., & Johnston, S. 2007, MNRAS, 377, 1383, doi: 10.1111/j.1365-2966.2007.11703.x
arXiv 2007
-
[71]
2022, MNRAS, 517, 5560, doi: 10.1093/mnras/stac3026
Wang, Z., Lu, J., Jiang, J., et al. 2022, MNRAS, 517, 5560, doi: 10.1093/mnras/stac3026
-
[72]
2023, Universe, 9, 50, doi: 10.3390/universe9010050
Yang, H., Dang, S., Zhi, Q., et al. 2023, Universe, 9, 50, doi: 10.3390/universe9010050
-
[73]
Zhang, S. B., Geng, J. J., Wang, J. S., et al. 2024, ApJ, 972, 59, doi: 10.3847/1538-4357/ad6602
-
[74]
2024, MNRAS, 527, 4129, doi: 10.1093/mnras/stad3402
Zhong, W., Zhi, Q., Lu, J., et al. 2024, MNRAS, 527, 4129, doi: 10.1093/mnras/stad3402
discussion (0)
Sign in with ORCID, Apple, or X to comment. Anyone can read and Pith papers without signing in.