REVIEW 3 major objections 4 minor 1 cited by
The paper claims GOTHAM's uniform Bayesian analysis of 102 molecules in TMC-1 yields column densities and isotopic ratios, with ten aromatics carrying 0.011% of detected carbon with CO and 6% without.
Reviewed by Pith at T0; open to challenge. T0 means a machine referee read the full paper against a public rubric. the ladder, T0–T4 →
A uniform Bayesian analysis of the GOTHAM 3.9-36.4 GHz survey yields column densities for 102 molecules in TMC-1 and shows CN-functionalized aromatics carry about 6% of the non-CO gas-phase carbon detected.
T0 review reviewed 2026-08-04 challenge →
load-bearing objection A solid, transparent reference inventory of 102 molecules in TMC-1 with real reproducibility value, but the headline carbon fractions lack error bars and weak-species priors could use a systematic-uncertainty caveat. the 3 major comments →
The Molecular Inventory of TMC-1 with GOTHAM Observations
The pith
A machine-rendered reading of the paper's core claim, the machinery that carries it, and where it could break.
The reading
Core claim
The central claim is that the GOTHAM DR V dataset, after uniform calibration and reduction, can be fitted with one consistent model to produce reliable column densities for all 102 molecules, and that these abundances are a valid reference for the chemistry of cold prestellar gas. The strongest specific result is the carbon budget: unsaturated carbon chains dominate the non-CO carbon, while the ten detected aromatics, nine of them CN-functionalized, contribute roughly 0.011% of gas-phase carbon with CO included and about 6% with CO excluded. The paper also derives isotopic ratios — mean 12C/13C near 56–69 for cyanopolyynes, H/D near 42–89 for carbon chains — and finds gas-phase carbon and ni
What carries the argument
Single-excitation-temperature radiative transfer with optical-depth corrections, implemented in the molsim line-modeling code and sampled with an affine-invariant MCMC ensemble sampler. Every species is modeled with four fixed velocity components that are either radiatively separated or co-spatial; column density, source size, velocity offset, excitation temperature, and line width are free parameters, with weakly constrained species inheriting Gaussian priors from reference molecules (HC3N, HC9N, benzonitrile). The paper pairs this with a new Python calibration pipeline that automates interference flagging, baseline fitting, Doppler tracking, and opacity correction.
Load-bearing premise
The analysis assumes every molecule's emission can be described by one excitation temperature, one line width, and a fixed set of four velocity components, with weakly detected species inheriting priors from brighter ones — an assumption the paper itself shows fails for CCS, formaldehyde, and cyclopropenylidene.
What would settle it
Take a weakly constrained species that was fitted with an inherited Gaussian prior (for example HCNO or t-HCOOH), observe enough additional rotational transitions to span a wide range of upper-state energies, and re-fit with uninformative priors; if the column density moves by more than the quoted 68% interval, the uniform single-excitation model is not reliable for the inventory.
If this is right
- Astrochemical models can be benchmarked against one uniform set of 102 column densities instead of heterogeneous literature values.
- The elemental budget places gas-phase carbon at about one-third of the standard model initial abundance and gas-phase nitrogen much lower, indicating most of the cloud's carbon and nitrogen are in unobserved reservoirs.
- Ten aromatics, traced by CN-functionalized proxies, represent 0.011% of gas-phase carbon with CO included and 6% with CO excluded.
- Measured 12C/13C ratios range roughly 50–223 and H/D ratios about 7–97, with no strong 13C enrichment at the carbon next to nitrogen in cyanopolyynes.
- Many species are detected in fewer than four velocity components, showing chemical heterogeneity along the TMC-1 filament.
Where Pith is reading between the lines
- A uniform single-temperature inventory understates the true uncertainty for species with few detected lines; the paper's own CCS and formaldehyde results suggest some reported column densities could shift if out-of-thermal-equilibrium excitation were modeled.
- If CN-functionalized aromatics are faithful proxies, the 6% non-CO carbon share implies that radio-invisible pure aromatics may be a still larger carbon reservoir, testable through infrared C–H stretch observations or by measuring X-H/X-CN ratios for more species.
- Applying the same pipeline and fitting procedure to other starless cores would produce directly comparable inventories, letting models separate cloud-to-cloud chemical variation from systematic fitting differences.
- The contrast with oxygen-rich hot-core ices implies that prestellar unsaturated hydrocarbons should accrete onto grains; searching for aromatic or hydrocarbon ice features toward young protostars would test whether this reservoir survives into star formation.
Editorial analysis
A structured set of objections, weighed in public.
Referee Report
Summary. This paper presents the fifth data reduction (DR V) of the GOTHAM spectral survey of TMC-1 and applies an MCMC-based spectral fitting pipeline to 102 previously detected molecular species (75 main-isotope, 20 13C, 7 D). For each species it reports total column density, rotational temperature, and line width under either a co-spatial or separated four-velocity-component radiative transfer model, with a single excitation temperature and a common line width per species. It derives 12C/13C and H/D ratios and combines the GOTHAM columns with literature values to compute elemental abundances and carbon budget percentages, including the headline values that ten aromatic molecules contribute 0.011% of gas-phase carbon when CO is included and 6% when CO is excluded.
Significance. The value of the paper is as a uniformly processed, public reference inventory: it releases calibrated spectra, full posterior samples, and open-source calibration/fitting code, and it includes new laboratory frequency measurements for C3N, c-C3H, and CH3C6H. If the systematic limitations are properly quantified, the dataset will be a useful benchmark for astrochemical models. The central scientific claim, however, is not just the catalog but the aggregate carbon budget; that claim currently rests on a single-excitation-temperature model and on literature/fixed H2 values without propagated uncertainties, so the precision of the headline percentages is not yet supported.
major comments (3)
- [§6.1, Tables 5-6] The headline fractions (0.011%, 6%, 65%) are quoted without uncertainties. They combine GOTHAM posterior medians, literature columns with their own systematic uncertainties, and a fixed N(H2)=1.82e22 cm-2 taken without error from Fuente et al. (2019). Per-species 68% intervals in Tables 2-4 are marginal statistical intervals; they do not include calibration uncertainties (10-20%, Section 2), the fixed N(H2), or the correlation induced by shared priors. Please propagate these sources, e.g., by sampling from joint posteriors and literature error distributions, or provide an explicit sensitivity analysis. As written, the abstract's precision is not supported.
- [Appendix C, Tables 10-12; §4.2] For species with sparse lines, Trot and ΔV priors are Gaussian centered on the same team's previous fits to HC3N, HC9N, or benzonitrile (Tables 10-12). This anchors weak detections, and because the same reference values are applied to many species, the resulting systematic errors are correlated and invisible in the reported 68% intervals. A specific test is needed: re-fit a representative set of species marked §/∥ with broad uniform priors (or with priors shifted by ±2 K, ±0.01 km/s) and report the change in N_T, isotope ratios, and aggregate carbon fractions. Without this, the 'uniform reference set' claim is a statement of procedure, not of demonstrated accuracy.
- [§5, §6.3] The single-Trot/common-ΔV model is explicitly invalid for CCS, H2CO, c-C3H2, and c-C3HD, and these species are excluded from the analysis. CCS is a major carbon-chain molecule and H2CO/c-C3H2 are non-negligible carbon carriers; omitting them affects the 'excluding CO' carbon-budget percentages. I request a quantitative estimate of their contribution using literature column densities (e.g., adding them to Table 5) or a stated bound on the resulting error. Without this, the 65% and 6% figures are incomplete.
minor comments (4)
- [Abstract; §5; Appendix A] The survey is described as covering 3.9-36.4 GHz, while Section 5 and Appendix A state that Ka-band data above 32 GHz are excluded from the analysis. Please specify 'observed' vs 'analyzed' frequency coverage.
- [References] The DOI for the GOTHAM Collaboration (2025) data release appears as '10.7910/DVN/QCR WV7' with a space; please verify.
- [Table 5] CO, 13CO, and C18O are all listed; please clarify how the carbon budget treats isotopic variants of CO to avoid double counting.
- [Appendix C] The sentence 'we initiated fitting with uniformly distributed priors' is inconsistent with the Gaussian priors specified in Tables 10-12 for V_LSR and, for weak species, for Trot and ΔV. Please qualify the statement.
Circularity Check
Moderate self-citation load-bearing: weak-species column densities inherit Trot/ΔV priors from the same team's earlier GOTHAM fits, but line intensities still constrain the main inventory.
specific steps
-
self citation load bearing
[Appendix C, Tables 10-12; Section 4.2]
"To aid in convergence, we construct prior distributions for different models based on the posteriors from the previous MCMC analyses as detailed in Appendix C. ... When only limited transitions were detected for certain species in the GOTHAM observations, Gaussian priors of N(6.7,2.0) for Trot and/or N(0.117,0.005) for ∆V were applied, informed by the posterior distribution of HC9N (Loomis et al. 2021)."
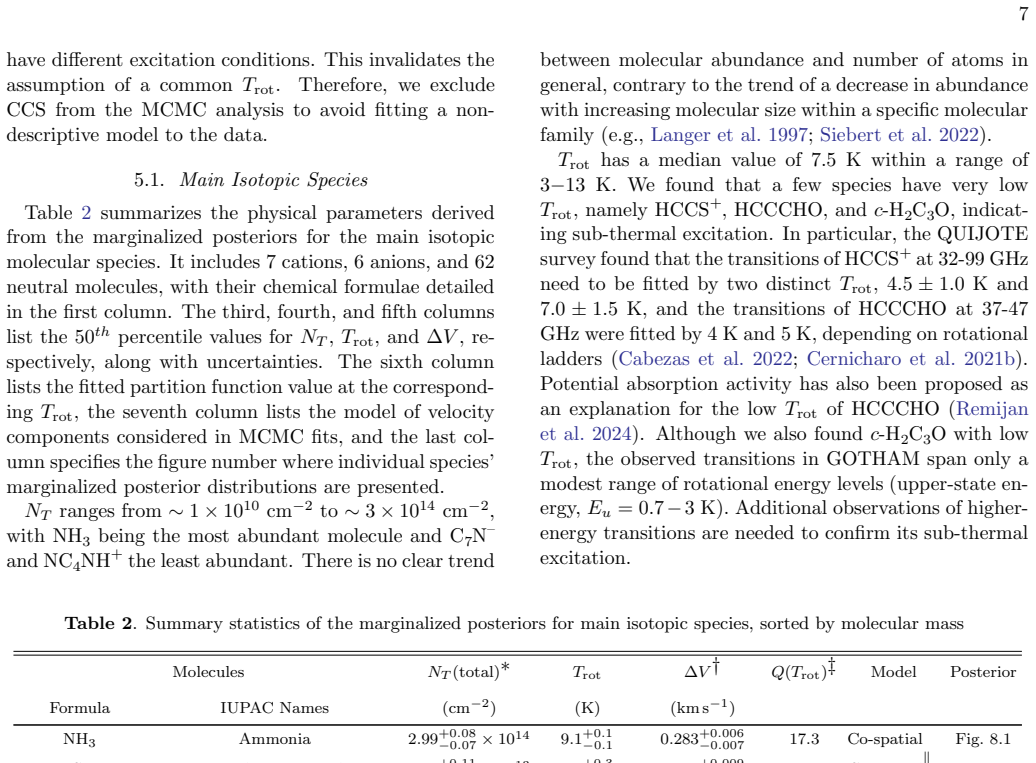
The priors for Trot and ΔV for species with sparse lines are set to Gaussian distributions centered on the posterior values of HC9N from Loomis et al. (2021), a same-team fit to the same GOTHAM data. For those species the data are insufficient to move the posterior away from the prior: Table 2 lists many species with Trot=6.7±1.0 K and ΔV=0.118±0.003 km/s, identical to the prior. The reported column densities are then derived under an excitation temperature and line width imported from the same group's earlier analysis, so the 'reference set' is partly a propagation of the team's own previous results rather than an independent constraint.
full rationale
The central derivation is a Bayesian fit of line intensities to 102 previously detected species; the column densities are constrained by observed line amplitudes, not by the priors alone. However, Appendix C shows that for species with limited line coverage, the Trot and ΔV priors are inherited from previous GOTHAM fits by the same team (Loomis et al. 2021; McGuire et al. 2021), and many posteriors in Table 2 coincide with these priors (e.g., Trot=6.7±1.0 K). The reported column densities for these weak species are therefore conditional on the same group's earlier fits to the same data, which is a self-citation that is load-bearing for part of the inventory. The paper is transparent about this and the main well-detected species are not affected, so the overall circularity is moderate (4/10).
Axiom & Free-Parameter Ledger
free parameters (6)
- Excitation temperature T_rot per molecule =
3-13 K, median ~7.5 K across 102 species
- Line width Delta V per molecule =
0.1-0.3 km/s
- Column density per velocity component N_T =
~1e10 to ~3e14 cm^-2 per component
- Source size theta_s per velocity component =
Up to a few hundred arcsec
- Local standard rest velocity V_LSR per component =
~5.6-6.1 km/s
- Partition function polynomial coefficients =
Low-order log-polynomial fits, within 5% of CDMS values
axioms (6)
- domain assumption A single excitation temperature describes all rotational levels of each species
- domain assumption Gaussian source brightness distribution and beam filling factor formula
- domain assumption Four velocity components with common T_rot and Delta V
- ad hoc to paper Priors from previous GOTHAM fits are representative for weakly constrained species
- domain assumption H2 column density equals 1.82e22 cm^-2 from the literature
- domain assumption Spectroscopic catalogs from CDMS and new lab measurements are accurate for TMC-1 conditions
Cite this review
Pith. "Pith review of The Molecular Inventory of TMC-1 with GOTHAM Observations." pith.science (2026). https://pith.science/paper/7CGUAFDU
@misc{pith2026250906256,
  author       = {Pith},
  title        = {Pith review of: The Molecular Inventory of TMC-1 with GOTHAM Observations},
  year         = {2026},
  howpublished = {\url{https://pith.science/paper/7CGUAFDU}},
  note         = {Machine review of arXiv:2509.06256}
}
abstract
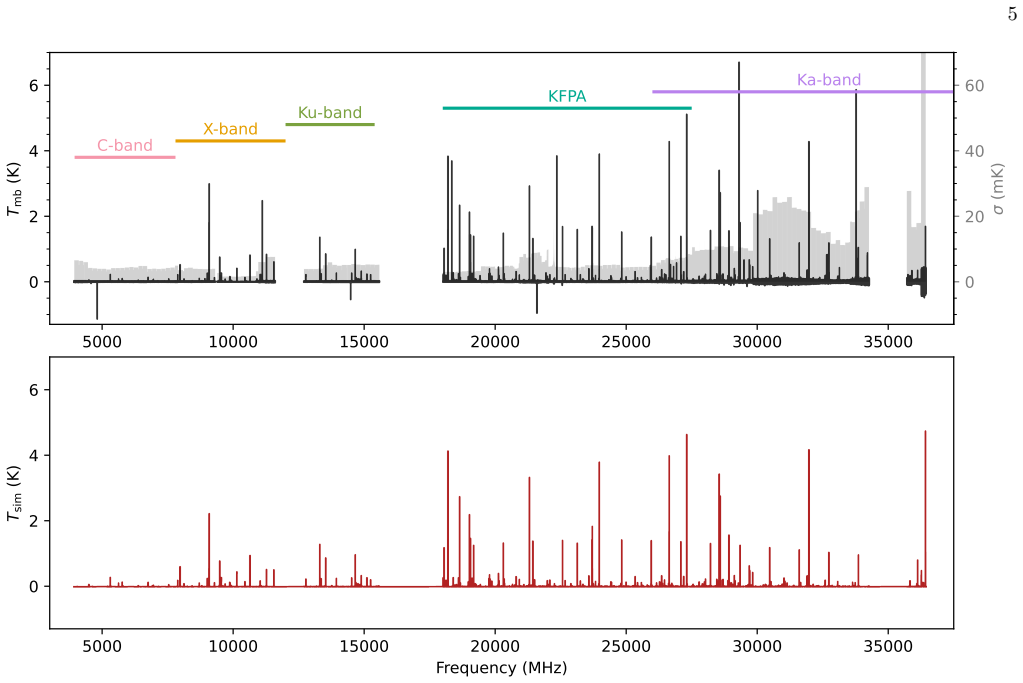
Spectral line surveys of the Taurus Molecular Cloud-1 (TMC-1) have led to the detection of more than 100 new molecular species, making it the most prolific source of interstellar molecular discoveries. These wide-band, high-sensitivity line surveys have been enabled by advances in telescope and receiver technology, particularly at centimeter and millimeter wavelengths. In this work, we present a statistical analysis of the molecular inventory of TMC-1 as probed by the GOTHAM large program survey from 3.9 to 36.4 GHz. To fully unlock the potential of the $\sim$29 GHz spectral bandwidth, we developed an automated pipeline for data reduction and calibration. We applied a Bayesian approach with Markov-Chain Monte Carlo fitting to the calibrated spectra and constrained column densities for 102 molecular species detected in TMC-1, including 75 main isotopic species, 20 carbon-13 substituted species, and seven deuterium-substituted species. This list of the detected gas-phase molecules is populated by unsaturated hydrocarbons, in stark contrast to the oxygen-rich organics found in sublimated ices around protostars. Of note, ten individual aromatic molecules were identified in the GOTHAM observations, contributing 0.011% of the gas-phase carbon budget probed by detected molecules when including CO and 6% when excluding CO. This work provides a reference set of observed gas-phase molecular abundances for interstellar clouds, offering a new benchmark for astrochemical theoretical models.
Figures


Forward citations
Cited by 1 Pith paper
-
Exploring the Limits of Spectral Line Stacking in Spectral Line Data and Application Toward the Detection of Bulk $^{13}$C Enrichment of Aromatics in TMC-1
Spectral-line stacking can recover aggregate 13C-isotopologue emission without false positives, and existing TMC-1 observations could distinguish a local from an enriched carbon-isotope ratio in PAHs if the needed lab...
Reference graph
Works this paper leans on
-
[1]
Ag´ undez, M., Marcelino, N., Cabezas, C., et al. 2022, A&A, 657, A96, doi: 10.1051/0004-6361/202142678 Ag´ undez, M., Marcelino, N., Tercero, B., et al. 2021, A&A, 649, L4, doi: 10.1051/0004-6361/202140978 Ag´ undez, M., Molpeceres, G., Cabezas, C., et al. 2025, A&A, 693, L20, doi: 10.1051/0004-6361/202453459 Alexander, A., Kroto, H., Maier, M., & Walton...
arXiv 2022
-
[4]
As such, a criterion is needed to systematically eliminate data with abnormalT sys values
These abnormalT sys values indicate that a proper balance and stabilization in the system were not achieved during these observations so the corresponding integrations become unusable. As such, a criterion is needed to systematically eliminate data with abnormalT sys values. In this reduction, we adapted a threshold of three times the typical values ofT s...
work page 2024
-
[5]
CLEO interpolated CLEO sample GBTIDL default Figure 6.Zenith sky opacity of the default values used inGBTIDL(black dashed line) and the dynamic values retrieved fromCLEOassociated with the session 08 of AGBT18B-007 as examples (color solid lines). Different colors represent linear interpolation between observation times, while the cubic spline represents ...
work page 2025
-
[7]
These data were combined with Lovas et al
Similarly, acetylene, C 2H2, was used in a discharge experiment to generatec-C 3H and to measure the hyperfine structure of its 1 10 −1 11 transition at 14 GHz. These data were combined with Lovas et al. (1992) and Yamamoto & Saito (1994) to re-derive the spectroscopic parameters of the S-reduced (I r) asymmetric top Hamiltonian listed in Table
work page 1992
-
[8]
Starting with predictions derived from the original microwave measurements by Alexander et al
The same discharge mixture was used to produce CH 3C6H. Starting with predictions derived from the original microwave measurements by Alexander et al. (1978) from 28 to 40 GHz, we detected 24 new transitions from 6 to 23 GHz (J ′ = 4−15,K ′ a = 0,1, whereJ ′ andK ′ a are the total angular momentum quantum number anda-axis projection of the upper state). T...
work page 1978
-
[9]
24 T able 7.Spectroscopic Constants of C3N (in MHz) Constant This work ∗ Gu´ elin et al
The catalog rest frequencies derived from these data have an uncertainty below 1 kHz, which is about an order of magnitude more precise than the predictions derived from the high-frequency data alone. 24 T able 7.Spectroscopic Constants of C3N (in MHz) Constant This work ∗ Gu´ elin et al. (1982) B4947.620042(
- [11]
-
[12]
Except for source velocities for the four components, we initiated fitting with uniformly distributed priors on parameter values with only physical constraints (i.e., positive values). The priors forV LSR were determined using three well-characterized molecules, HC 3N, HC 9N, andc-C 6H5CN. In the co-spatial case, we found that molecules appeared to shareV...
work page 2021
-
[41]
-0.0340(37) HJ ×10 3 0.0854(157) 0.087(108) HKJ ×10 3 -1.196(171) -1.21(172) HK ×10 3 -35.15(310) -35(40) h1 ×10 3 0.0489(182) 0.051(55) h2 ×10 3 -0.009(23) -0.008(40) h3 ×10 3 -0.0182(135) -0.018(39) ϵaa 113.2839(240) 113.2637(253) ϵbb 59.3849(231) 59.3811(239) ϵcc -205.7549(246) -205.7540(248) Ds N 0.00160(69) 0.00137(79) Ds N K -0.0269(41) -0.0252(45) ...
work page 1978
- [59]
-
[63]
In practice, strong and weak molecular lines require different treatments when determining the baselines (i.e.,mandcin Eq A3) for comparison with thek= 63 sample points. For strong signals, we determinedmandcover a narrow 63-channel spectral chunk, while for weak signals, we determined them over a wider 511-channel chunk. This adjustment is necessary, as ...
work page 2010
- [66]
-
[79]
-2.16(10) c2.86476(230) 2.85(20) eQq-4.32567(193) -4.34(25) σnorm fit 1.07434 ∗ 1σuncertainties are given in parentheses in units of the last digit. T able 8.Spectroscopic Constants of c-C3H in the S (I r) reduction (in MHz) Constant This work ∗ JPL (Pickett et al. 1998)/Yamamoto & Saito (1994) A44528.46(75) 44528.4(99) B34015.4921(
-
[127]
A.3.Baseline fitting and subtraction The baseline fitting technique is a hybrid of the polynomial fitting and Lomb-Scargle periodogram techniques. As detailed in Cordiner et al. (2022), the Lomb-Scargle technique identifies periodic spectral components with the highest power determined through the Fourier transformation. We adopt it for the removal of the...
work page 2022
This paper was first reviewed by deepseek-v4-flash on August 4, 2026.
discussion (0)
Sign in with ORCID, Apple, or X to comment. Anyone can read and Pith papers without signing in.