REVIEW 2 major objections 5 minor 71 references
ADHAM: Additive Deep Hazard Analysis Mixtures for Interpretable Survival Regression
T0 review · 2 major / 5 minor · reviewed 2026-08-15 · deepseek-v4-flash
Pith's one-line read ADHAM writes each patient's hazard as a weighted sum of per-covariate risk curves, so a single trained model yields population-, subgroup-, and patient-level explanations while matching existing interpretable survival models on predictive…
desk verdict A practical and partly novel three-level interpretable survival model; the decoupled training makes the population-level explanations marginal associations rather than additive components, so the paper overstates its case, but it is solid enough to merit a genuine referee. read the letter →
The pith
A machine-rendered reading of the paper's core claim, the machinery that carries it, and where it could break.
The reading
What carries the argument
The load-bearing object is the identity of Equation 4 together with the decoupled training scheme of Algorithm 1: each population-level hazard $\lambda(t|x_d;\varphi_d)$ is fit by maximizing its own marginal log-likelihood $\tilde\ell_d$ using only covariate $d$, and then the subgroup assignment network $f_{\theta}(x)$ and the $C\times D$ importance matrix $\beta$ (each row on a simplex) are fit to the full likelihood with the curves frozen. This ordering is what holds the model to an additive, interpretable form, because the mixture weights cannot reshape the individual curves. Two mechanisms support the identity in practice: an unbiased Monte-Carlo estimator for the cumulative-hazard integral, and a post-training refinement (Algorithm 2) that merges subgroups whose $\beta$ rows have correlation above a threshold $h$, which the authors prove leaves the likelihood unchanged when the rows are exactly equal. Orthogonal and entropy regularizers respectively spread patients across subgroups and keep the covariate weights from collapsing to a narrow set early in training.
What would settle it
Fit ADHAM on synthetic data with two correlated covariates whose true joint effects oppose their marginal effects (for example, either covariate alone predicts shorter times, but both together predict longer times). If the recovered population-level curves match the univariate marginals rather than the joint effects, the decoupled curves misstate covariate risk and the decomposition is not faithful. A cheaper corroborating check on real data: compare ADHAM's per-covariate curves with the per-covariate partial-dependence profiles of a flexible jointly-fit model; agreement supports the decomposition, while visible disagreement marks where it breaks.
Extended reading notes
Core claim
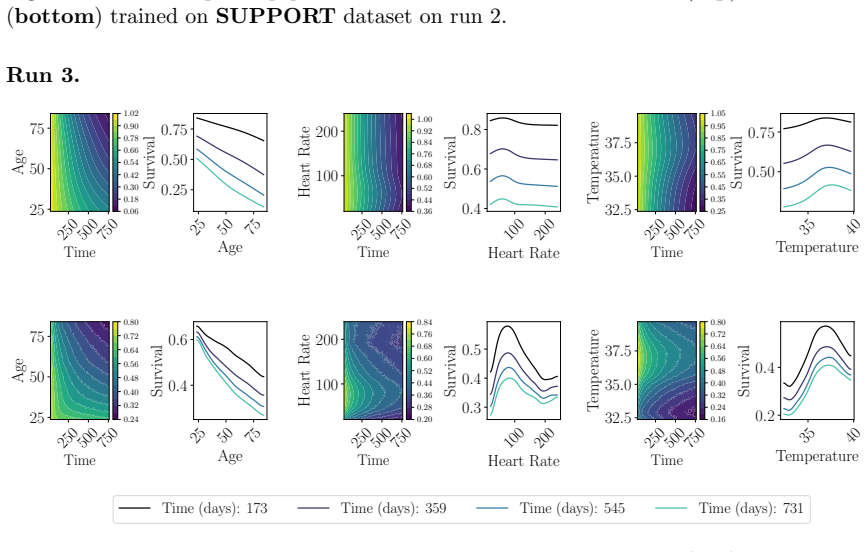
ADHAM's central object is the marginal-hazard identity $\lambda(t|x;\theta,\beta,\Phi)=\sum_{d=1}^{D}\sum_{c=1}^{C}\beta_{dc} f_{\theta c}(x)\lambda(t|x_d;\varphi_d)$, in which $\lambda(t|x_d;\varphi_d)$ is a neural hazard curve trained on covariate $d$ alone, $f_{\theta c}(x)$ is the probability that patient $x$ belongs to latent subgroup $c$, and $\beta_{dc}$ is the importance of covariate $d$ inside subgroup $c$. The paper's claim is that this compact decomposition gives all three levels of explanation from a single fitted model: the curves are population-level covariate effects, the rows of $\beta$ characterize the latent subgroups, and the per-patient weighted combination explains an individual's risk over time. To keep the decomposition from degenerating into arbitrary functions of all covariates, training is decoupled: each covariate curve is first fit by maximizing a likelihood that uses only that covariate, and only afterwards are the subgroup network and the $\beta$ weights fit to reweight the fixed curves. A post-training refinement merges subgroups whose $\beta$ rows are nearly identical, with a proof that exactly equal rows leave the data log-likelihood unchanged. The paper presents the explanations as associations learned from data, not as causal effects.
Load-bearing premise
The argument stands on treating each covariate's alone-fit curve as its true contribution inside the full model; if correlations with other covariates change how a covariate relates to risk, the population-level curves track only that covariate's crude association and can misattribute risk.
Editorial extensions
If this is right
- A single ADHAM model replaces the multi-model workflow: population, subgroup, and individual explanations all come from one set of fitted parameters, so explanations stay tied to the same model that makes the predictions.
- Because each covariate curve is learned from that covariate alone before weighting, the reported per-covariate hazard is stable in the presence of correlated features, directly addressing the concurvity limitation of additive models in survival analysis.
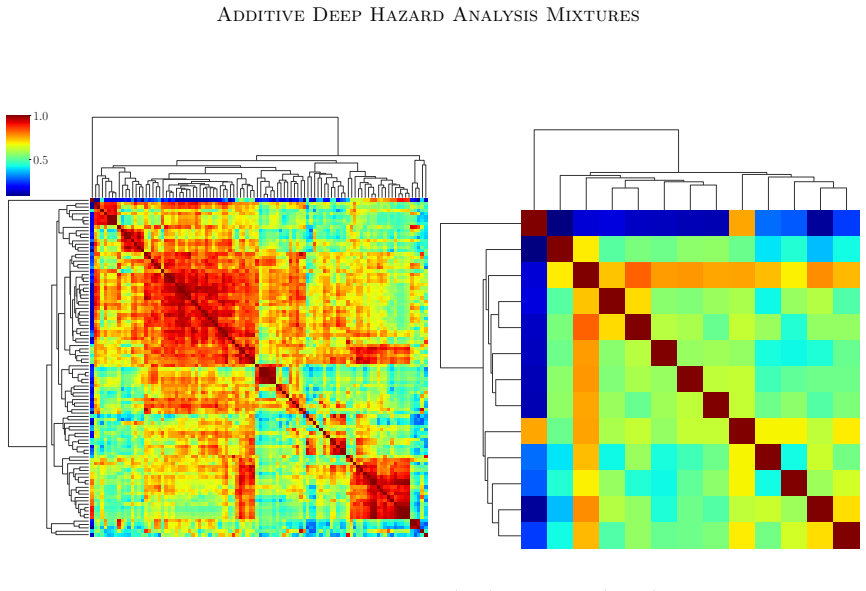
- Practitioners can train with many subgroups and choose the final number afterwards by picking the merge threshold $h$; the paper shows performance stays nearly flat as $h$ moves from 1 down to 0.65 while the subgroup count shrinks from 100 to about 11 on the SUPPORT dataset.
- The readouts are associative, not causal: the curves describe how risk tracks a covariate in the observed data, and should not be treated as the effect of intervening on that covariate.
- Among the interpretable baselines in the paper's tables (CoxPH, TimeNAM, TimeNA2M), regularized ADHAM posts the top metrics on most evaluations, while staying close to the best black-box comparator.
Reading between the lines
- Because the curves are fit one covariate at a time, they are marginal associations. In real data where a covariate's apparent effect flips or disappears once correlated covariates are adjusted for, ADHAM's population curves will show the univariate pattern; a clinician should read them as 'how risk tracks this measurement alone' rather than 'what this measurement does.'
- The same mixture identity extends naturally to competing risks: give each event type its own set of covariate curves and importance rows, and the model would yield three-level explanations for every competing outcome, a direction the paper explicitly leaves open.
- The refinement criterion measures redundancy in the explanation, not separability of the patients: merging rows of $\beta$ does not test whether the surviving subgroups are distinct in covariate space, so a companion check would apply the same correlation logic to the assignment distributions $f_{\theta}(x)$ within each subgroup.
- A direct stress test of the decoupling assumption is available: on synthetic data with two correlated covariates whose marginal and joint effects point in opposite directions, the recovered population curves reveal immediately whether univariate fits misattribute risk.
Signed reviews
Editorial analysis
A structured set of objections, weighed in public.
Referee Report
Summary. The paper proposes ADHAM, a survival model that combines per-covariate hazard networks with a latent subgroup assignment network. The marginal hazard is written as a weighted sum of univariate hazard functions, with subgroup-specific weights β and patient-specific assignment probabilities from a network f_θ. Training proceeds in two stages within a single loop: each univariate hazard λ(t|x_d;φ_d) is fit by maximizing its own marginal log-likelihood (Eq. 9), while the subgroup parameters θ,β are fit to the joint log-likelihood (Eq. 8). A post-training refinement merges subgroups whose β rows are similar, based on a correlation threshold. The paper claims interpretability at population, subgroup, and individual levels, and reports experiments on SUPPORT, FLCHAIN, and a CKD EHR dataset against ten baselines, concluding that regularized ADHAM is competitive with state-of-the-art interpretable survival models while also providing multi-level explanations.
Significance. If its interpretability claims are valid, ADHAM offers a practically useful combination: a single trained model that yields population-level covariate-risk curves, subgroup-specific importance profiles, and patient-level hazard decompositions, with a computationally cheap model-selection step. The paper has concrete strengths: code is provided; the likelihood is handled with the unbiased Monte Carlo estimator of Ketenci et al. (2023); the exact subgroup-merging proposition in Appendix C.1 is a correct algebraic identity; and the experimental appendix gives detailed hyperparameter settings and per-fold standard errors. The main risk is that the interpretability claim rests on treating univariate hazard fits as true additive components, which is not established for correlated covariates. The manuscript therefore needs substantial revision of its claims and additional validation before the central contribution can be regarded as supported.
major comments (2)
- [Section 3.3, Eq. (9), Algorithm 1] The claim that decoupled training 'overcomes concurvity' and yields population-level hazard shapes that 'purely capture covariate-specific trends in data' is not supported. Each λ(t|x_d;φ_d) is trained by maximizing the univariate likelihood ℓ_d in Eq. (9), so in the population limit it approximates the marginal conditional hazard E_{X_-d | T≥t, X_d=x_d}[λ_true(t|X_d,X_-d)], not an additive component of a joint hazard. When covariates are correlated, this marginal object can exhibit a strong gradient for a covariate with no direct effect, simply through confounding by an influential omitted covariate. Consequently, the population-level explanations in Figures 2 and 6 are marginal associations, and the decomposition in Eq. (4) does not isolate covariate-specific contributions in the usual additive-model sense. A second consequence is that Algorithm 1 fixes Φ at univariate optima and fits only θ and β to the joint objective, so ADHAM is not a maximum-likelihood estimator of Eq. (8). The limitation note in Section 6 that ADHAM is not causal does not resolve this issue, because the concern is about the faithfulness of the model's own additive decomposition, not about causal identification. I would recommend either explicitly reframing the interpretability claims as descriptive of the model's weighting of marginal hazard curves, or adding a simulation study with known additive components and correlated covariates to show whether and when the univariate fits recover the true components.
- [Abstract and Section 5, Tables 2–4] The abstract's statement that ADHAM 'remains on par with existing state-of-the-art survival baselines' is stronger than the results support. The body in Section 5 and contribution 4 appropriately restrict the claim to state-of-the-art interpretable survival models, and even there ADHAM(R) is not always the best (TIMENAM and TIMENA2M win on several Brier Score and AUROC entries). Against the black-box DHA baseline, ADHAM(R) trails on Brier Score and AUROC at all three quantiles on SUPPORT (Table 2: 25th quantile BS 0.144 vs 0.138, AUROC 0.666 vs 0.672; 50th quantile AUROC 0.644 vs 0.650) and similar patterns appear in Tables 3 and 4 for CKD and FLCHAIN. Please align the abstract and the contribution list with the 'interpretable baselines' framing, and report which of the differences against DHA are statistically significant given the standard errors in Appendix G.
minor comments (5)
- [Eq. (10)] The two regularization terms are subtracted from the objective, but no regularization weights or schedule is specified; please state how the magnitude of these terms is chosen and how they are combined with the log-likelihood.
- [Algorithm 2] The pseudo-code is hard to follow: the while condition `while T_{c*∈C*} c* ≠ {}` appears to contain corrupted notation, and the instruction `ρ_cc* ← Update entry to −∞` is underspecified. Please rewrite the merging procedure so that the pair collection and transitive merging steps are unambiguous.
- [Figure 2 and Section 3.2] The caption of Figure 2 refers to 'survival functions' but displays quantities labeled λ(t|x_id;φ_d), which according to Eq. (2) are hazards; please make the caption consistent with Eq. (2) and the survival function definition in Eq. (13).
- [Appendix A] In the notation table, the entry for D currently reads 'DEmpirical dataset', which merges the symbol with its meaning; please separate the symbol and the definition, and define C consistently as the number of subgroups throughout.
- [Section 5 and Appendix G] Statistical significance is assessed with a two-sided Welch t-test over only five folds; please report paired differences or confidence intervals where the bold/non-bold annotations are used, since some SEM values (e.g., ADHAM (R) on CKD at the 25th quantile, C-Index SEM 0.016) are large relative to the differences from the best baseline.
Circularity Check
No significant circularity: ADHAM's equations are model definitions and algebraic identities, and its fitted components are not dressed as predictions.
full rationale
ADHAM's central equation (4) is a model definition, not a derived prediction; the population-, subgroup-, and individual-level interpretability quantities in Eqs. (2)-(6) and Appendix D are algebraic rearrangements of that definition. The decoupled training in Eq. (9) is a deliberate estimation procedure: phi_d are fitted to univariate likelihoods and then held fixed while theta and beta are fit to the full likelihood. This is a misspecification and correctness concern (the univariate fits are marginal associations and may not equal additive components under correlated covariates), but it is not circular: the paper never claims these fits are parameter-free predictions or that the joint likelihood is maximized over Phi. The subgroup-merging proof in Appendix C.1 is a tautology in the good sense: it proves that merging groups with identical beta rows leaves the hazard unchanged, and the paper explicitly attributes this to model design rather than to empirical discovery. The only self-citations, Ketenci et al. 2023 for the Monte Carlo likelihood estimator and architecture, supply a standard stated estimator and are not used to justify the paper's own conclusions; no uniqueness theorem or ansatz is imported from the authors. Against external benchmarks (SUPPORT, FLCHAIN, CKD), predictive performance is evaluated empirically. No step reduces by construction to its own inputs, so the circularity score is 0.
Assumptions & free parameters
free parameters (5)
- Subgroup importance matrix β =
C×D learned matrix, e.g., 100×23 on SUPPORT
- Initial number of subgroups C =
100
- Refinement threshold h =
0.65 to 1.0 explored on SUPPORT
- Regularization weights =
Not reported
- Hazard network parameters Φ and assignment network θ =
Learned neural network weights
assumptions (4)
- ad hoc to paper The joint hazard decomposes as a first-order additive mixture of univariate hazard functions (Eq. 4).
- ad hoc to paper Each univariate hazard λ(t|x_d) trained in isolation is a valid representation of that covariate's effect in the joint model.
- standard math The importance-sampling likelihood estimator of Ketenci et al. (2023) is unbiased.
- domain assumption Merging subgroups with high β correlation preserves predictive performance.
Cite this review
Pith. "Pith review of ADHAM: Additive Deep Hazard Analysis Mixtures for Interpretable Survival Regression." pith.science (2026). https://pith.science/paper/4YIFJ3XS
@misc{pith2026250907108,
  author       = {Pith},
  title        = {Pith review of: ADHAM: Additive Deep Hazard Analysis Mixtures for Interpretable Survival Regression},
  year         = {2026},
  howpublished = {\url{https://pith.science/paper/4YIFJ3XS}},
  note         = {Machine review of arXiv:2509.07108}
}
read the original abstract
Survival analysis is a fundamental tool for modeling time-to-event outcomes in healthcare. Recent advances have introduced flexible neural network approaches for improved predictive performance. However, most of these models do not provide interpretable insights into the association between exposures and the modeled outcomes, a critical requirement for decision-making in clinical practice. To address this limitation, we propose Additive Deep Hazard Analysis Mixtures (ADHAM), an interpretable additive survival model. ADHAM assumes a conditional latent structure that defines subgroups, each characterized by a combination of covariate-specific hazard functions. To select the number of subgroups, we introduce a post-training refinement that reduces the number of equivalent latent subgroups by merging similar groups. We perform comprehensive studies to demonstrate ADHAM's interpretability at the population, subgroup, and individual levels. Extensive experiments on real-world datasets show that ADHAM provides novel insights into the association between exposures and outcomes. Further, ADHAM remains on par with existing state-of-the-art survival baselines in terms of predictive performance, offering a scalable and interpretable approach to time-to-event prediction in healthcare.
Figures


Figures from the paper (8 more)





Reference graph
Works this paper leans on
-
[1]
Nonparametric inference for a family of counting processes
Odd Aalen. Nonparametric inference for a family of counting processes. The Annals of Statistics, pages 701--726, 1978
work page 1978
-
[2]
Talal AA Abdullah, Mohd Soperi Mohd Zahid, and Waleed Ali. A review of interpretable ml in healthcare: taxonomy, applications, challenges, and future directions. Symmetry, 13 0 (12): 0 2439, 2021
work page 2021
-
[3]
Neural additive models: Interpretable machine learning with neural nets
Rishabh Agarwal, Levi Melnick, Nicholas Frosst, Xuezhou Zhang, Ben Lengerich, Rich Caruana, and Geoffrey E Hinton. Neural additive models: Interpretable machine learning with neural nets. Advances in neural information processing systems, 34: 0 4699--4711, 2021
2021
-
[4]
Interpretable machine learning in healthcare
Muhammad Aurangzeb Ahmad, Carly Eckert, and Ankur Teredesai. Interpretable machine learning in healthcare. In Proceedings of the 2018 ACM international conference on bioinformatics, computational biology, and health informatics, pages 559--560, 2018
work page 2018
-
[5]
Explainability for artificial intelligence in healthcare: a multidisciplinary perspective
Julia Amann, Alessandro Blasimme, Effy Vayena, Dietmar Frey, Vince I Madai, and Precise4Q Consortium. Explainability for artificial intelligence in healthcare: a multidisciplinary perspective. BMC medical informatics and decision making, 20: 0 1--9, 2020
work page 2020
-
[6]
Nitin Bansal, Xiaohan Chen, and Zhangyang Wang. Can we gain more from orthogonality regularizations in training deep networks? Advances in Neural Information Processing Systems, 31, 2018
work page 2018
-
[7]
Suresh K Bhavnani, Weibin Zhang, Shyam Visweswaran, Mukaila Raji, and Yong-Fang Kuo. A framework for modeling and interpreting patient subgroups applied to hospital readmission: visual analytical approach. JMIR Medical Informatics, 10 0 (12): 0 e37239, 2022
work page 2022
-
[8]
Pattern recognition and machine learning, volume 4
Christopher M Bishop and Nasser M Nasrabadi. Pattern recognition and machine learning, volume 4. Springer, 2006
2006
Show all 71 references
-
[9]
Verification of forecasts expressed in terms of probability
Glenn W Brier et al. Verification of forecasts expressed in terms of probability. Monthly weather review, 78 0 (1): 0 1--3, 1950
1950
-
[10]
Neural photo editing with introspective adversarial networks
Andrew Brock, Theodore Lim, James M Ritchie, and Nick Weston. Neural photo editing with introspective adversarial networks. arXiv preprint arXiv:1609.07093, 2016
2016 arXiv
-
[11]
Intelligible models for healthcare: Predicting pneumonia risk and hospital 30-day readmission
Rich Caruana, Yin Lou, Johannes Gehrke, Paul Koch, Marc Sturm, and Noemie Elhadad. Intelligible models for healthcare: Predicting pneumonia risk and hospital 30-day readmission. In Proceedings of the 21th ACM SIGKDD international conference on knowledge discovery and data mini...
2015
-
[12]
Survival analysis part i: basic concepts and first analyses
Taane G Clark, Michael J Bradburn, Sharon B Love, and Douglas G Altman. Survival analysis part i: basic concepts and first analyses. British journal of cancer, 89 0 (2): 0 232--238, 2003
2003
-
[13]
Polychemotherapy for early breast cancer: an overview of the randomised clinical trials with quality-adjusted survival analysis
Bernard F Cole, Richard D Gelber, Shari Gelber, Alan S Coates, and Aron Goldhirsch. Polychemotherapy for early breast cancer: an overview of the randomised clinical trials with quality-adjusted survival analysis. The Lancet, 358 0 (9278): 0 277--286, 2001
2001
-
[14]
Regression models and life-tables
David R Cox. Regression models and life-tables. Journal of the Royal Statistical Society: Series B (Methodological), 34 0 (2): 0 187--202, 1972
1972
-
[15]
Use of nonclonal serum immunoglobulin free light chains to predict overall survival in the general population
Angela Dispenzieri, Jerry A Katzmann, Robert A Kyle, Dirk R Larson, Terry M Therneau, Colin L Colby, Raynell J Clark, Graham P Mead, Shaji Kumar, L Joseph Melton III, et al. Use of nonclonal serum immunoglobulin free light chains to predict overall survival in the general popu...
2012
-
[16]
Survival analysis using auxiliary variables via multiple imputation, with application to aids clinical trial data
Cheryl L Faucett, Nathaniel Schenker, and Jeremy MG Taylor. Survival analysis using auxiliary variables via multiple imputation, with application to aids clinical trial data. Biometrics, 58 0 (1): 0 37--47, 2002
2002
-
[17]
Survival analysis in clinical trials: past developments and future directions
Thomas R Fleming and DY Lin. Survival analysis in clinical trials: past developments and future directions. Biometrics, 56 0 (4): 0 971--983, 2000
2000
-
[18]
Assessment and comparison of prognostic classification schemes for survival data
Erika Graf, Claudia Schmoor, Willi Sauerbrei, and Martin Schumacher. Assessment and comparison of prognostic classification schemes for survival data. Statistics in medicine, 18 0 (17-18): 0 2529--2545, 1999
1999
-
[19]
Proportional hazards tests and diagnostics based on weighted residuals
Patricia M Grambsch and Terry M Therneau. Proportional hazards tests and diagnostics based on weighted residuals. Biometrika, 81 0 (3): 0 515--526, 1994
1994
-
[20]
A sampling strategy to estimate the area and perimeter of irregularly shaped planar regions
Timothy G Gregoire and Harry T Valentine. A sampling strategy to estimate the area and perimeter of irregularly shaped planar regions. Forest science, 41 0 (3): 0 470--476, 1995
1995
-
[21]
Survival analysis with electronic health record data: Experiments with chronic kidney disease
Yolanda Hagar, David Albers, Rimma Pivovarov, Herbert Chase, Vanja Dukic, and No \'e mie Elhadad. Survival analysis with electronic health record data: Experiments with chronic kidney disease. Statistical Analysis and Data Mining: The ASA Data Science Journal, 7 0 (5): 0 385--...
2014
-
[22]
Effective ways to build and evaluate individual survival distributions
Humza Haider, Bret Hoehn, Sarah Davis, and Russell Greiner. Effective ways to build and evaluate individual survival distributions. J. Mach. Learn. Res., 21 0 (85): 0 1--63, 2020
2020
-
[23]
Survival mixture density networks
Xintian Han, Mark Goldstein, and Rajesh Ranganath. Survival mixture density networks. arXiv preprint arXiv:2208.10759, 2022
2022 arXiv
-
[24]
An evaluation of the doctor-interpretability of generalized additive models with interactions
Stefan Hegselmann, Thomas Volkert, Hendrik Ohlenburg, Antje Gottschalk, Martin Dugas, and Christian Ertmer. An evaluation of the doctor-interpretability of generalized additive models with interactions. In Machine Learning for Healthcare Conference, pages 46--79. PMLR, 2020
2020
-
[25]
Graphical methods for assessing violations of the proportional hazards assumption in cox regression
Kenneth R Hess. Graphical methods for assessing violations of the proportional hazards assumption in cox regression. Statistics in medicine, 14 0 (15): 0 1707--1723, 1995
1995
-
[26]
Random survival forests
Hemant Ishwaran, Udaya B Kogalur, Eugene H Blackstone, and Michael S Lauer. Random survival forests. The annals of applied statistics, 2 0 (3): 0 841--860, 2008
2008
-
[27]
Neural survival clustering: Non-parametric mixture of neural networks for survival clustering
Vincent Jeanselme, Brian Tom, and Jessica Barrett. Neural survival clustering: Non-parametric mixture of neural networks for survival clustering. In Conference on Health, Inference, and Learning, pages 92--102. PMLR, 2022
2022
-
[28]
Neural fine-gray: Monotonic neural networks for competing risks
Vincent Jeanselme, Chang Ho Yoon, Brian Tom, and Jessica Barrett. Neural fine-gray: Monotonic neural networks for competing risks. In Conference on Health, Inference, and Learning, pages 379--392. PMLR, 2023
2023
-
[29]
Competing risks: Impact on risk estimation and algorithmic fairness
Vincent Jeanselme, Brian Tom, and Jessica Barrett. Competing risks: Impact on risk estimation and algorithmic fairness. arXiv preprint arXiv:2508.05435, 2025
2025 arXiv
-
[30]
Coxnams: Interpretable deep learning model for survival analysis
Zhenjie Jiang. Coxnams: Interpretable deep learning model for survival analysis. Master's thesis, ETH Zurich, 2022
2022
-
[31]
Nonparametric estimation from incomplete observations
Edward L Kaplan and Paul Meier. Nonparametric estimation from incomplete observations. Journal of the American statistical association, 53 0 (282): 0 457--481, 1958
1958
-
[32]
Deepsurv: personalized treatment recommender system using a cox proportional hazards deep neural network
Jared L Katzman, Uri Shaham, Alexander Cloninger, Jonathan Bates, Tingting Jiang, and Yuval Kluger. Deepsurv: personalized treatment recommender system using a cox proportional hazards deep neural network. BMC medical research methodology, 18 0 (1): 0 1--12, 2018
2018
-
[33]
Maximum likelihood estimation of flexible survival densities with importance sampling
Mert Ketenci, Shreyas Bhave, Noemie Elhadad, and Adler Perotte. Maximum likelihood estimation of flexible survival densities with importance sampling. In Machine Learning for Healthcare Conference, pages 360--380. PMLR, 2023
2023
-
[34]
Adam: A method for stochastic optimization
Diederik P Kingma and Jimmy Ba. Adam: A method for stochastic optimization. arXiv preprint arXiv:1412.6980, 2014
2014 arXiv
-
[35]
The support prognostic model: Objective estimates of survival for seriously ill hospitalized adults
William A Knaus, Frank E Harrell, Joanne Lynn, Lee Goldman, Russell S Phillips, Alfred F Connors, Neal V Dawson, William J Fulkerson, Robert M Califf, Norman Desbiens, et al. The support prognostic model: Objective estimates of survival for seriously ill hospitalized adults. A...
1995
-
[36]
Feature selection algorithms in generalized additive models under concurvity
L \'a szl \'o Kov \'a cs. Feature selection algorithms in generalized additive models under concurvity. Computational Statistics, 39 0 (2): 0 461--493, 2024
2024
-
[37]
Survlime: A method for explaining machine learning survival models
Maxim S Kovalev, Lev V Utkin, and Ernest M Kasimov. Survlime: A method for explaining machine learning survival models. Knowledge-Based Systems, 203: 0 106164, 2020
2020
-
[38]
Survshap (t): time-dependent explanations of machine learning survival models
Mateusz Krzyzi \'n ski, Miko aj Spytek, Hubert Baniecki, and Przemys aw Biecek. Survshap (t): time-dependent explanations of machine learning survival models. Knowledge-Based Systems, 262: 0 110234, 2023
2023
-
[39]
havakv/pycox: Survival analysis with pytorch
H vard Kvamme. havakv/pycox: Survival analysis with pytorch. https://github.com/havakv/pycox, 11 2022
2022
-
[40]
Time-to-event prediction with neural networks and cox regression
H vard Kvamme, rnulf Borgan, and Ida Scheel. Time-to-event prediction with neural networks and cox regression. Journal of Machine Learning Research, 2019
2019
-
[41]
Deephit: A deep learning approach to survival analysis with competing risks
Changhee Lee, William Zame, Jinsung Yoon, and Mihaela Van Der Schaar. Deephit: A deep learning approach to survival analysis with competing risks. In Proceedings of the AAAI conference on artificial intelligence, volume 32, 2018
2018
-
[42]
Temporal quilting for survival analysis
Changhee Lee, William Zame, Ahmed Alaa, and Mihaela Schaar. Temporal quilting for survival analysis. In The 22nd international conference on artificial intelligence and statistics, pages 596--605. PMLR, 2019
2019
-
[43]
Spatio-temporally smoothed deep survival neural network
Yang Li, Dongzuo Liang, Shuangge Ma, and Chenjin Ma. Spatio-temporally smoothed deep survival neural network. Journal of Biomedical Informatics, 137: 0 104255, 2023
2023
-
[44]
A ccurate I ntelligible M odels w ith P airwise I nteractions
Yin Lou, Rich Caruana, Johannes Gehrke, and Giles Hooker. A ccurate I ntelligible M odels w ith P airwise I nteractions. In Proceedings of the 19th ACM SIGKDD International Conference on Knowledge Discovery and Data Mining, pages 623--631, 2013
2013
-
[45]
On the importance of interpretable machine learning predictions to inform clinical decision making in oncology
Sheng-Chieh Lu, Christine L Swisher, Caroline Chung, David Jaffray, and Chris Sidey-Gibbons. On the importance of interpretable machine learning predictions to inform clinical decision making in oncology. Frontiers in Oncology, 13: 0 1129380, 2023
2023
-
[46]
A unified approach to interpreting model predictions
Scott M Lundberg and Su-In Lee. A unified approach to interpreting model predictions. Advances in neural information processing systems, 30, 2017
2017
-
[47]
Asynchronous methods for deep reinforcement learning
Volodymyr Mnih, Adria Puigdomenech Badia, Mehdi Mirza, Alex Graves, Timothy Lillicrap, Tim Harley, David Silver, and Koray Kavukcuoglu. Asynchronous methods for deep reinforcement learning. In International conference on machine learning, pages 1928--1937. PmLR, 2016
1928
-
[48]
Combined survival analysis of prospective clinical trials of gefitinib for non--small cell lung cancer with egfr mutations
Satoshi Morita, Isamu Okamoto, Kunihiko Kobayashi, Koichi Yamazaki, Hajime Asahina, Akira Inoue, Koichi Hagiwara, Noriaki Sunaga, Noriko Yanagitani, Toyoaki Hida, et al. Combined survival analysis of prospective clinical trials of gefitinib for non--small cell lung cancer with...
2009
-
[49]
Modern hierarchical, agglomerative clustering algorithms
Daniel M \"u llner. Modern hierarchical, agglomerative clustering algorithms. arXiv preprint arXiv:1109.2378, 2011
2011 arXiv
-
[50]
Deep survival machines: Fully parametric survival regression and representation learning for censored data with competing risks
Chirag Nagpal, Xinyu Li, and Artur Dubrawski. Deep survival machines: Fully parametric survival regression and representation learning for censored data with competing risks. IEEE Journal of Biomedical and Health Informatics, 25 0 (8): 0 3163--3175, 2021 a
2021
-
[51]
Deep cox mixtures for survival regression
Chirag Nagpal, Steve Yadlowsky, Negar Rostamzadeh, and Katherine Heller. Deep cox mixtures for survival regression. In Machine Learning for Healthcare Conference, pages 674--708. PMLR, 2021 b
2021
-
[52]
Counterfactual phenotyping with censored time-to-events
Chirag Nagpal, Mononito Goswami, Keith Dufendach, and Artur Dubrawski. Counterfactual phenotyping with censored time-to-events. Proceedings of the 28th ACM SIGKDD Conference on Knowledge Discovery and Data Mining, 2022
2022
-
[53]
Hazard plotting for incomplete failure data
Wayne Nelson. Hazard plotting for incomplete failure data. Journal of Quality Technology, 1 0 (1): 0 27--52, 1969
1969
-
[54]
Using ehrs and machine learning for heart failure survival analysis
Maryam Panahiazar, Vahid Taslimitehrani, Naveen Pereira, and Jyotishman Pathak. Using ehrs and machine learning for heart failure survival analysis. Studies in health technology and informatics, 216: 0 40, 2015
2015
-
[55]
Extending the neural additive model for survival analysis with ehr data
Matthew Peroni, Marharyta Kurban, Sun Young Yang, Young Sun Kim, Hae Yeon Kang, and Ji Hyun Song. Extending the neural additive model for survival analysis with ehr data. arXiv preprint arXiv:2211.07814, 2022
2022 arXiv
-
[56]
Risk prediction for chronic kidney disease progression using heterogeneous electronic health record data and time series analysis
Adler Perotte, Rajesh Ranganath, Jamie S Hirsch, David Blei, and No \'e mie Elhadad. Risk prediction for chronic kidney disease progression using heterogeneous electronic health record data and time series analysis. Journal of the American Medical Informatics Association, 22 0...
2015
-
[57]
An effective meaningful way to evaluate survival models
Shi-ang Qi, Neeraj Kumar, Mahtab Farrokh, Weijie Sun, Li-Hao Kuan, Rajesh Ranganath, Ricardo Henao, and Russell Greiner. An effective meaningful way to evaluate survival models. arXiv preprint arXiv:2306.01196, 2023
2023 arXiv
-
[58]
The effect of concurvity in generalized additive models linking mortality to ambient particulate matter
Timothy O Ramsay, Richard T Burnett, and Daniel Krewski. The effect of concurvity in generalized additive models linking mortality to ambient particulate matter. Epidemiology, 14 0 (1): 0 18--23, 2003
2003
-
[59]
Survival regression with proper scoring rules and monotonic neural networks
David Rindt, Robert Hu, David Steinsaltz, and Dino Sejdinovic. Survival regression with proper scoring rules and monotonic neural networks. In International conference on artificial intelligence and statistics, pages 1190--1205. PMLR, 2022
2022
-
[60]
Clinical decision support in the era of artificial intelligence
Edward H Shortliffe and Martin J Sep \'u lveda. Clinical decision support in the era of artificial intelligence. Jama, 320 0 (21): 0 2199--2200, 2018
2018
-
[61]
Curve your enthusiasm: concurvity regularization in differentiable generalized additive models
Julien Siems, Konstantin Ditschuneit, Winfried Ripken, Alma Lindborg, Maximilian Schambach, Johannes Otterbach, and Martin Genzel. Curve your enthusiasm: concurvity regularization in differentiable generalized additive models. Advances in Neural Information Processing Systems,...
2023
-
[62]
Survival analysis in clinical trials: Basics and must know areas
Ritesh Singh and Keshab Mukhopadhyay. Survival analysis in clinical trials: Basics and must know areas. Perspectives in clinical research, 2 0 (4): 0 145--148, 2011
2011
-
[63]
Association of body temperature and mortality in critically ill patients: an observational study using two large databases
Daniel J Tan, Jiayang Chen, Yirui Zhou, Jaryl Shen Quan Ong, Richmond Jing Xuan Sin, Thach V Bui, Anokhi Amit Mehta, Mengling Feng, and Kay Choong See. Association of body temperature and mortality in critically ill patients: an observational study using two large databases. E...
2024
-
[64]
All points matter: entropy-regularized distribution alignment for weakly-supervised 3d segmentation
Liyao Tang, Zhe Chen, Shanshan Zhao, Chaoyue Wang, and Dacheng Tao. All points matter: entropy-regularized distribution alignment for weakly-supervised 3d segmentation. Advances in Neural Information Processing Systems, 36: 0 78657--78673, 2023
2023
-
[65]
What clinicians want: contextualizing explainable machine learning for clinical end use
Sana Tonekaboni, Shalmali Joshi, Melissa D McCradden, and Anna Goldenberg. What clinicians want: contextualizing explainable machine learning for clinical end use. In Machine learning for healthcare conference, pages 359--380. PMLR, 2019
2019
-
[66]
On the c-statistics for evaluating overall adequacy of risk prediction procedures with censored survival data
Hajime Uno, Tianxi Cai, Michael J Pencina, Ralph B D'Agostino, and Lee-Jen Wei. On the c-statistics for evaluating overall adequacy of risk prediction procedures with censored survival data. Statistics in medicine, 30 0 (10): 0 1105--1117, 2011
2011
-
[67]
Survnam: The machine learning survival model explanation
Lev V Utkin, Egor D Satyukov, and Andrei V Konstantinov. Survnam: The machine learning survival model explanation. Neural Networks, 147: 0 81--102, 2022
2022
-
[68]
Survival prediction in terminal cancer patients: a systematic review of the medical literature
Antonio Vigan \`o , Marlene Dorgan, Jeanette Buckingham, Eduardo Bruera, and Maria E Suarez-Almazor. Survival prediction in terminal cancer patients: a systematic review of the medical literature. Palliative Medicine, 14 0 (5): 0 363--374, 2000
2000
-
[69]
Scipy 1.0: fundamental algorithms for scientific computing in python
Pauli Virtanen, Ralf Gommers, Travis E Oliphant, Matt Haberland, Tyler Reddy, David Cournapeau, Evgeni Burovski, Pearu Peterson, Warren Weckesser, Jonathan Bright, et al. Scipy 1.0: fundamental algorithms for scientific computing in python. Nature methods, 17 0 (3): 0 261--272, 2020
2020
-
[70]
Survtrace: Transformers for survival analysis with competing events
Zifeng Wang and Jimeng Sun. Survtrace: Transformers for survival analysis with competing events. In Proceedings of the 13th ACM International Conference on Bioinformatics, Computational Biology and Health Informatics, pages 1--9, 2022
2022
-
[71]
Coxnam: An interpretable deep survival analysis model
Liangchen Xu and Chonghui Guo. Coxnam: An interpretable deep survival analysis model. Expert Systems with Applications, page 120218, 2023
2023
Reviewed August 15, 2026 · model on record in the stance chip above.
Discussion (0). Continue with ORCID to comment.