REVIEW 4 major objections 3 minor 47 references
An Open Benchmark Dataset for GeoAI Foundation Models for Oil Palm Mapping in Indonesia
T0 review · 4 major / 3 minor · reviewed 2026-08-04 · deepseek-v4-flash
Pith's one-line read An open, expert-labeled polygon benchmark for oil palm in Indonesia reports 83 percent overall accuracy and 96 percent recall for oil palm across six land cover classes.
desk verdict A genuinely open, polygon-level oil palm reference dataset that fills a real gap, but the validation counts don't add up and the benchmarking claim is not in the paper. read the letter →
The pith
A machine-rendered reading of the paper's core claim, the machinery that carries it, and where it could break.
The reading
What carries the argument
The carrying object is the dataset itself: a vector polygon layer with a hierarchical land cover typology and wall-to-wall coverage of 6x6 km grid cells. The typology does the analytical work, because it lets the benchmark separate visually similar classes (mature versus initial oil palm; oil palm versus rubber, coconut, cacao) and record uncertainty explicitly with an 'unknown' branch. The QA/QC pipeline—double annotation, consensus review, confidence flags, field points—plus the accuracy assessment using Collect Earth Online and stratified random 50x50 m plots supplies the evidence that this is a benchmark rather than a bag of polygons. The hierarchy is what makes it usable for training se
What would settle it
A concrete check: reconcile the validation sample count—the text states 4,800 stratified plots, but Table 3 sums to 5,310 reference observations—and recompute OA, Kappa, PA, and UA from the corrected matrix. A second, stronger test: have an independent field team re-label a random subset of the same polygons or plots and measure agreement; if oil palm agreement drops materially, the benchmark's claimed reliability is not confirmed.
Extended reading notes
Core claim
The core contribution is not a new classifier but a labeled benchmark. The authors assembled 52,225 polygons covering about 260,000 hectares of annotated land in two provinces, with a Level 1/2/3 typology that separates six aggregated classes for validation—oil palm, built-up, cropland, natural forest, shrubland, and other—while retaining finer distinctions at annotation time, such as mature versus initial planting oil palm, rubber, coconut, cacao, rice, mangrove, and wetland. Wall-to-wall digitization means every pixel in selected 6x6 km grid cells is labeled, not just point samples. Quality was managed through double annotation of about 25% of grid cells, supervisor review, uncertainty fla
Load-bearing premise
The load-bearing premise is that expert visual interpretation of Planet NICFI and Sentinel-2 imagery, using the paper's interpretation key, produces reference labels accurate enough to train and judge machine learning models; if that human labeling is materially noisier than assumed, the benchmark's value collapses, and the validation does not independently test this premise because it uses the same interpretation approach.
Editorial extensions
If this is right
- Models trained on these polygon labels can be fine-tuned on Planet NICFI or Sentinel-2 imagery to produce dense oil palm maps, not just point estimates.
- The standard splits and documented interpretation key allow direct comparison of RF, U-Net, and vision transformer baselines across the same reference data.
- Because maturity stage is recorded, the same dataset can support temporal analyses of plantation expansion and conversion-year estimates.
- The inclusion of rubber, coconut, cacao, and other crops as explicit confounders should push classifiers to learn texture and context rather than simple spectral signatures.
- As an openly licensed CC-BY resource, the dataset can serve as auditable ground truth for EU deforestation regulation and similar compliance frameworks.
Reading between the lines
- Editorial inference: the reported 4,800 validation plots cannot be reconciled with the 5,310 entries in the confusion matrix; recomputing accuracies from the actual matrix totals would either strengthen or revise the headline 0.83/0.76 figures.
- Editorial inference: because the sampling of grid cells was opportunistic, accuracy figures are not unbiased estimates of landscape-level area; users should treat the dataset as a pattern-learning resource, not as a basis for national area statistics.
- Editorial inference: if the label noise is materially higher than assumed, the benchmark value for foundation-model fine-tuning drops; a quick test would be independent field-plot re-labeling of a random subset of polygons in Riau and West Sulawesi.
- Editorial inference: the same wall-to-wall, hierarchy-first recipe could be transplanted to other smallholder-dominated tree-crop landscapes, such as cocoa or rubber in West Africa, where point-based reference sets are even scarcer.
Editorial analysis
A structured set of objections, weighed in public.
Referee Report
Summary. The paper presents an open vector dataset of oil palm and related land-cover polygons in Riau and West Sulawesi, Indonesia, produced by wall-to-wall manual digitization of 6×6 km grid cells using Planet NICFI, Sentinel-2, and very high-resolution imagery. The authors describe a hierarchical land-cover typology, a multi-stage QA/QC workflow, and an accuracy assessment based on visual interpretation of 50 m×50 m plots. Headline results are OA 0.83, Kappa 0.76, and oil palm PA 0.96/UA 0.88. The Zenodo record includes vector files, metadata, scripts, and Google Earth Engine links, and the data are released under CC-BY 4.0.
Significance. If the validation evidence were clean, this would be a valuable contribution: it is among the few open, polygon-level, wall-to-wall oil-palm training datasets for Indonesia, with a hierarchical class scheme that separates mature and initial oil palm and includes important confounders. The two-province design and the shipped scripts and documentation directly address a recognized gap for GeoAI foundation models. However, the accuracy claims currently rest on an internally inconsistent and non-independent validation sample; until that is fixed, the contribution cannot be taken as a benchmark-grade dataset.
major comments (4)
- [§3, Table 3] The accuracy assessment text states a stratified random sample of 4,800 50×50 m plots with one sample point per plot, but the confusion matrix in Table 3 sums to 5,310 observations. If the 25% overlap produced additional observations, the total would be 6,000, not 5,310. The reported OA (4,421/5,310 = 0.83) and Kappa (0.76) are computed over 5,310 labels. It is not explained whether the 510 extra labels are duplicate interpretations of overlapped plots, and if so, they are not independent. This directly affects standard errors and confidence intervals for the headline accuracy figures, and it is load-bearing because Table 3 is the paper's main quantitative quality argument. Please reconcile the sample size, state whether duplicates were excluded, and recompute accuracy with design-based variance that accounts for clustering/overlap.
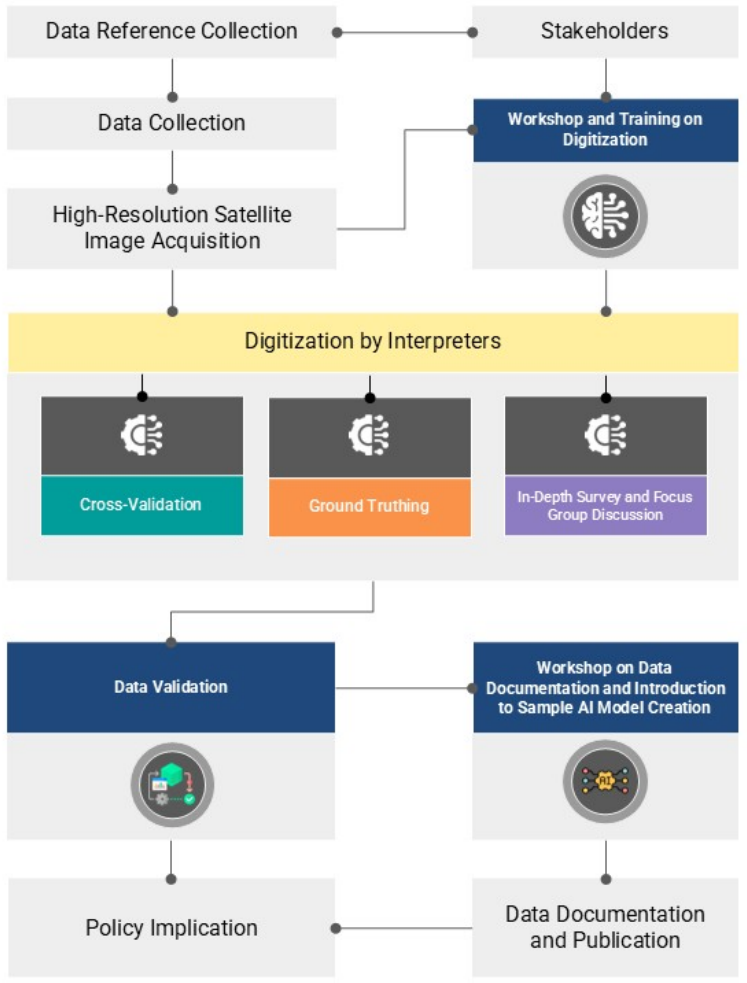
- [§2.3–2.5, §3] The validation reference was generated by CEO visual interpretation of very high-resolution satellite imagery using the same custom interpretation key and the same imagery sources as the original annotation. The field validation mentioned in §2.5 is not quantified and is not used in Table 3. The reported accuracy is therefore primarily an inter-annotator consistency measure rather than an independent test of label accuracy. Because the central claim is a high-quality reference dataset, the paper should either report inter-annotator agreement metrics from the overlap sample or provide a separately field-validated subset with explicit error counts. Without this, OA/Kappa may be optimistically biased by shared interpretation rules.
- [§2.5, §3] Both §2.5 and §3 state that overlapping plots or grid cells were used to 'evaluate agreement' and cross-validate, and §2.5 says CEO's agreement metrics were compared, but no agreement statistic is reported anywhere in the paper. This makes the QA/QC claims untestable. A simple percent agreement or Cohen's/Fleiss kappa on the overlap sample would be easy to add and would directly support the multi-interpreter consistency claim.
- [§3 Table 2, §4, §5] Data Records contradicts the main dataset statistics: §3 reports 52,225 polygons covering 259,991.12 ha (≈2,600 km²), while §4 says the dataset contains 'on the order of a few thousand polygons, spanning an area of several hundred square kilometers'. Section 5 also refers to 'standard splits' and 'benchmarking protocols', but no split definitions or evaluation protocols are described in the text or the data records. Please correct the order-of-magnitude description and specify the actual standard splits and evaluation protocol, or remove the claim.
minor comments (3)
- [Abstract, §2.5] The abstract says quality was ensured through 'multi-interpreter consensus and field validation', but field validation is described only anecdotally and is not quantified. Qualify the wording as image-based QA with selected field checks.
- [§3] The text mentions validation 'across 72 grids', but the number of selected grid cells and their distribution between Riau and West Sulawesi are not stated. Please report the spatial allocation of the validation sample.
- [§3, Table 2] The paper says there are fifteen land cover types, but Table 2 lists 15 rows while Table 1's typology includes an 'Unknown' branch. Clarify whether 'Unknown' labels are included in the validation and how they are handled in the six-class aggregation.
Circularity Check
No material circularity: no derivation chain reduces to inputs; validation is empirical. Minor self-referential validation protocol and an internal sample-count discrepancy are quality concerns, not circularity.
full rationale
This is a dataset-description paper, not a modeled prediction derived from fitted parameters; there is no equation-level derivation chain to walk. The claimed contribution is the open polygon dataset, and the headline accuracies (OA 0.83, Kappa 0.76, oil palm PA 0.96 / UA 0.88; Section 3, Table 3) are empirical accuracy assessments of reference labels, not quantities constructed from the dataset by definition. The only self-citations (Poortinga et al. 2019/2021; Saah et al. 2019; Wafiq et al. 2025 Zenodo record) are methodological or repository citations and are not load-bearing. Two genuine concerns are present but do not meet the circularity bar. First, the validation reference is generated by CEO visual interpretation using the same custom interpretation key as the original annotations (Sections 2.3–2.5 and 3), so OA primarily measures inter-annotator/protocol consistency rather than independent external accuracy; field validation is mentioned but not quantified or incorporated into Table 3. Second, Section 3 states a stratified random sample of 4,800 plots, yet Table 3's confusion matrix sums to 5,310, and the described 25% overlap/re-assignment to multiple interpreters is a plausible source of duplicate/non-independent observations. These issues could bias the accuracy estimates and should be corrected, but they are correctness/independence limitations, not cases of a prediction being equivalent to its input by construction. Therefore no circular step is identified.
Assumptions & free parameters
assumptions (3)
- domain assumption Visual interpretation of 4.7-10 m satellite imagery using the hierarchical interpretation key yields sufficiently accurate land cover labels.
- domain assumption The opportunistic selection of 6x6 km grid cells biased toward known oil palm areas and cloud-free imagery is adequate for training and benchmarking models.
- domain assumption The hierarchical typology's visual distinctions, such as mature versus initial palm and oil palm versus rubber/coconut, are separable in the available imagery.
Cite this review
Pith. "Pith review of An Open Benchmark Dataset for GeoAI Foundation Models for Oil Palm Mapping in Indonesia." pith.science (2026). https://pith.science/paper/2PVL3RUE
@misc{pith2026250908303,
  author       = {Pith},
  title        = {Pith review of: An Open Benchmark Dataset for GeoAI Foundation Models for Oil Palm Mapping in Indonesia},
  year         = {2026},
  howpublished = {\url{https://pith.science/paper/2PVL3RUE}},
  note         = {Machine review of arXiv:2509.08303}
}
read the original abstract
Oil palm cultivation remains one of the leading causes of deforestation in Indonesia. To better track and address this challenge, detailed and reliable mapping is needed to support sustainability efforts and emerging regulatory frameworks. We present an open-access geospatial dataset of oil palm plantations and related land cover types in Indonesia, produced through expert labeling of high-resolution satellite imagery from 2020 to 2024. The dataset provides polygon-based, wall-to-wall annotations across a range of agro-ecological zones and includes a hierarchical typology that distinguishes oil palm planting stages as well as similar perennial crops. Quality was ensured through multi-interpreter consensus and field validation. The dataset was created using wall-to-wall digitization over large grids, making it suitable for training and benchmarking both conventional convolutional neural networks and newer geospatial foundation models. Released under a CC-BY license, it fills a key gap in training data for remote sensing and aims to improve the accuracy of land cover types mapping. By supporting transparent monitoring of oil palm expansion, the resource contributes to global deforestation reduction goals and follows FAIR data principles.
Figures


Reference graph
Works this paper leans on
-
[1]
Sinan A Abood, Janice Ser Huay Lee, Zuzana Burivalova, John Garcia-Ulloa, and Lian Pin Koh. Relative contributions of the logging, fiber, oil palm, and mining industries to forest loss in indonesia. Conservation letters, 8 0 (1): 0 58--67, 2015
work page 2015
-
[2]
K. Anas, H. Naping, D. Salman, and N. Tenriwaru. Impact of palm plantations in west sulawesi province: A preliminary study. In IOP Conference Series: Earth and Environmental Science, volume 1134, page 012047. IOP Publishing, 2023. doi:10.1088/1755-1315/1134/1/012047
-
[3]
A. F. Aulia, H. Sandhu, and A. C. Millington. Quantifying the economic value of ecosystem services in oil palm dominated landscapes in riau province in sumatra, indonesia. Land, 9 0 (6): 0 194, 2020. doi:10.3390/land9060194
-
[4]
What causes deforestation in indonesia? Environmental Research Letters, 14 0 (2): 0 024007, 2019
Kemen G Austin, Amanda Schwantes, Yaofeng Gu, and Prasad S Kasibhatla. What causes deforestation in indonesia? Environmental Research Letters, 14 0 (2): 0 024007, 2019
work page 2019
-
[5]
F. Bainta. Economy and environmental impacts of oil palm plantation expansion in mamuju tengah district, west sulawesi province, indonesia. In IOP Conference Series: Earth and Environmental Science, volume 575, page 012046. IOP Publishing, 2020. doi:10.1088/1755-1315/575/1/012046
-
[6]
K. Berger, M. Herold, and Z. Szantoi. Earth observation as enabler for implementing the eu regulation on deforestation-free products. npj Climate Action, 4 0 (1): 0 68, 2025. doi:10.1038/s44168-025-00168-9
-
[7]
A comprehensive GeoAI review: Progress, Challenges and Outlooks
Abdennasser Boutayeb, Imane Lahsen-Cherif, and Abdelilah El Khadimi. A comprehensive geoai review: Progress, challenges and outlooks. arXiv preprint arXiv:2412.11643, 2024
work page Pith review arXiv 2024
-
[8]
S. Chan, W. Zhou, Y. Lei, C. Li, J. Hu, and F. Hong. Sparse point annotations for remote sensing image segmentation. Scientific Reports, 15 0 (1): 0 27347, 2025. doi:10.1038/s41598-025-27347-9
Show all 47 references
-
[9]
Is cambodia the world's largest cashew producer? arXiv preprint arXiv:2405.16926, 2024
Veasna Chaya, Ate Poortinga, Keo Nimol, Se Sokleap, Mon Sophorn, Phy Chhin, Andrea McMahon, Andrea Puzzi Nicolau, Karis Tenneson, and David Saah. Is cambodia the world's largest cashew producer? arXiv preprint arXiv:2405.16926, 2024
2024 arXiv
-
[10]
Cheng, L
Y. Cheng, L. Yu, Y. Xu, H. Lu, A. P. Cracknell, K. Kanniah, and P. Gong. Mapping oil palm plantation expansion in Malaysia over the past decade (2007--2016) using ALOS-1/2 PALSAR-1/2 data. International Journal of Remote Sensing, 40 0 (19): 0 7389--7408, 2019
2007
-
[11]
A community palm model
Nicholas Clinton, Andreas Vollrath, Remi D'annunzio, Desheng Liu, Henry B Glick, Adri \`a Descals, Alicia Sullivan, Oliver Guinan, Jacob Abramowitz, Fred Stolle, et al. A community palm model. arXiv preprint arXiv:2405.09530, 2024
2024 arXiv
-
[12]
Danylo, J
O. Danylo, J. Pirker, G. Lemoine, G. Ceccherini, L. See, I. McCallum, and S. Fritz. A map of the extent and year of detection of oil palm plantations in indonesia, malaysia and thailand. Scientific Data, 8 0 (1): 0 96, 2021
2021
-
[13]
Descals, Z
A. Descals, Z. Szantoi, E. Meijaard, H. Sutikno, G. Rindanata, and S. Wich. Oil palm (elaeis guineensis) mapping with details: smallholder versus industrial plantations and their extent in riau, sumatra. Remote Sensing, 11 0 (21): 0 2590, 2019. doi:10.3390/rs11212590
2019 doi
-
[14]
Global mapping of oil palm planting year from 1990 to 2021
Adri \`a Descals, David LA Gaveau, Serge Wich, Zoltan Szantoi, and Erik Meijaard. Global mapping of oil palm planting year from 1990 to 2021. Earth System Science Data Discussions, 2024: 0 1--24, 2024
1990
-
[15]
Serhani, Elarbi Badidi, Jamal Riffi, and Hamid Tairi
Omar Elharrouss, Yassir Mahmood, Yassine Bechqito, Mohamed A. Serhani, Elarbi Badidi, Jamal Riffi, and Hamid Tairi. Loss functions in deep learning: A comprehensive review. arXiv preprint arXiv:2504.04242, 2025
2025 arXiv
-
[16]
Oil palm expansion among smallholder farmers in sumatra, indonesia
Michael Euler, Stefan Schwarze, Hermanto Siregar, and Matin Qaim. Oil palm expansion among smallholder farmers in sumatra, indonesia. Journal of Agricultural Economics, 67 0 (3): 0 658--676, 2016
2016
-
[17]
Why do farmers prefer oil palm? lessons learnt from bungo district, indonesia
Laur \`e ne Feintrenie, Wan Kian Chong, and Patrice Levang. Why do farmers prefer oil palm? lessons learnt from bungo district, indonesia. Small-scale forestry, 9 0 (3): 0 379--396, 2010
2010
-
[18]
E. Ferrara. Fairness and bias in artificial intelligence: A brief survey of sources, impacts, and mitigation strategies. Sci, 6 0 (1): 0 3, 2024. doi:10.3390/sci6010003
2024 doi
-
[19]
Oil palm and land use change in indonesia, malaysia and papua new guinea
Petrus Gunarso, Manjela Eko Hartoyo, Fahmuddin Agus, and Timothy J Killeen. Oil palm and land use change in indonesia, malaysia and papua new guinea. Reports from the Technical Panels of the 2nd greenhouse gas working Group of the Roundtable on Sustainable Palm Oil (RSPO), 29, 2013
2013
-
[20]
Hooijer, S
A. Hooijer, S. Page, J. Jauhiainen, W. A. Lee, X. X. Lu, A. Idris, and G. Anshari. Subsidence and carbon loss in drained tropical peatlands. Biogeosciences, 9 0 (3): 0 1053--1071, 2012. doi:10.5194/bg-9-1053-2012
2012 doi
-
[21]
Huang, X
J. Huang, X. Y. Ping, and H. H. Chang. The application of machine learning to educational process data analysis: A systematic review. Education Sciences, 15 0 (7): 0 888, 2025. doi:10.3390/educsci15070888
2025 doi
-
[22]
Ikkala, A
L. Ikkala, A. K. Ronkanen, O. Utriainen, B. Kl ve, and H. Marttila. Peatland subsidence enhances cultivated lowland flood risk. Soil and Tillage Research, 212: 0 105078, 2021. doi:10.1016/j.still.2021.105078
2021
-
[23]
Foundation models for generalist geospatial artificial intelligence
Johannes Jakubik, Sujit Roy, CE Phillips, Paolo Fraccaro, Denys Godwin, Bianca Zadrozny, Daniela Szwarcman, Carlos Gomes, Gabby Nyirjesy, Blair Edwards, et al. Foundation models for generalist geospatial artificial intelligence. arXiv preprint arXiv:2310.18660, 2023
2023 arXiv
-
[24]
W. Li, R. Dong, H. Fu, and L. Yu. Large-scale oil palm tree detection from high-resolution satellite images using two-stage convolutional neural networks. Remote Sensing, 11 0 (1): 0 11, 2018. doi:10.3390/rs11010011
2018 doi
-
[25]
R. S. Lunetta and J. G. Lyon. Remote Sensing and GIS Accuracy Assessment. CRC Press, 2004
2004
-
[26]
Olofsson, P
P. Olofsson, P. Ar \'e valo, A. B. Espejo, C. Green, E. Lindquist, R. E. McRoberts, and M. J. Sanz. Mitigating the effects of omission errors on area and area change estimates. Remote Sensing of Environment, 236: 0 111492, 2020
2020
-
[27]
Foody, Martin Herold, Stephen V
Pontus Olofsson, Giles M. Foody, Martin Herold, Stephen V. Stehman, Curtis E. Woodcock, and Michael A. Wulder. Good practices for estimating area and assessing accuracy of land change. Remote Sensing of Environment, 148: 0 42--57, 2014. doi:10.1016/j.rse.2014.02.015
2014 doi
-
[28]
O’Connor, K
B. O’Connor, K. Moul, B. Pollini, X. de Lamo, W. Simonson, H. Allison, and J. McGlade. Earth observation for SDG---Compendium of Earth Observation Contributions to the SDG Targets and Indicators. European Space Agency (ESA), Harwell, UK, 2020
2020
-
[29]
Papoutsis, N
I. Papoutsis, N. I. Bountos, A. Zavras, D. Michail, and C. Tryfonopoulos. Benchmarking and scaling of deep learning models for land cover image classification. ISPRS Journal of Photogrammetry and Remote Sensing, 195: 0 250--268, 2023. doi:10.1016/j.isprsjprs.2022.11.012
2023 doi
-
[30]
Poortinga, K
A. Poortinga, K. Tenneson, A. Shapiro, Q. Nguyen, K. San Aung, F. Chishtie, and D. Saah. Mapping plantations in myanmar by fusing landsat-8, sentinel-2 and sentinel-1 data along with systematic error quantification. Remote Sensing, 11 0 (7): 0 831, 2019
2019
-
[31]
Nicolau, John Dilger, Karis Tenneson, Nicholas Clinton, et al
Ate Poortinga, Nyein Soe Thwal, Nishanta Khanal, Timothy Mayer, Biplov Bhandari, Kel Markert, Andrea P. Nicolau, John Dilger, Karis Tenneson, Nicholas Clinton, et al. Mapping sugarcane in thailand using transfer learning, a lightweight convolutional neural network, nicfi high-...
2021
-
[32]
Radoux, F
J. Radoux, F. Waldner, and P. Bogaert. How response designs and class proportions affect the accuracy of validation data. Remote Sensing, 12 0 (2): 0 257, 2020. doi:10.3390/rs12020257
2020 doi
-
[33]
The livelihood impacts of oil palm: smallholders in indonesia
Lucy Rist, Laur \`e ne Feintrenie, and Patrice Levang. The livelihood impacts of oil palm: smallholders in indonesia. Biodiversity and conservation, 19 0 (4): 0 1009--1024, 2010
2010
-
[34]
Collect earth: An online tool for systematic reference data collection in land cover and use applications
David Saah, Greg Johnson, Brent Ashmall, Gopal Tondapu, Karis Tenneson, Mike Patterson, Peter Potapov, Tom Curtis, and Farrukh Chishtie. Collect earth: An online tool for systematic reference data collection in land cover and use applications. Environmental Modelling & Softwar...
2019 doi
-
[35]
S. V. Stehman. Sampling designs for accuracy assessment of land cover. International Journal of Remote Sensing, 30 0 (20): 0 5243--5272, 2009
2009
-
[36]
Digital applications unlock remote sensing ai foundation models for scalable environmental monitoring
Benjamin Strong, Edward Boyda, Cameron Kruse, Tom Ingold, and Mikel Maron. Digital applications unlock remote sensing ai foundation models for scalable environmental monitoring. Frontiers in Climate, 7: 0 1520242, 2025. doi:10.3389/fclim.2025.1520242
2025
-
[37]
Land use and land cover change implications on agriculture and natural resource management of koah nheaek, mondulkiri province, cambodia
Vanna Teck, Ate Poortinga, Carlos Riano, Kshitij Dahal, Richelle Marie B Legaspi, Vannak Ann, and Ratha Chea. Land use and land cover change implications on agriculture and natural resource management of koah nheaek, mondulkiri province, cambodia. Remote Sensing Applications: ...
2023
-
[38]
Managing south-east asia’s savannas: challenges and holistic approaches through community-based fire management
Marina Tornorsam, Thi Thuy Nguyen, Ate Poortinga, Vanessa Machuca, Enikoe Bihari, Karis Tenneson, Hanh Quyen Nguyen, Thomas Buchholz, David Saah, Peter Cutter, et al. Managing south-east asia’s savannas: challenges and holistic approaches through community-based fire managemen...
2024
-
[39]
Matin, Nishanta Khanal, Sajana Maharjan, Birendra Bajracharya, Karis Tenneson, Ate Poortinga, Nguyen Hanh Quyen, Raja Ram Aryal, David Saah, et al
Kabir Uddin, Mir A. Matin, Nishanta Khanal, Sajana Maharjan, Birendra Bajracharya, Karis Tenneson, Ate Poortinga, Nguyen Hanh Quyen, Raja Ram Aryal, David Saah, et al. Regional land cover monitoring system for hindu kush himalaya. In Earth Observation Science and Applications ...
2021
-
[40]
Warizmi Wafiq, P
M. Warizmi Wafiq, P. Cutter, A. Poortinga, D. M. G. dela Torre, K. Tenneson, V. Teck, E. Bihari, C. Saisaward, W. Suaruang, A. McMahon, M. Andi Vika Faradiba, K. B. Batiran, C. A, Q. Nurul, M. Arya Arismaya, D. Ganz, and D. Saah. Open land use reference dataset for palm oil la...
2025 doi
-
[41]
Weerakitikul, W
B. Weerakitikul, W. Koedsin, R. J. Ritchie, E. Kokkaew, and J. C. W. Chan. Multi-sensor remote sensing approach for oil palm mapping and stand age detection using 38-year landsat and sentinel time series data in the google earth engine. Geomatica, page 100070, 2025
2025
-
[42]
Wiratama, M
W. Wiratama, M. K. Chong, Y. L. Lim, and C. J. Ho. Comparative analysis of fine-tuned foundation models for land cover classification using sentinel-2 imagery, study area: Sumatra and kalimantan, indonesia. In The International Archives of the Photogrammetry, Remote Sensing an...
2025 doi
-
[43]
Foundation models for remote sensing and earth observation: A survey
Aoran Xiao, Weihao Xuan, Junjue Wang, Jiaxing Huang, Dacheng Tao, Shijian Lu, and Naoto Yokoya. Foundation models for remote sensing and earth observation: A survey. IEEE Geoscience and Remote Sensing Magazine, 2025
2025
-
[44]
Y. Xu, L. Yu, W. Li, P. Ciais, Y. Cheng, and P. Gong. Annual oil palm plantation maps in Malaysia and Indonesia from 2001 to 2016. Earth System Science Data, 12 0 (2): 0 847--867, 2020 a
2001
-
[45]
Annual oil palm plantation maps in malaysia and indonesia from 2001 to 2016
Yidi Xu, Le Yu, Wei Li, Philippe Ciais, Yuqi Cheng, and Peng Gong. Annual oil palm plantation maps in malaysia and indonesia from 2001 to 2016. Earth System Science Data, 12 0 (2): 0 847--867, 2020 b
2001
-
[46]
M. A. M. Zaki, J. Ooi, W. P. Q. Ng, B. S. How, H. L. Lam, D. C. Foo, and C. H. Lim. Impact of industry 4.0 technologies on the oil palm industry: A literature review. Smart Agricultural Technology, 10: 0 100685, 2025. doi:10.1016/j.atech.2024.100685
2025
-
[47]
Learning multiscale and deep representations for classifying remotely sensed imagery
Wenzhi Zhao and Shihong Du. Learning multiscale and deep representations for classifying remotely sensed imagery. ISPRS Journal of Photogrammetry and Remote Sensing, 113: 0 155--165, 2016
2016
Reviewed August 4, 2026 · model on record in the stance chip above.
Discussion (0). Sign in to comment.