REVIEW 3 major objections 6 minor 68 references
Using merger trees from the TNG300-1 simulation, this paper argues that galaxies emerging from collisions have higher average star formation rates than their progenitors at all redshifts, with a tenfold gap near z=4, and that mergers occur
Reviewed by Pith at T0; open to challenge. T0 means a machine referee read the full paper against a public rubric. the ladder, T0–T4 →
T0 review · deepseek-v4-flash
2026-08-04 19:13 UTC pith:XWIMT5WK
load-bearing objection A useful high-redshift merger census with an unsupported central claim: the SFR boost is mostly mass assembly. the 3 major comments →
The History of Galaxy Mergers in IllustrisTNG
The pith
A machine-rendered reading of the paper's core claim, the machinery that carries it, and where it could break.
Core claim
The central claim is that, averaged over merger events in TNG300-1, the descendant galaxy's star formation rate exceeds its progenitor's at every redshift, by roughly an order of magnitude around z=4, implying that the collision process is associated with triggered star formation. A second claim is that merger galaxies occupy systematically denser environments than the full galaxy population throughout cosmic time, quantified with the fifth-nearest-neighbor density estimator. The paper also finds that TNG300's cosmic star formation rate density peaks at z=2.57 at log10(SFRD) about -1.24, a peak that is shallower and at higher redshift than the JWST/MIRI source-count cosmic star formation his
What carries the argument
The central object is the SubLink merger tree, which links subhalos through unique descendant relations and identifies the most-massive-history branch as the first progenitor and the second branch as the next progenitor. Interacting pairs are selected as galaxies sharing a descendant in the next or following snapshot; the analysis then averages star formation rate, total mass, stellar mass, gas mass, gas fraction, and specific star formation rate over these pairs. Environment is measured with the η_k density parameter, η_k = (k-1)/V(r_k), using the fifth-closest neighbor distance.
Load-bearing premise
The load-bearing premise is that comparing a descendant's average star formation rate directly with its progenitor's rate, without a matched control sample of non-merging galaxies in similar environments and masses, isolates the effect of the merger itself.
What would settle it
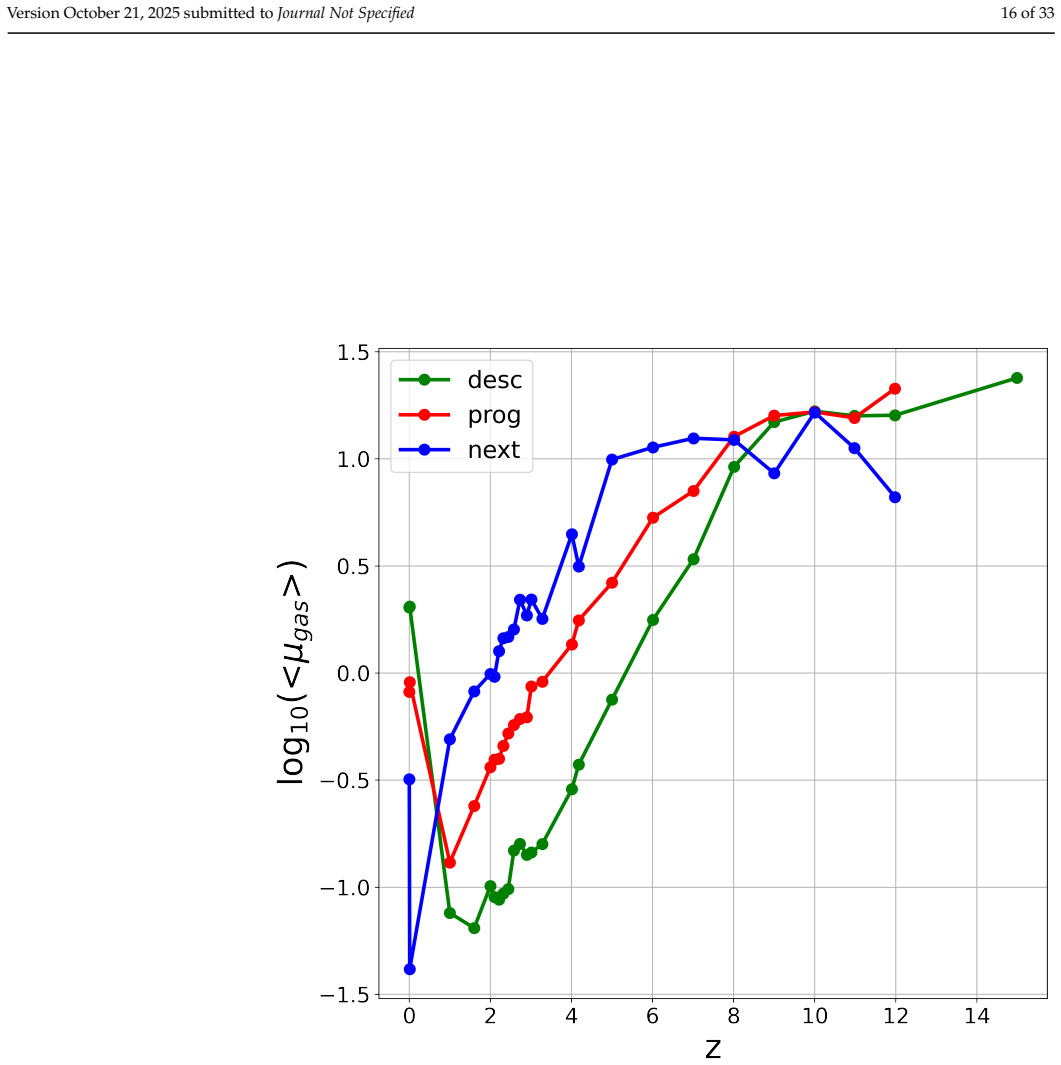
Construct a control sample of non-merging galaxies matched in stellar mass, gas fraction, and local density at the same redshifts, then compare their average star formation rate with the descendant galaxies in Figure 6. If the controls match the descendants, the claimed 1-2 dex merger enhancement is an artifact of comparing a summed descendant to a single progenitor; the near-identical descendant and next-progenitor specific star formation rates in Figure 11 already hint that per-unit-mass enhancement may be small.
If this is right
- If descendant galaxies have higher star formation rates than progenitors at all redshifts, merger-driven star formation enhancement is a persistent cosmic process, not limited to low-z mergers.
- The merger SFR peak near z=4, earlier than the global cosmic star formation peak around z=2-3, implies collisional triggering was most prominent in the early universe and may contribute significantly to high-redshift star formation.
- Since mergers consistently occur in denser regions, merger incidence and the evolution of the cosmic density field are coupled, so environment must be included in merger-driven galaxy evolution models.
- The TNG300 star formation rate density peak at z=2.57, compared with JWST-derived peaks around z=1-2, exposes a model-observation tension worth closer calibration.
- Case studies of massive subhalos show gas depletion times falling from roughly 10 Gyr at high redshift to about 0.1 Gyr at low redshift, suggesting merger-driven gas consumption becomes more efficient over cosmic time.
Where Pith is reading between the lines
- Because the paper compares each descendant with its own progenitor rather than with matched non-merging galaxies, part of the claimed 1-2 dex star formation gap likely reflects simple mass assembly: the descendant is the summed output of two galaxies. The nearly identical specific star formation rates of descendants and next-progenitors in Figure 11 suggest the per-unit-mass enhancement may be mod
- A direct test of the merger-enhancement claim would be environment- and mass-matched control samples of non-merging galaxies; the paper itself identifies this as an interesting next step.
- Repeating the same pair-selection and density analysis in the higher-resolution TNG50 simulation would test whether the z=4 SFR peak and the environmental trends persist below TNG300's resolution limit.
- The density-SFR relation in Figure 12, with rising SFR up to about 25 galaxies/Mpc^3 and decline beyond, could be disentangled from merger triggering by comparing the environments of mergers and non-mergers in the same density bins.
Editorial analysis
A structured set of objections, weighed in public.
Referee Report
Summary. The paper uses the IllustrisTNG TNG300-1 simulation's public catalogues and Sublink merger trees to construct samples of merging galaxies with stellar mass > 10^9 Msun over 0 < z < 15. It reports average SFR, total mass, stellar mass, gas mass, gas fraction, and sSFR for progenitors, next progenitors, and descendants, along with local density via the fifth-nearest-neighbour distance. The central claims are that descendant galaxies have higher SFR than their progenitors at all redshifts, with the gap reaching about one order of magnitude near z ~ 4; that galaxy mergers occur in denser environments across cosmic time; and that the TNG300 cosmic SFRD peaks at z = 2.57 with log10(SFRD) ~ -1.24, which is compared with JWST-based measurements.
Significance. If the merger-driven SFR enhancement claim were properly established, the paper would provide useful high-redshift constraints from a modern cosmological simulation. The paper's descriptive statistics from the public TNG300-1 data are a potentially useful reference, and the comparison with JWST-derived cosmic star formation history is an interesting benchmark. The authors are transparent about the data products and give a quantitative SFRD peak. However, the headline causal claim that mergers enhance star formation is not supported by the present analysis, as detailed in the major comments. The paper also explicitly acknowledges the lack of a non-merger control sample, which is central to the interpretation.
major comments (3)
- [Section 3.2, Figures 6 and 11] The descendant–progenitor comparison does not isolate the effect of mergers on star formation. A descendant is the merged product of at least two galaxies, and its stellar mass is systematically larger than that of either progenitor (Fig. 7). Since SFR correlates strongly with stellar mass, the higher absolute SFR of descendants in Fig. 6 is the expected consequence of mass assembly, not necessarily a merger-triggered starburst. The paper's own Fig. 11 shows that descendant and next-progenitor sSFR are nearly identical at all redshifts, implying no per-stellar-mass enhancement. The Discussion states: 'An interesting next step would be to investigate non-merger galaxies that reside in environments similar to those of merging systems.' Without such a matched control, the assertion in §3.2 that the order-of-magnitude gap 'supports the theoretical and observed hypothesis that through the mer
- [Section 3.1, Figures 3–5] The environment claim is partly tautological and may not generalize. Mergers are selected as pairs that share a descendant in the next snapshot; by construction, such galaxies are spatially close. Comparing their fifth-neighbour distance with the average over all galaxies partly measures this selection criterion rather than a physical environmental effect. Additionally, Figures 3–5 appear to use galaxies from a single merger tree (captions: 'in a merger tree'), so the statement that 'galaxy mergers consistently occur in denser regions throughout the entire time interval' is not established for the full TNG300 volume. A control of non-merging pairs matched in separation and mass, or a volume-averaged analysis over many merger trees, is needed.
- [Section 3.2, Figures 6–11] No uncertainties or sample sizes are reported for the averaged quantities. The order-of-magnitude differences in Fig. 6 lack error bars or confidence intervals, so it is impossible to assess whether the differences are statistically significant. The redshift binning and the fact that descendants can skip snapshots are described qualitatively, but without bootstrap errors or at least the number of galaxies per bin, the central comparison is not quantitatively supported. Add confidence intervals or sample counts to the key figures.
minor comments (6)
- [Abstract and Section 2.1] The abstract mentions TNG100-1 and TNG300-1, but the methods and results focus on TNG300-1. Please clarify whether TNG100-1 is used anywhere in the analysis or remove it from the abstract.
- [Figure A4 caption] Typo: 'Deplation time' should be 'Depletion time'.
- [Equation (1)] The eta_k estimator should specify that k = 5 is used, and the units of r_k and V(r_k) should be stated consistently (comoving vs physical).
- [Section 4, Figure 13] The B-spline smoothing parameter (0.01) is a free choice; please justify it or show sensitivity of the reported peak position and amplitude to this choice.
- [Section 4.1, Figure 14] The comparison with the JWST-derived CSFH of Kim et al. would benefit from a quantitative statement of uncertainties on both the TNG300 and observational values, since the claimed 'shallower peak at higher redshift' may be within systematic uncertainties.
- [General] There are several grammatical and formatting issues (e.g., 'The stellar mass of galaxies is increasing with time monotonic', Table A1 column headers with inconsistent spacing). A careful language edit is recommended.
Circularity Check
No significant circularity: reported values are direct TNG300 catalogue measurements; the main caveat (no non-merger control) is a methodological confound, not a circular derivation.
full rationale
The paper's quantitative claims (SFR, stellar mass, gas mass, local density, SFRD) are computed directly from the public IllustrisTNG TNG300-1 catalogues and merger-tree files; they are not fitted to the JWST data with which they are compared, and the SFRD peak at z=2.57 is read off the simulation's own values. The central interpretation that mergers enhance star formation is weakened by the absence of a matched non-merger control sample: Section 3.2/Figure 6 compares descendant galaxies with their main progenitors, and descendants are systematically more massive (Figure 7), while Figure 11 shows sSFR of descendants and next progenitors are nearly identical. However, this is an inference/confound issue, not circularity - descendant SFR is not defined as progenitor SFR, and the simulation could in principle show quenching. The Discussion explicitly acknowledges the missing control ('An interesting next step would be to investigate non-merger galaxies that reside in environments similar to those of merging systems'). The only self-citation of note is Koncz et al. (2023) used to justify that individual merger trees are representative; this is a mild reliance, but the paper's main SFR results are corroborated by independent external TNG studies (Patton et al. 2020; Hani et al. 2020) and the cited claim is not what generates the reported values. Thus no load-bearing self-citation chain or definitional reduction is present; circularity score is low.
Axiom & Free-Parameter Ledger
free parameters (4)
- k in eta_k density estimator =
5
- Stellar mass cut for galaxy sample =
10^9 Msun
- Maximum redshift considered =
z=15
- B-spline smoothing parameter =
0.01
axioms (5)
- domain assumption SubLink merger trees accurately assign progenitor and descendant relations for all merging subhalos.
- domain assumption TNG300 subgrid physics, including star formation, feedback, and AGN prescriptions, is a valid model of galaxy formation.
- ad hoc to paper Comparing mean SFR of descendants with progenitors, without a matched non-merger control, isolates the effect of mergers.
- domain assumption The 5th-nearest-neighbor density eta_5 adequately represents the local environment.
- domain assumption The snapshot cadence of about 150 million years does not alias merger selection or the star formation enhancement timescale.
Cite this review
Pith. "Pith review of The History of Galaxy Mergers in IllustrisTNG." pith.science (2026). https://pith.science/paper/XWIMT5WK
@misc{pith2026250909355,
  author       = {Pith},
  title        = {Pith review of: The History of Galaxy Mergers in IllustrisTNG},
  year         = {2026},
  howpublished = {\url{https://pith.science/paper/XWIMT5WK}},
  note         = {Machine review of arXiv:2509.09355}
}
read the original abstract
The process of galaxy evolution over cosmic time is not yet fully understood, since there is a debate on the impact of galaxy collisions on the star formation and metallicity. The local environment of the galaxy mergers could also have a large impact on the evolution of the galaxies, but it has not yet been possible to examine it in detail. Modern simulations with larger capacity, including the newest physical knowledge and new observations with JWST, help us to answer these questions. Using the IllustrisTNG cosmological simulation, we processed the catalogue data and the merger tree files of the TNG300-1 simulation. We calculated the galaxies average star formation rate (SFR) and mass at redshifts between 0 < z < 15. We investigated the environment of galaxy mergers, with the focus on the local density, and also examined how the SFR changes in merging galaxies. We compared our findings with JWST results and highlighted differences in the star formation rate density (SFRD) history between the models and observations.
Figures




Reference graph
Works this paper leans on
-
[1]
Hwang, H.S.; Shin, J.; Song, H. Evolution of star formation rate–density relation over cosmic time in a simulated universe: the observed reversal reproduced.Monthly Notices of the Royal Astronomical Society2019,489, 339–348. https://doi.org/10.1093/ mnras/stz2136
-
[2]
Gasdynamics and Starbursts in Major Mergers.ApJ1996,464, 641, [arXiv:astro-ph/astro-ph/9512099]
Mihos, J.C.; Hernquist, L. Gasdynamics and Starbursts in Major Mergers.ApJ1996,464, 641, [arXiv:astro-ph/astro-ph/9512099]. https://doi.org/10.1086/177353
-
[3]
Shah, E.A.; Kartaltepe, J.S.; Magagnoli, C.T.; Cox, I.G.; Wetherell, C.T.; Vanderhoof, B.N.; Cooke, K.C.; Calabro, A.; Chartab, N.; Conselice, C.J.; et al. Investigating the Effect of Galaxy Interactions on Star Formation at 0.5 < z < 3.0.The Astrophysical Journal2022,940, 4. https://doi.org/10.3847/1538-4357/ac96eb
-
[4]
Nath, B.B.; Chiba, M. Dwarf Galaxies and the Origin of the Intracluster Medium.ApJ1995,454, 604, [arXiv:astro-ph/astro- ph/9505081]. https://doi.org/10.1086/176514
-
[5]
Moustakas, J.; Coil, A.L.; Aird, J.; Blanton, M.R.; Cool, R.J.; Eisenstein, D.J.; Mendez, A.J.; Wong, K.C.; Zhu, G.; Arnouts, S. PRIMUS: Constraints on Star Formation Quenching and Galaxy Merging, and the Evolution of the Stellar Mass Function from z = 0-1.ApJ2013,767, 50, [arXiv:astro-ph.CO/1301.1688]. https://doi.org/10.1088/0004-637X/767/1/50. Version ...
Pith/arXiv arXiv 2025
-
[6]
Ellison, S.L.; Wilkinson, S.; Woo, J.; Leung, H.H.; Wild, V .; Bickley, R.W.; Patton, D.R.; Quai, S.; Gwyn, S. Galaxy mergers can rapidly shut down star formation.Monthly Notices of the Royal Astronomical Society: Letters2022,517, L92–L96. https: //doi.org/10.1093/mnrasl/slac109
-
[7]
Pontzen, A.; Tremmel, M.; Roth, N.; Peiris, H.V .; Saintonge, A.; Volonteri, M.; Quinn, T.; Governato, F. How to quench a galaxy. MNRAS2017,465, 547–558, [arXiv:astro-ph.GA/1607.02507]. https://doi.org/10.1093/mnras/stw2627
-
[8]
Gabor, J.M.; Davé, R.; Finlator, K.; Oppenheimer, B.D. How is star formation quenched in massive galaxies?MNRAS2010, 407, 749–771, [arXiv:astro-ph.CO/1001.1734]. https://doi.org/10.1111/j.1365-2966.2010.16961.x
Pith/arXiv arXiv 2010
-
[9]
Effect of galaxy mergers on star-formation rates.A&A2019,631, A51, [arXiv:astro-ph.GA/1908.10115]
Pearson, W.J.; Wang, L.; Alpaslan, M.; Baldry, I.; Bilicki, M.; Brown, M.J.I.; Grootes, M.W.; Holwerda, B.W.; Kitching, T.D.; Kruk, S.; et al. Effect of galaxy mergers on star-formation rates.A&A2019,631, A51, [arXiv:astro-ph.GA/1908.10115]. https://doi.org/10.1051/0004-6361/201936337
Pith/arXiv arXiv 1908
-
[10]
Nelson, D.; Pillepich, A.; Springel, V .; Weinberger, R.; Hernquist, L.; Pakmor, R.; Genel, S.; Torrey, P .; Vogelsberger, M.; Kauffmann, G.; et al. First results from the IllustrisTNG simulations: the galaxy colour bimodality.Monthly Notices of the Royal Astronomical Society2017,475, 624–647. https://doi.org/10.1093/mnras/stx3040
-
[11]
Marinacci, F.; Vogelsberger, M.; Pakmor, R.; Torrey, P .; Springel, V .; Hernquist, L.; Nelson, D.; Weinberger, R.; Pillepich, A.; Naiman, J.; et al. First results from the IllustrisTNG simulations: radio haloes and magnetic fields.Monthly Notices of the Royal Astronomical Society2018. https://doi.org/10.1093/mnras/sty2206
-
[12]
Pillepich, A.; Nelson, D.; Hernquist, L.; Springel, V .; Pakmor, R.; Torrey, P .; Weinberger, R.; Genel, S.; Naiman, J.P .; Marinacci, F.; et al. First results from the IllustrisTNG simulations: the stellar mass content of groups and clusters of galaxies.Monthly Notices of the Royal Astronomical Society2017,475, 648–675. https://doi.org/10.1093/mnras/stx3...
-
[13]
Springel, V .; Pakmor, R.; Pillepich, A.; Weinberger, R.; Nelson, D.; Hernquist, L.; Vogelsberger, M.; Genel, S.; Torrey, P .; Marinacci, F.; et al. First results from the IllustrisTNG simulations: matter and galaxy clustering.Monthly Notices of the Royal Astronomical Society2017,475, 676–698. https://doi.org/10.1093/mnras/stx3304
-
[14]
Naiman, J.P .; Pillepich, A.; Springel, V .; Ramirez-Ruiz, E.; Torrey, P .; Vogelsberger, M.; Pakmor, R.; Nelson, D.; Marinacci, F.; Hernquist, L.; et al. First results from the IllustrisTNG simulations: a tale of two elements – chemical evolution of magnesium and europium.Monthly Notices of the Royal Astronomical Society2018,477, 1206–1224. https://doi.o...
-
[15]
Cutri, R.M.; McAlary, C.W. A statistical study of the relationship between galaxy interactions and nuclear activity.ApJ1985, 296, 90–105. https://doi.org/10.1086/163422
-
[16]
Galaxy pairs in the Sloan Digital Sky Survey - IV
Ellison, S.L.; Patton, D.R.; Mendel, J.T.; Scudder, J.M. Galaxy pairs in the Sloan Digital Sky Survey - IV . Interactions trigger active galactic nuclei.MNRAS2011,418, 2043–2053, [arXiv:astro-ph.CO/1108.2711]. https://doi.org/10.1111/j.1365-2966.2011.19624.x
Pith/arXiv arXiv 2043
-
[17]
Moreno, J.; Torrey, P .; Ellison, S.L.; Patton, D.R.; Hopkins, P .F.; Bueno, M.; Hayward, C.C.; Narayanan, D.; Kereš, D.; Bluck, A.F.L.; et al. Interacting galaxies on FIRE-2: the connection between enhanced star formation and interstellar gas content.MNRAS2019, 485, 1320–1338, [arXiv:astro-ph.GA/1902.02305]. https://doi.org/10.1093/mnras/stz417
Pith/arXiv arXiv 1902
-
[18]
Recent star formation in interacting galaxies - II
Joseph, R.D.; Wright, G.S. Recent star formation in interacting galaxies - II. Super starbursts in merging galaxies.MNRAS1985, 214, 87–95. https://doi.org/10.1093/mnras/214.2.87
-
[19]
Outflows in Infrared-Luminous Starbursts at z < 0.5
Rupke, D.S.; Veilleux, S.; Sanders, D.B. Outflows in Infrared-Luminous Starbursts at z < 0.5. II. Analysis and Discussion.ApJ Suppl.2005,160, 115–148, [arXiv:astro-ph/astro-ph/0506611]. https://doi.org/10.1086/432889
Pith/arXiv arXiv 2005
-
[20]
Strickland, D.K.; Heckman, T.M. Supernova Feedback Efficiency and Mass Loading in the Starburst and Galactic Superwind Exemplar M82.ApJ2009,697, 2030–2056, [arXiv:astro-ph.CO/0903.4175]. https://doi.org/10.1088/0004-637X/697/2/2030
Pith/arXiv arXiv 2030
-
[21]
Rupke, D.S.; Veilleux, S.; Sanders, D.B. Outflows in Active Galactic Nucleus/Starburst-Composite Ultraluminous Infrared Galaxies1,.ApJ2005,632, 751–780, [arXiv:astro-ph/astro-ph/0507037]. https://doi.org/10.1086/444451. Version October 21, 2025 submitted toJournal Not Specified 31 of 33
Pith/arXiv arXiv 2025
-
[22]
Delayed or No Feedback? Gas Outflows in Type 2 AGNs
Woo, J.H.; Son, D.; Bae, H.J. Delayed or No Feedback? Gas Outflows in Type 2 AGNs. III.ApJ2017,839, 120, [arXiv:astro- ph.GA/1702.06681]. https://doi.org/10.3847/1538-4357/aa6894
-
[23]
Luo, W.; Yang, X.; Zhang, Y. Connections between Galaxy Mergers and Starburst: Evidence from the Local Universe.ApJL2014, 789, L16, [arXiv:astro-ph.GA/1406.5315]. https://doi.org/10.1088/2041-8205/789/1/L16
Pith/arXiv arXiv 2041
-
[24]
Cibinel, A.; Daddi, E.; Sargent, M.T.; Le Floc’h, E.; Liu, D.; Bournaud, F.; Oesch, P .A.; Amram, P .; Calabrò, A.; Duc, P .A.; et al. Early- and late-stage mergers among main sequence and starburst galaxies at 0.2 ≤ z ≤ 2.MNRAS2019,485, 5631–5651, [arXiv:astro-ph.GA/1809.00715]. https://doi.org/10.1093/mnras/stz690
-
[25]
Ma, W.; Liu, K.; Guo, H.; Cui, W.; Jones, M.G.; Wang, J.; Zhang, L.; Davé, R. Effects of Active Galactic Nucleus Feedback on Cold Gas Depletion and Quenching of Central Galaxies.The Astrophysical Journal2022,941, 205. https://doi.org/10.3847/1538-4357/ aca326
-
[26]
Chemical Composition and Evolution of Irregular and Blue Compact Galaxies.A&A1979,80, 155
Lequeux, J.; Peimbert, M.; Rayo, J.F.; Serrano, A.; Torres-Peimbert, S. Chemical Composition and Evolution of Irregular and Blue Compact Galaxies.A&A1979,80, 155
-
[27]
Spectroscopic observations of 10 emission-line dwarf galaxies.ApJ1981,243, 127–139
Kinman, T.D.; Davidson, K. Spectroscopic observations of 10 emission-line dwarf galaxies.ApJ1981,243, 127–139. https: //doi.org/10.1086/158575
-
[28]
Rubin, V .C.; Ford, W. K., J.; Whitmore, B.C. Luminosity-dependent line ratios in disks of spiral galaxies.ApJL1984,281, L21–L24. https://doi.org/10.1086/184276
-
[29]
Kewley, L.J.; Geller, M.J.; Barton, E.J. Metallicity and Nuclear Star Formation in Nearby Galaxy Pairs: Evidence for Tidally Induced Gas Flows.Astronomical Journal2006,131, 2004–2017, [arXiv:astro-ph/astro-ph/0511119]. https://doi.org/10.1086/500295
Pith/arXiv arXiv 2004
-
[30]
GALAXY PAIRS IN THE SLOAN DIGITAL SKY SURVEY
Ellison, S.L.; Patton, D.R.; Simard, L.; McConnachie, A.W. GALAXY PAIRS IN THE SLOAN DIGITAL SKY SURVEY. I. STAR FORMATION, ACTIVE GALACTIC NUCLEUS FRACTION, AND THE LUMINOSITY/MASS–METALLICITY RELATION.The Astronomical Journal2008,135, 1877. https://doi.org/10.1088/0004-6256/135/5/1877
-
[31]
Chamberlain, K.; Patel, E.; Besla, G.; Torrey, P .; Rodriguez-Gomez, V . A Physically Motivated Framework to Compare the Merger Timescales of Isolated Low- and High-mass Galaxy Pairs Across Cosmic Time.ApJ2024,975, 104, [arXiv:astro-ph.GA/2409.02233]. https://doi.org/10.3847/1538-4357/ad7bad
-
[32]
Bottrell, C.; Yesuf, H.M.; Popping, G.; Omori, K.C.; Tang, S.; Ding, X.; Pillepich, A.; Nelson, D.; Eisert, L.; Gao, H.; et al. IllustrisTNG in the HSC-SSP: image data release and the major role of mini mergers as drivers of asymmetry and star formation. MNRAS2024,527, 6506–6539, [arXiv:astro-ph.GA/2308.14793]. https://doi.org/10.1093/mnras/stad2971
-
[33]
Montenegro-Taborda, D.; Rodriguez-Gomez, V .; Pillepich, A.; Avila-Reese, V .; Sales, L.V .; Rodríguez-Puebla, A.; Hernquist, L. The growth of brightest cluster galaxies in the TNG300 simulation: dissecting the contributions from mergers and in situ star formation.MNRAS2023,521, 800–817, [arXiv:astro-ph.GA/2302.10943]. https://doi.org/10.1093/mnras/stad586
-
[34]
Ferreira, L.; Bickley, R.W.; Ellison, S.L.; Patton, D.R.; Byrne-Mamahit, S.; Wilkinson, S.; Bottrell, C.; Fabbro, S.; Gwyn, S.D.J.; McConnachie, A. Galaxy mergers in UNIONS - I. A simulation-driven hybrid deep learning ensemble for pure galaxy merger classification.MNRAS2024,533, 2547–2569, [arXiv:astro-ph.GA/2407.18396]. https://doi.org/10.1093/mnras/stae1885
-
[35]
Margalef-Bentabol, B.; Wang, L.; La Marca, A.; Blanco-Prieto, C.; Chudy, D.; Domínguez-Sánchez, H.; Goulding, A.D.; Guzmán- Ortega, A.; Huertas-Company, M.; Martin, G.; et al. Galaxy merger challenge: A comparison study between machine learning- based detection methods.A&A2024,687, A24, [arXiv:astro-ph.GA/2403.15118]. https://doi.org/10.1051/0004-6361/202348239
-
[36]
Jung, M.; Kim, J.h.; Oh, B.K.; Hong, S.E.; Lee, J.; Kim, J. Merger-tree-based Galaxy Matching: A Comparative Study across Different Resolutions.ApJ2024,965, 156, [arXiv:astro-ph.GA/2312.02466]. https://doi.org/10.3847/1538-4357/ad34d1
-
[37]
Omori, K.C.; Bottrell, C.; Walmsley, M.; Yesuf, H.M.; Goulding, A.D.; Ding, X.; Popping, G.; Silverman, J.D.; Takeuchi, T.T.; Toba, Y. Galaxy mergers in Subaru HSC-SSP: A deep representation learning approach for identification, and the role of environment on merger incidence.A&A2023,679, A142, [arXiv:astro-ph.GA/2309.15539]. https://doi.org/10.1051/0004-...
-
[38]
Patton, D.R.; Wilson, K.D.; Metrow, C.J.; Ellison, S.L.; Torrey, P .; Brown, W.; Hani, M.H.; McAlpine, S.; Moreno, J.; Woo, J. Interacting galaxies in the IllustrisTNG simulations - I: Triggered star formation in a cosmological context.MNRAS2020, 494, 4969–4985, [arXiv:astro-ph.GA/2003.00289]. https://doi.org/10.1093/mnras/staa913
Pith/arXiv arXiv 2003
-
[39]
Hani, M.H.; Gosain, H.; Ellison, S.L.; Patton, D.R.; Torrey, P . Interacting galaxies in the IllustrisTNG simulations - II: star formation in the post-merger stage.MNRAS2020,493, 3716–3731, [arXiv:astro-ph.GA/2001.04472]. https://doi.org/10.1093/mnras/staa4 59
Pith/arXiv arXiv 2001
-
[40]
Interacting galaxies in the IllustrisTNG simulations - III
Quai, S.; Hani, M.H.; Ellison, S.L.; Patton, D.R.; Woo, J. Interacting galaxies in the IllustrisTNG simulations - III. (The rarity of) quenching in post-merger galaxies.MNRAS2021,504, 1888–1901, [arXiv:astro-ph.GA/2104.03327]. https://doi.org/10.1093/ mnras/stab988
Pith/arXiv arXiv 1901
-
[41]
Byrne-Mamahit, S.; Hani, M.H.; Ellison, S.L.; Quai, S.; Patton, D.R. Interacting galaxies in the IllustrisTNG simulations - IV: enhanced supermassive black hole accretion rates in post-merger galaxies.MNRAS2023,519, 4966–4981, [arXiv:astro- ph.GA/2212.07342]. https://doi.org/10.1093/mnras/stac3674. Version October 21, 2025 submitted toJournal Not Specifie...
Pith/arXiv arXiv 2025
-
[42]
Interacting galaxies in the IllustrisTNG simulations - V
Brown, W.; Patton, D.R.; Ellison, S.L.; Faria, L. Interacting galaxies in the IllustrisTNG simulations - V . Comparing the influence of star-forming versus passive companions.MNRAS2023,522, 5107–5122, [arXiv:astro-ph.GA/2304.14566]. https: //doi.org/10.1093/mnras/stad1314
-
[43]
Hopkins, A.M.; Beacom, J.F. On the Normalization of the Cosmic Star Formation History.The Astrophysical Journal2006, 651, 142–154. https://doi.org/10.1086/506610
-
[44]
Springel, V . E pur si muove: Galilean-invariant cosmological hydrodynamical simulations on a moving mesh.MNRAS2010, 401, 791–851, [arXiv:astro-ph.CO/0901.4107]. https://doi.org/10.1111/j.1365-2966.2009.15715.x
Pith/arXiv arXiv 2009
-
[45]
Pillepich, A.; Springel, V .; Nelson, D.; Genel, S.; Naiman, J.; Pakmor, R.; Hernquist, L.; Torrey, P .; Vogelsberger, M.; Weinberger, R.; et al. Simulating galaxy formation with the IllustrisTNG model.MNRAS2018,473, 4077–4106, [arXiv:astro-ph.GA/1703.02970]. https://doi.org/10.1093/mnras/stx2656
-
[46]
Weinberger, R.; Springel, V .; Hernquist, L.; Pillepich, A.; Marinacci, F.; Pakmor, R.; Nelson, D.; Genel, S.; Vogelsberger, M.; Naiman, J.; et al. Simulating galaxy formation with black hole driven thermal and kinetic feedback.MNRAS2017,465, 3291–3308, [arXiv:astro-ph.GA/1607.03486]. https://doi.org/10.1093/mnras/stw2944
-
[47]
Pillepich, A.; Nelson, D.; Springel, V .; Pakmor, R.; Torrey, P .; Weinberger, R.; Vogelsberger, M.; Marinacci, F.; Genel, S.; van der Wel, A.; et al. First results from the TNG50 simulation: the evolution of stellar and gaseous discs across cosmic time.MNRAS 2019,490, 3196–3233, [arXiv:astro-ph.GA/1902.05553]. https://doi.org/10.1093/mnras/stz2338
Pith/arXiv arXiv 2019
-
[48]
Nelson, D.; Pillepich, A.; Springel, V .; Pakmor, R.; Weinberger, R.; Genel, S.; Torrey, P .; Vogelsberger, M.; Marinacci, F.; Hernquist, L. First results from the TNG50 simulation: galactic outflows driven by supernovae and black hole feedback.MNRAS2019, 490, 3234–3261, [arXiv:astro-ph.GA/1902.05554]. https://doi.org/10.1093/mnras/stz2306
Pith/arXiv arXiv 1902
-
[49]
Rodriguez-Gomez, V .; Genel, S.; Vogelsberger, M.; Sijacki, D.; Pillepich, A.; Sales, L.V .; Torrey, P .; Snyder, G.; Nelson, D.; Springel, V .; et al. The merger rate of galaxies in the Illustris simulation: a comparison with observations and semi-empirical models. MNRAS2015,449, 49–64, [arXiv:astro-ph.GA/1502.01339]. https://doi.org/10.1093/mnras/stv264
-
[50]
Springel, V .; White, S.D.M.; Jenkins, A.; Frenk, C.S.; Yoshida, N.; Gao, L.; Navarro, J.; Thacker, R.; Croton, D.; Helly, J.; et al. Simulations of the formation, evolution and clustering of galaxies and quasars.Nature2005,435, 629–636, [arXiv:astro-ph/astro- ph/0504097]. https://doi.org/10.1038/nature03597
-
[51]
Koncz, B.; Joó, A.P .; Pintér, S. Investigating star formation in Illustris TNG galaxy mergers.Contributions of the Astronomical Observatory Skalnate Pleso2023,53, 153–163. https://doi.org/10.31577/caosp.2023.53.4.153
-
[52]
Das, A.; Pandey, B.; Sarkar, S. Galaxy Interactions in Filaments and Sheets: Effects of the Large-scale Structures Versus the Local Density.Research in Astronomy and Astrophysics2023,23, 025016. https://doi.org/10.1088/1674-4527/acab44
-
[53]
Casertano, S.; Hut, P . Core radius and density measurements in N-body experiments Connections with theoretical and observational definitions.ApJ1985,298, 80–94. https://doi.org/10.1086/163589
-
[54]
Star Formation History in the Illustris TNG Simulation
Joó, A.P .; Koncz, B.; Pinter, S.; Tóth, L.V . Star Formation History in the Illustris TNG Simulation. In Proceedings of the Resolving the Rise and Fall of Star Formation in Galaxies; Wong, T.; Kim, W.T., Eds., 1 2023, Vol. 373,IAU Symposium, pp. 318–321. https://doi.org/10.1017/S1743921323000157
-
[55]
Ilbert, O.; Arnouts, S.; Le Floc’h, E.; Aussel, H.; Bethermin, M.; Capak, P .; Hsieh, B.C.; Kajisawa, M.; Karim, A.; Le Fèvre, O.; et al. Evolution of the specific star formation rate function at z< 1.4 Dissecting the mass-SFR plane in COSMOS and GOODS.A&A 2015,579, A2, [arXiv:astro-ph.GA/1410.4875]. https://doi.org/10.1051/0004-6361/201425176
Pith/arXiv arXiv 2015
-
[56]
Kim, S.J.; Goto, T.; Ling, C.T.; Wu, C.K.W.; Hashimoto, T.; Kilerci, E.; Ho, S.C.C.; Uno, Y.; Wang, P .Y.; Lin, Y.W. Cosmic star- formation history and black hole accretion history inferred from the JWST mid-infrared source counts.Monthly Notices of the Royal Astronomical Society2023,527, 5525–5539, [https://academic.oup.com/mnras/article-pdf/527/3/5525/5...
-
[57]
Ling, C.T.; Kim, S.J.; Wu, C.K.W.; Goto, T.; Kilerci, E.; Hashimoto, T.; Lin, Y.W.; Wang, P .Y.; Ho, S.C.C.; Hsiao, T.Y.Y. Galaxy source counts at 7.7, 10, and 15µm with the James Webb Space Telescope.Monthly Notices of the Royal Astronomical Society2022, 517, 853–857. https://doi.org/10.1093/mnras/stac2716
-
[58]
Wu, C.K.W.; Ling, C.T.; Goto, T.; Kim, S.J.; Hashimoto, T.; Kilerci, E.; Lin, Y.W.; Wang, P .Y.; Uno, Y.; Ho, S.C.C.; et al. Source counts at 7.7–21 µm in CEERS field with JWST.Monthly Notices of the Royal Astronomical Society2023,523, 5187–5197. https: //doi.org/10.1093/mnras/stad1769
-
[59]
Observations of the Hubble Deep Field with the Infrared Space Observatory - III
Oliver, S.J.; Goldschmidt, P .; Franceschini, A.; Serjeant, S.B.G.; Efstathiou, A.; Verma, A.; Gruppioni, C.; Eaton, N.; Mann, R.G.; Mobasher, B.; et al. Observations of the Hubble Deep Field with the Infrared Space Observatory - III. Source counts and P(D) analysis.Monthly Notices of the Royal Astronomical Society1997,289, 471–481. https://doi.org/10.109...
-
[60]
The European Large Area ISO Survey – II
Serjeant, S.; Oliver, S.; Rowan-Robinson, M.; Crockett, H.; Missoulis, V .; Sumner, T.; Gruppioni, C.; Mann, R.G.; Eaton, N.; Elbaz, D.; et al. The European Large Area ISO Survey – II. Mid-infrared extragalactic source counts.Monthly Notices of the Royal Astronomical Society2000,316, 768–778. https://doi.org/10.1046/j.1365-8711.2000.03551.x. Version Octob...
arXiv 2000
-
[61]
Source counts at 15 microns from the AKARI NEP survey.Astronomy and Astrophysics2010,514, A8
Pearson, C.P .; Oyabu, S.; Wada, T.; Matsuhara, H.; Lee, H.M.; Kim, S.J.; Takagi, T.; Goto, T.; Im, M.S.; Serjeant, S.; et al. Source counts at 15 microns from the AKARI NEP survey.Astronomy and Astrophysics2010,514, A8. https://doi.org/10.1051/0004-636 1/200913382
-
[62]
The AKARI NEP-Deep survey: a mid-infrared source catalogue.Astronomy & Astrophysics2011,537, A24
Takagi, T.; Matsuhara, H.; Goto, T.; Hanami, H.; Im, M.; Imai, K.; Ishigaki, T.; Lee, H.M.; Lee, M.G.; Malkan, M.; et al. The AKARI NEP-Deep survey: a mid-infrared source catalogue.Astronomy & Astrophysics2011,537, A24. https://doi.org/10.1051/0004 -6361/201117759
-
[63]
Pearson, C.P .; Serjeant, S.; Oyabu, S.; Matsuhara, H.; Wada, T.; Goto, T.; Takagi, T.; Lee, H.M.; Im, M.; Ohyama, Y.; et al. The first source counts at 18µm from the AKARI NEP Survey.Monthly Notices of the Royal Astronomical Society2014,444, 846–859. https://doi.org/10.1093/mnras/stu1472
-
[64]
Davidge, H.; Serjeant, S.; Pearson, C.; Matsuhara, H.; Wada, T.; Dryer, B.; Barrufet, L. AKARI/IRC source catalogues and source counts for the IRAC Dark Field, ELAIS North and the AKARI Deep Field South.Monthly Notices of the Royal Astronomical Society 2017,472, 4259–4286. https://doi.org/10.1093/mnras/stx1935
-
[65]
Suess, K.A.; Williams, C.C.; Robertson, B.; Ji, Z.; Johnson, B.D.; Nelson, E.; Alberts, S.; Hainline, K.; D’Eugenio, F.; Übler, H.; et al. Minor Merger Growth in Action: JWST Detects Faint Blue Companions around Massive Quiescent Galaxies at 0.5 ≤ z ≤ 3.0.The Astrophysical Journal Letters2023,956, L42. https://doi.org/10.3847/2041-8213/acf5e6
-
[66]
Atek, H.; Shuntov, M.; Furtak, L.J.; Richard, J.; Kneib, J.P .; Mahler, G.; Zitrin, A.; McCracken, H.J.; Charlot, S.; Chevallard, J.; et al. Revealing galaxy candidates out to z ∼ 16 with JWST observations of the lensing cluster SMACS0723.Monthly Notices of the Royal Astronomical Society2022,519, 1201–1220, [https://academic.oup.com/mnras/article-pdf/519/...
-
[67]
A population of red candidate massive galaxies 600 Myr after the Big Bang.Nature2023,616, 266–269
Labbé, I.; van Dokkum, P .; Nelson, E.; Bezanson, R.; Suess, K.A.; Leja, J.; Brammer, G.; Whitaker, K.; Mathews, E.; Stefanon, M.; et al. A population of red candidate massive galaxies 600 Myr after the Big Bang.Nature2023,616, 266–269. https: //doi.org/10.1038/s41586-023-05786-2
-
[68]
The IllustrisTNG Simulations: Public Data Release, 2021, [arXiv:astro-ph.GA/1812.05609]
Nelson, D.; Springel, V .; Pillepich, A.; Rodriguez-Gomez, V .; Torrey, P .; Genel, S.; Vogelsberger, M.; Pakmor, R.; Marinacci, F.; Weinberger, R.; et al. The IllustrisTNG Simulations: Public Data Release, 2021, [arXiv:astro-ph.GA/1812.05609]. Disclaimer/Publisher’s Note:The statements, opinions and data contained in all publications are solely those of ...
Pith/arXiv arXiv 2021
discussion (0)
Sign in with ORCID, Apple, or X to comment. Anyone can read and Pith papers without signing in.