REVIEW 3 major objections 6 minor 59 references
The Rosette Nebula, mapped with 33,326 optical spectra plus carbon monoxide and dust maps, shows that the nebula formed from a non-homogeneous, thin-sheet molecular cloud at the edge of a filament.
Reviewed by Pith at T0; open to challenge. T0 means a machine referee read the full paper against a public rubric. the ladder, T0–T4 →
T0 review · deepseek-v4-flash
2026-08-04 17:41 UTC pith:2CS3O634
load-bearing objection A careful, honest survey paper that delivers the first LVM IFS maps of the Rosette Nebula; its thin-sheet conclusion is plausible but remains a projection-dependent inference that kinematics has yet to test. the 3 major comments →
SDSS-V Local Volume Mapper (LVM): Revealing the Structure of the Rosette Nebula
The pith
A machine-rendered reading of the paper's core claim, the machinery that carries it, and where it could break.
Core claim
The paper maps the ionized gas of the Rosette Nebula at sub-parsec resolution using 33,326 optical spectra spanning 390–980 nm, and compares it to 12CO, 12 µm dust, and far-infrared column density maps. The spatial distribution of Hα, [O III], [N II], and [S II] reveals a central evacuated cavity surrounded by an ionization ring, with a marked asymmetry: the southeast is dense in CO and dust and weakly ionized, while the northeast is rarefied, with ionized gas escaping. At the boundaries between ionized and molecular gas, the authors identify filaments, globules, elephant trunks, and dense regions with and without embedded young stellar objects. Radial and quadrant-averaged flux profiles sho
What carries the argument
The central mechanism is the multi-wavelength morphological overlay: emission-line flux maps and line-ratio maps (Hα/Hβ, [O III]/Hβ, [N II]/Hα, [S II]/Hα) from the new optical integral-field data are compared pixel-by-pixel with 12CO, 12 µm thermal dust, and far-infrared column density maps, using radial and quadrant profiles. This reveals coincidences and anticorrelations between ionized gas and neutral material, tracing ionization stratification, extinction asymmetry, and interfaces that the authors interpret as compression, photoevaporation, and shielding. The 30° inclined ring geometry proposed earlier explains the north-south extinction asymmetry in Hα/Hβ.
Load-bearing premise
The argument leans on treating spatial alignments and separations between Hα, CO, and dust as physical interactions (compression, shielding, photoevaporation) rather than line-of-sight projections of unrelated clouds at slightly different distances.
What would settle it
Measure the line-of-sight velocity fields of 12CO and Hα at the identified interface structures—the 'wrench' globule, the NGC 2237 region, the southeast cloud edge, and the arc near NGC 2244-334. If the molecular and ionized velocities show no systematic offset or compression signature across these boundaries, the apparent interactions are projection artifacts and the thin-sheet conclusion loses its support; if a coherent compression pattern appears, the conclusion is confirmed.
If this is right
- If the thin-sheet/filamentary progenitor interpretation is correct, the Rosette Nebula becomes a concrete local example where the geometry of the parent molecular cloud—not just stellar winds—sets the shape of an H II region.
- The dense interfaces identified (globules, the 'wrench', the 'seahorse', the NGC 2237 region) are places where compression by the expanding ionized gas may be triggering or modifying star formation; these regions are the natural targets for next-step kinematic and young-stellar-object studies.
- The quadrant asymmetry predicts that ionizing radiation escapes preferentially through the low-density northeast window, which should produce an observable blowout in surrounding large-scale interstellar-medium surveys.
- The authors state that a forthcoming kinematic analysis will test the compression interpretation; if it matches, it will reconcile the stellar-wind bubble age with the cluster age, resolving the earlier discrepancy.
- The demonstration that low-surface-brightness Hα (down to 1% of peak) traces the ionized-molecular interface with sub-parsec fidelity shows that similarly obtained integral-field datasets can map ionization fronts in other Galactic H II regions.
Where Pith is reading between the lines
- The same radial/quadrant overlay method could be applied to other H II regions observed with optical integral-field units to build a comparative taxonomy of interface morphologies; the Rosette would serve as the template for the 'thin-sheet' class.
- The projection ambiguity could be tested statistically by generating synthetic maps from simulated thin-sheet and spherical-cloud models convolved to the same resolution; if the observed anticorrelations require a sheet, the conclusion is strengthened; if not, the alternative remains open.
- Quantitative electron temperatures and densities are deferred due to preliminary calibration; once the absolute flux calibration is finalized, the line-ratio radial profiles could be converted into direct temperature and density gradients, checking whether the claimed ionization stratification holds.
- High-precision astrometry combined with the gas velocities would let one distinguish triggered formation of embedded clusters from co-eval formation; for example, the reported distance offset of NGC 2237 suggests co-eval formation, which is a testable prediction against future kinematic maps.
Editorial analysis
A structured set of objections, weighed in public.
Referee Report
Summary. This paper presents the first LVM integral-field spectroscopy of the Rosette Nebula, using 33,326 spectra from 19 tiles. It maps Hα, Hβ, [OIII], [NII], and [SII] emission and line-ratio maps, and compares these with 12CO (MWISP), 12µm dust emission (WISE), and Herschel-derived column density. Because the LVM absolute calibration is preliminary (Section 2.1), the analysis is explicitly based on relative fluxes and is qualitative. The authors identify a ring-like ionized structure with a central cavity, filaments, globules, and interaction zones, and examine radial and quadrant profiles of Hα, CO, and dust. They use [NII]/Hα versus [SII]/Hα diagrams with an assumed N+/N = 0.4 to discuss ionization structure. The main interpretive conclusion is that the Rosette Nebula formed from a non-homogeneous molecular cloud located at the edge of a filament and exhibiting a thin-sheet structure, consistent with the Wareing et al. (2018) models. A kinematic study is deferred to a forthcoming paper.
Significance. The paper is a useful early-science demonstration of LVM's ability to map an entire Galactic H II region at sub-parsec scales, and it provides a multi-wavelength morphological catalogue of the Rosette Nebula. The data will become public with SDSS DR20, and the comparison with CO, dust, and column-density maps is valuable. However, the primary interpretive claim—the thin-sheet/filament progenitor geometry—is not tested by the data as presented. All maps are projected, line-of-sight-integrated tracers, and line-of-sight depth is not constrained. The authors are transparent about the preliminary calibration and qualitative nature of the analysis, but the abstract and conclusions go beyond what the projected morphology alone can support. The paper is best viewed as a descriptive morphological foundation, with the structural scenario requiring confirmation by the planned kinematic analysis.
major comments (3)
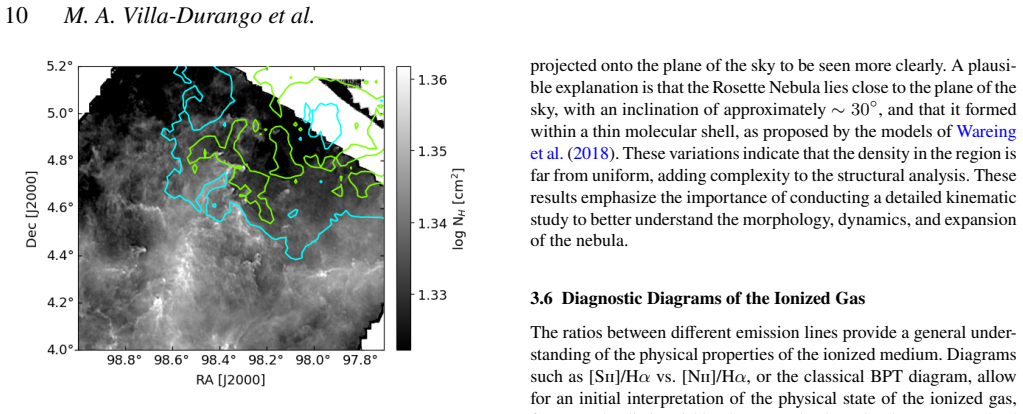
- [Section 5 and Section 3.5, Fig. 8] The conclusion that the Rosette Nebula "formed from a non-homogeneous molecular cloud... exhibiting a thin-sheet structure" rests on projected morphology. The quadrant radial profiles of CO, 12µm, and Hα are line-of-sight integrated; they cannot distinguish a thin sheet from an elongated distribution along the line of sight. The paper itself invokes projection as an alternative in specific cases: Section 4.2 says the arc near NGC 2244-334 "could represent a misinterpretation of the molecular cloud structure due to projection effects," and Section 3.5 allows CO inside the cavity to be "expanding perpendicularly to the plane of the nebula, located either in front of or behind it." Moreover, Section 4.1 cites Mužić et al. (2022) placing NGC 2237 ~85 pc behind NGC 2244, larger than the ~27 pc projected radius. Since kinematics are explicitly deferred, the thin-sheet/filament scenario is not
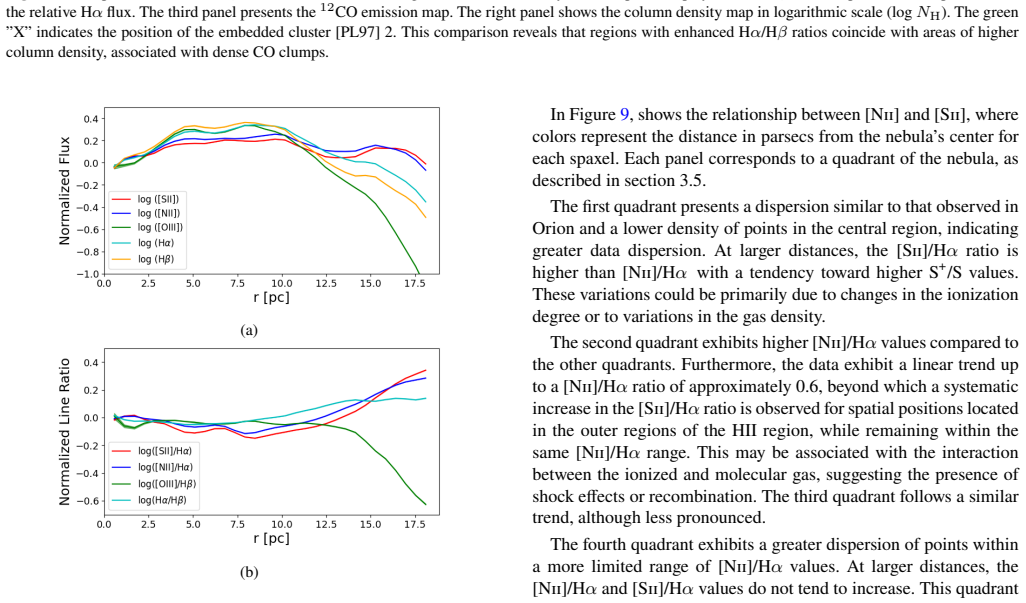
- [Sections 3.4-3.5, Figs. 7-8] The radial and quadrant profiles are shown without uncertainties. The line maps use S/N > 1 for [OIII], [NII], [SII], and Hβ (S/N ≥ 10 for Hα only, Section 2.1), so much of the outer-profile signal is low-S/N. Statements such as the first quadrant being "least dense" or the fourth quadrant having "elevated CO" are not accompanied by significance estimates. Because the paper deliberately avoids quantitative claims elsewhere, the reader cannot assess whether the asymmetries used to argue for a non-homogeneous progenitor are real or due to calibration noise and low-S/N selection. At minimum, bootstrap or noise-realization uncertainties should be added, or the text should explicitly label these differences as visual impressions rather than measured trends.
- [Section 3.6, Figs. 9-10] The diagnostic diagrams adopt N+/N = 0.4 as a fixed input, with the paper noting that the fraction "may vary throughout the RN." The subsequent quadrant and radial interpretation (e.g., trends toward higher S+/S, changes in ionization degree) is contingent on this hand-set value and on the Madsen et al. (2006) relation. Because N+/N is not derived from the data, the inferred spatial variation of S+/S is not an independent measurement. This is acceptable for a qualitative first pass, but the text should state explicitly that the spatial trends are model-dependent and do not by themselves establish an ionization gradient.
minor comments (6)
- [Section 2.5] Typo: "rgeovalues" should read "rgeo values".
- [Section 2.2] 12CO J=1-0 at 115 GHz is millimeter, not sub-millimeter; consider correcting the terminology.
- [Section 3.1] The Hα/Hβ ratio is used as an extinction tracer, but the preliminary relative calibration and lack of a reddening correction may affect the absolute ratio across the wavelength range. This caveat should be stated where the ratio map is interpreted.
- [Section 3.2] The text says the progenitor cloud extends "in the southeast–northeast direction," whereas later sections describe a southeast–northwest filament. Please check and unify the direction.
- [Section 3.4] The central flux used for normalization is described only by coordinate ranges; please specify how it is computed (mean, median) and, if possible, its uncertainty.
- [Section 3.6] Grammar: "In Figure 9, shows" should be "Figure 9 shows." Also, the Madsen et al. equation used for the S+/S lines is not written out; including it would improve reproducibility.
Circularity Check
No significant circularity: observational morphology study with external model comparison; central claims are interpretations of projected maps, not reductions of fitted inputs.
full rationale
This is an observational, morphology-focused study. It does not derive quantitative predictions from first principles, nor does it fit parameters to data and then rename them as predictions. The main conclusion—that the Rosette Nebula formed from a non-homogeneous molecular cloud at the edge of a filament with a thin-sheet structure—is a qualitative interpretation of projected morphological maps (Hα, CO, 12µm, Herschel column density), and it is explicitly compared to the external Wareing et al. (2018) hydrodynamical models. That is an external model test, not a circular validation. The only hand-set physical parameter, N+/N = 0.4, is adopted from prior H II region literature (Madsen et al. 2006; Kreckel et al. 2024) and is explicitly treated as an approximation for qualitative diagnostic diagrams; it is not fitted to the Rosette data. No equation in the paper reduces to its own input by construction. The cited LVM pipeline and data products (Sánchez et al. 2025; Kreckel et al. 2024; Moran et al. 2024) provide calibration and maps, but the structural conclusions do not depend on a self-citation chain or an imported uniqueness theorem. The projection degeneracy (line-of-sight depth) is a potential validity limitation, acknowledged locally for the arc near NGC 2244-334 (Section 4.2) and for CO inside the cavity (Section 3.5), but it is a correctness risk, not a circularity failure. The paper makes no derived claim that is tautologically equivalent to its inputs.
Axiom & Free-Parameter Ledger
free parameters (1)
- N+/N fraction in diagnostic diagrams =
0.4
axioms (5)
- domain assumption The preliminary LVM absolute flux calibration is reliable for relative flux and line-ratio morphology
- domain assumption Heliocentric distance of 1.5 kpc to the Rosette Nebula
- ad hoc to paper N+/N = 0.4 is representative of the interior of the Rosette Nebula and the Madsen et al. (2006) equation applies
- domain assumption Projected circular symmetry of the nebula justifies concentric-ring radial profiles
- domain assumption Spatial correspondence between different wavelength maps indicates physical association
read the original abstract
The Rosette Nebula is a well-known H II region shaped by the interaction of gas with the OB stars of the NGC 2244 stellar association. Located within the remnant of a giant molecular cloud, it exhibits a complex structure of ionized gas, molecular material, dust, and embedded clusters. In October 2023, the region was observed as part of the SDSS-V Local Volume Mapper (LVM) integral field spectroscopy survey. Covering a radius of approximately 1 degree, the dataset comprises 33,326 spectra with spatially resolved information spanning 390 - 980 nm. We present a structural analysis of the ionized, molecular, and dusty components using multi-wavelength observations: optical spectroscopy from SDSS-V LVM, 12CO emission from PMO/MWISP (sub-millimeter), and dust emission from WISE (12 micron) and Herschel (far-infrared). These datasets were complemented with the positions of ionizing stars to study emission structures traced by H alpha, H beta, [O III], [N II], and [S II], as well as the spatial distribution of line ratios (H alpha/H beta, [O III]/H beta, [N II]/H alpha, and [S II]/H alpha) relative to the surrounding molecular cloud. Our analysis reveals interaction zones between ionized and neutral gas, including filaments, globules, and dense regions with or without ongoing star formation. Radial and quadrant-based flux profiles further highlight morphological and ionization variations, supporting the scenario in which the Rosette Nebula evolved from a non-homogeneous molecular cloud with a thin, sheet-like structure.
Figures





Reference graph
Works this paper leans on
-
[1]
Bagnulo S., Hensberge H., Landstreet J. D., Szeifert T., Wade G. A., 2004, @doi [ ] 10.1051/0004-6361:20034283 , https://ui.adsabs.harvard.edu/abs/2004A&A...416.1149B 416, 1149
-
[2]
Barrera-Ballesteros J. K., et al., 2021, @doi [MNRAS] 10.1093/mnras/stab755 , https://ui.adsabs.harvard.edu/abs/2021MNRAS.503.3643B 503, 3643
-
[3]
C., Freire Ferrero R., Bourdin M
Bruhweiler F. C., Freire Ferrero R., Bourdin M. O., Gull T. R., 2010, @doi [ ] 10.1088/0004-637X/719/2/1872 , https://ui.adsabs.harvard.edu/abs/2010ApJ...719.1872B 719, 1872
-
[4]
Cambr \'e sy L., Marton G., Feher O., T \'o th L. V., Schneider N., 2013, @doi [ ] 10.1051/0004-6361/201321235 , https://ui.adsabs.harvard.edu/abs/2013A&A...557A..29C 557, A29
-
[5]
E., 1985, , https://ui.adsabs.harvard.edu/abs/1985A&A...144..171C 144, 171
Celnik W. E., 1985, , https://ui.adsabs.harvard.edu/abs/1985A&A...144..171C 144, 171
1985
-
[6]
Dent W. R. F., et al., 2009, @doi [ ] 10.1111/j.1365-2966.2009.14678.x , https://ui.adsabs.harvard.edu/abs/2009MNRAS.395.1805D 395, 1805
arXiv 2009
-
[7]
Drory N., et al., 2024, @doi [ ] 10.3847/1538-3881/ad6de9 , https://ui.adsabs.harvard.edu/abs/2024AJ....168..198D 168, 198
-
[8]
Gahm G. F., Carlqvist P., Johansson L. E. B., Nikoli \'c S., 2006, @doi [ ] 10.1051/0004-6361:20054494 , https://ui.adsabs.harvard.edu/abs/2006A&A...454..201G 454, 201
-
[9]
Gahm G. F., Grenman T., Fredriksson S., Kristen H., 2007, @doi [ ] 10.1086/512036 , https://ui.adsabs.harvard.edu/abs/2007AJ....133.1795G 133, 1795
-
[10]
Gaia Collaboration et al., 2021, @doi [ ] 10.1051/0004-6361/202039657 , https://ui.adsabs.harvard.edu/abs/2021A&A...649A...1G 649, A1
-
[11]
Griffin M. J., et al., 2010, @doi [A&A] 10.1051/0004-6361/201014519 , https://ui.adsabs.harvard.edu/abs/2010A&A...518L...3G 518, L3
-
[12]
Hennemann M., et al., 2010, @doi [ ] 10.1051/0004-6361/201014629 , https://ui.adsabs.harvard.edu/abs/2010A&A...518L..84H 518, L84
-
[13]
Herbst T. M., et al., 2024, @doi [ ] 10.3847/1538-3881/ad794810.1134/S1063772908070044 , https://ui.adsabs.harvard.edu/abs/2024AJ....168..267H 168, 267
arXiv 2024
-
[14]
F., Kere s D., O \ n orbe J., Faucher-Gigu \`e re C.-A., Quataert E., Murray N., Bullock J
Hopkins P. F., Kere s D., O \ n orbe J., Faucher-Gigu \`e re C.-A., Quataert E., Murray N., Bullock J. S., 2014, @doi [MNRAS] 10.1093/mnras/stu1738 , https://ui.adsabs.harvard.edu/abs/2014MNRAS.445..581H 445, 581
-
[15]
Hu Y., Lazarian A., Stanimirovi \'c S., 2021, @doi [ ] 10.3847/1538-4357/abedb7 , https://ui.adsabs.harvard.edu/abs/2021ApJ...912....2H 912, 2
-
[16]
Kewley L. J., Nicholls D. C., Sutherland R. S., 2019, @doi [ ] 10.1146/annurev-astro-081817-051832 , https://ui.adsabs.harvard.edu/abs/2019ARA&A..57..511K 57, 511
-
[17]
Kim J.-G., Kim W.-T., Ostriker E. C., 2018, @doi [APJ] 10.3847/1538-4357/aabe27 , https://ui.adsabs.harvard.edu/abs/2018ApJ...859...68K 859, 68
-
[18]
Kollmeier J. A., et al., 2025, Sloan Digital Sky Survey-V: Pioneering Panoptic Spectroscopy ( @eprint arXiv 2507.06989 ), https://arxiv.org/abs/2507.06989
Pith/arXiv arXiv 2025
-
[19]
Konidaris N. P., et al., 2024, in Bryant J. J., Motohara K., Vernet J. R. D., eds, Society of Photo-Optical Instrumentation Engineers (SPIE) Conference Series Vol. 13096, Ground-based and Airborne Instrumentation for Astronomy X. p. 130961Z, @doi 10.1117/12.3019892
-
[20]
Kreckel K., et al., 2024, @doi [ ] 10.1051/0004-6361/202449943 , https://ui.adsabs.harvard.edu/abs/2024A&A...689A.352K 689, A352
-
[21]
R., et al., 2014, in Beuther H., Klessen R
Krumholz M. R., et al., 2014, in Beuther H., Klessen R. S., Dullemond C. P., Henning T., eds, Protostars and Planets VI. pp 243--266 ( @eprint arXiv 1401.2473 ), @doi 10.2458/azu_uapress_9780816531240-ch011
Pith/arXiv arXiv 2014
-
[22]
Li C., Wang H., Zhang M., Ma Y., Fang M., Yang J., 2018, @doi [ ] 10.3847/1538-4365/aad963 , https://ui.adsabs.harvard.edu/abs/2018ApJS..238...10L 238, 10
-
[23]
Lim B., et al., 2021, @doi [AJ] 10.3847/1538-3881/abffd8 , https://ui.adsabs.harvard.edu/abs/2021AJ....162...56L 162, 56
-
[24]
Lombardi M., Bouy H., Alves J., Lada C. J., 2014, @doi [ ] 10.1051/0004-6361/201323293 , https://ui.adsabs.harvard.edu/abs/2014A&A...566A..45L 566, A45
-
[25]
Madsen G. J., Reynolds R. J., Haffner L. M., 2006, @doi [ ] 10.1086/508441 , https://ui.adsabs.harvard.edu/abs/2006ApJ...652..401M 652, 401
doi:10.1086/508441 2006
-
[26]
Mahy L., Naz \'e Y., Rauw G., Gosset E., De Becker M., Sana H., Eenens P., 2009, @doi [ ] 10.1051/0004-6361/200911662 , https://ui.adsabs.harvard.edu/abs/2009A&A...502..937M 502, 937
-
[27]
M \"a kel \"a M. M., Haikala L. K., Gahm G. F., 2014, @doi [ ] 10.1051/0004-6361/201423440 , https://ui.adsabs.harvard.edu/abs/2014A&A...567A.108M 567, A108
-
[28]
M \"a kel \"a M. M., Haikala L. K., Gahm G. F., 2017, @doi [ ] 10.1051/0004-6361/201525655 , https://ui.adsabs.harvard.edu/abs/2017A&A...605A..82M 605, A82
-
[29]
Martins F., Mahy L., Hillier D. J., Rauw G., 2012, @doi [ ] 10.1051/0004-6361/201117458 , https://ui.adsabs.harvard.edu/abs/2012A&A...538A..39M 538, A39
-
[30]
McLeod A. F., Dale J. E., Ginsburg A., Ercolano B., Gritschneder M., Ramsay S., Testi L., 2015, @doi [ ] 10.1093/mnras/stv680 , https://ui.adsabs.harvard.edu/abs/2015MNRAS.450.1057M 450, 1057
-
[31]
McLeod A. F., Dale J. E., Evans C. J., Ginsburg A., Kruijssen J. M. D., Pellegrini E. W., Ramsay S. K., Testi L., 2019, @doi [MNRAS] 10.1093/mnras/sty2696 , https://ui.adsabs.harvard.edu/abs/2019MNRAS.486.5263M 486, 5263
-
[32]
Meisner A. M., Finkbeiner D. P., 2014, @doi [ ] 10.1088/0004-637X/781/1/5 , https://ui.adsabs.harvard.edu/abs/2014ApJ...781....5M 781, 5
-
[33]
Mejia A., in prep, LVM Data Reduction Pipeline
-
[34]
Mellema G., Arthur S. J., Henney W. J., Iliev I. T., Shapiro P. R., 2006, @doi [ ] 10.1086/505294 , https://ui.adsabs.harvard.edu/abs/2006ApJ...647..397M 647, 397
-
[35]
E., Rom \'a n-Z \'u \ n iga C., 2024, in American Astronomical Society Meeting Abstracts
Moran E., Ybarra J. E., Rom \'a n-Z \'u \ n iga C., 2024, in American Astronomical Society Meeting Abstracts. p. 402.19
2024
-
[36]
Motte F., et al., 2010, @doi [ ] 10.1051/0004-6361/201014690 , https://ui.adsabs.harvard.edu/abs/2010A&A...518L..77M 518, L77
-
[37]
Mu z i \'c K., Scholz A., Pe \ n a Ram \' rez K., Jayawardhana R., Sch \"o del R., Geers V. C., Cieza L. A., Bayo A., 2019, @doi [ ] 10.3847/1538-4357/ab2da4 , https://ui.adsabs.harvard.edu/abs/2019ApJ...881...79M 881, 79
-
[38]
Mu z i \'c K., Almendros-Abad V., Bouy H., Kubiak K., Pe \ n a Ram \' rez K., Krone-Martins A., Moitinho A., Concei c \ a o M., 2022, @doi [ ] 10.1051/0004-6361/202243659 , https://ui.adsabs.harvard.edu/abs/2022A&A...668A..19M 668, A19
-
[39]
J., Simard L., Takami H., eds, Proceedings of SPIE Vol
Perruchot S., et al., 2018, in Evans C. J., Simard L., Takami H., eds, Proceedings of SPIE Vol. 10702, Ground-based and Airborne Instrumentation for Astronomy VII. SPIE, p. 107027K, @doi 10.1117/12.2311996 , https://doi.org/10.1117/12.2311996
-
[40]
Phelps R. L., Lada E. A., 1997, @doi [ ] 10.1086/303713 , https://ui.adsabs.harvard.edu/abs/1997ApJ...477..176P 477, 176
-
[41]
Poglitsch A., et al., 2010, @doi [ ] 10.1051/0004-6361/201014535 , https://ui.adsabs.harvard.edu/abs/2010A&A...518L...2P 518, L2
-
[42]
Poulton C. J., Robitaille T. P., Greaves J. S., Bonnell I. A., Williams J. P., Heyer M. H., 2008, @doi [ ] 10.1111/j.1365-2966.2007.12556.x , https://ui.adsabs.harvard.edu/abs/2008MNRAS.384.1249P 384, 1249
arXiv 2008
-
[43]
Pribulla T., et al., 2010, @doi [Astronomische Nachrichten] 10.1002/asna.201011351 , https://ui.adsabs.harvard.edu/abs/2010AN....331..397P 331, 397
-
[44]
Star Formation in the Rosette Complex
Rom \'a n-Z \'u \ n iga C. G., Lada E. A., 2008, in Reipurth B., ed., , Vol. 4, Handbook of Star Forming Regions, Volume I. p. 928, @doi 10.48550/arXiv.0810.0931
work page internal anchor Pith review Pith/arXiv arXiv doi:10.48550/arxiv.0810.0931 2008
-
[45]
G., Elston R., Ferreira B., Lada E
Rom \'a n-Z \'u \ n iga C. G., Elston R., Ferreira B., Lada E. A., 2008, @doi [ ] 10.1086/523785 , https://ui.adsabs.harvard.edu/abs/2008ApJ...672..861R 672, 861
-
[46]
S \'a nchez S. F., 2020, @doi [ ] 10.1146/annurev-astro-012120-013326 , https://ui.adsabs.harvard.edu/abs/2020ARA&A..58...99S 58, 99
-
[47]
S \'a nchez S. F., et al., 2025, @doi [ ] 10.3847/1538-3881/ad93bb , https://ui.adsabs.harvard.edu/abs/2025AJ....169...52S 169, 52
-
[48]
Scheuermann F., et al., 2023, @doi [MNRAS] 10.1093/mnras/stad878 , https://ui.adsabs.harvard.edu/abs/2023MNRAS.522.2369S 522, 2369
-
[49]
Schneider N., et al., 2010, @doi [ ] 10.1051/0004-6361/201014627 , https://ui.adsabs.harvard.edu/abs/2010A&A...518L..83S 518, L83
-
[50]
Shang L.-H., et al., 2022, @doi [ ] 10.3847/1538-4365/ac5831 , https://ui.adsabs.harvard.edu/abs/2022ApJS..259...63S 259, 63
-
[51]
Swinyard B. M., et al., 2010, @doi [ ] 10.1051/0004-6361/201014605 , https://ui.adsabs.harvard.edu/abs/2010A&A...518L...4S 518, L4
-
[52]
Wang J., Townsley L. K., Feigelson E. D., Broos P. S., Getman K. V., Rom \'a n-Z \'u \ n iga C. G., Lada E., 2008, @doi [ ] 10.1086/526406 , https://ui.adsabs.harvard.edu/abs/2008ApJ...675..464W 675, 464
-
[53]
Wang J., Feigelson E. D., Townsley L. K., Broos P. S., Rom \'a n-Z \'u \ n iga C. G., Lada E., Garmire G., 2010, @doi [ ] 10.1088/0004-637X/716/1/474 , https://ui.adsabs.harvard.edu/abs/2010ApJ...716..474W 716, 474
-
[54]
Wareing C. J., Pittard J. M., Wright N. J., Falle S. A. E. G., 2018, @doi [ ] 10.1093/mnras/sty148 , https://ui.adsabs.harvard.edu/abs/2018MNRAS.475.3598W 475, 3598
-
[55]
Wilson T. L., Bania T. M., Balser D. S., 2015, @doi [ ] 10.1088/0004-637X/812/1/45 , https://ui.adsabs.harvard.edu/abs/2015ApJ...812...45W 812, 45
-
[56]
Wright E. L., et al., 2010, @doi [ ] 10.1088/0004-6256/140/6/1868 , https://ui.adsabs.harvard.edu/abs/2010AJ....140.1868W 140, 1868
-
[57]
Ybarra J. E., Lada E. A., Rom \'a n-Z \'u \ n iga C. G., Balog Z., Wang J., Feigelson E. D., 2013, @doi [ ] 10.1088/0004-637X/769/2/140 , https://ui.adsabs.harvard.edu/abs/2013ApJ...769..140Y 769, 140
-
[58]
Zari E., Lombardi M., Alves J., Lada C. J., Bouy H., 2016, @doi [ ] 10.1051/0004-6361/201526597 , https://ui.adsabs.harvard.edu/abs/2016A&A...587A.106Z 587, A106
-
[59]
write newline
" write newline "" before.all 'output.state := FUNCTION fin.entry write newline FUNCTION new.block output.state before.all = 'skip after.block 'output.state := if FUNCTION new.sentence output.state after.block = 'skip output.state before.all = 'skip after.sentence 'output.state := if if FUNCTION not #0 #1 if FUNCTION and 'skip pop #0 if FUNCTION or pop #1...
discussion (0)
Sign in with ORCID, Apple, or X to comment. Anyone can read and Pith papers without signing in.