REVIEW 4 major objections 5 minor 31 references
3DAeroRelief: The first 3D Benchmark UAV Dataset for Post-Disaster Assessment
T0 review · 4 major / 5 minor · reviewed 2026-08-04 · deepseek-v4-flash
Pith's one-line read 3DAeroRelief, the first 3D benchmark dataset for post-disaster assessment, is built from UAV footage of Hurricane Ian and lets segmentation models distinguish damaged from undamaged buildings.
desk verdict A genuinely new 3D post-disaster benchmark with a plausible pipeline, but the label-projection step has a real occlusion-based flaw that goes unquantified. read the letter →
The pith
A machine-rendered reading of the paper's core claim, the machinery that carries it, and where it could break.
The reading
What carries the argument
The dataset-generation pipeline is the load-bearing mechanism. Frames from 1920×1080 UAV video are processed with Structure-from-Motion (SfM) to recover camera poses and a sparse structure, then Multi-View Stereo (MVS) densifies it into point clouds. The reconstruction is rescaled to metric units using the assumed height of a single-story house (≈3 m). For ground truth, every tenth frame is manually labeled in 2D, and those labels are projected into 3D using the recovered camera matrices; each point receives the majority vote of its projections, and final inconsistencies are corrected manually in 3D editing software. The result is 64 annotated point clouds, split by area so models train on s
What would settle it
Take ten of the 64 published point clouds and have two independent annotators label them from scratch in 3D; if their agreement (e.g., Cohen's kappa on the five classes) is low, or if their labels differ from the published ones on more than a few percent of points, the benchmark's ground truth is not stable enough to rank models.
Extended reading notes
Core claim
The central claim, stated on the paper's own terms, is that 3DAeroRelief fills a gap that no existing 3D benchmark covers: large-scale outdoor scenes with fine-grained structural damage from a real disaster. The dataset provides 64 point clouds from eight areas, each with at least one damaged building, plus labels for building damage status, road, tree, and background. The authors argue that because the point clouds come from cheap UAV footage rather than expensive LiDAR, the benchmark captures a practical, deployable sensing modality for emergency response. Their baseline results show the problem is far from solved, with the best model scoring 0.4584 mean IoU and 0.5508 mean accuracy overal
Load-bearing premise
The benchmark's trustworthiness rests on the assumption that the 2D manual labels, once projected into 3D and refined, are correct ground truth; the paper gives no inter-annotator agreement measure or independent label check.
Editorial extensions
If this is right
- Automatic damage maps could be produced from new UAV sorties by training a segmentation network on this benchmark.
- The provided split allows a direct comparison of how well models generalize to a previously unseen disaster area.
- The low baseline scores (best mIoU 0.4584) imply that current 3D segmentation methods are not yet reliable for disaster assessment, giving the field a concrete target to improve.
- The benchmark shifts 3D semantic segmentation evaluations from indoor and street scenes to real, cluttered outdoor disaster scenes.
Reading between the lines
- Beyond the paper: label quality is the main risk; because labels are projected from 2D, a quantitative inter-annotator study or an independent manual 3D re-annotation of a subset would tell users how much noise to expect.
- Beyond the paper: the metric rescaling uses an assumed house height of about 3 meters; checking the point clouds against ground control points or GPS would put the absolute scale on firmer footing.
- Beyond the paper: a temporal version of the benchmark, pairing pre-disaster and post-disaster flights over the same areas, would enable change-based damage detection rather than single-frame classification.
- Beyond the paper: the same capture and annotation pipeline could be repeated for other disaster types (earthquake, flood, wildfire), testing whether damage patterns learned here transfer.
Editorial analysis
A structured set of objections, weighed in public.
Referee Report
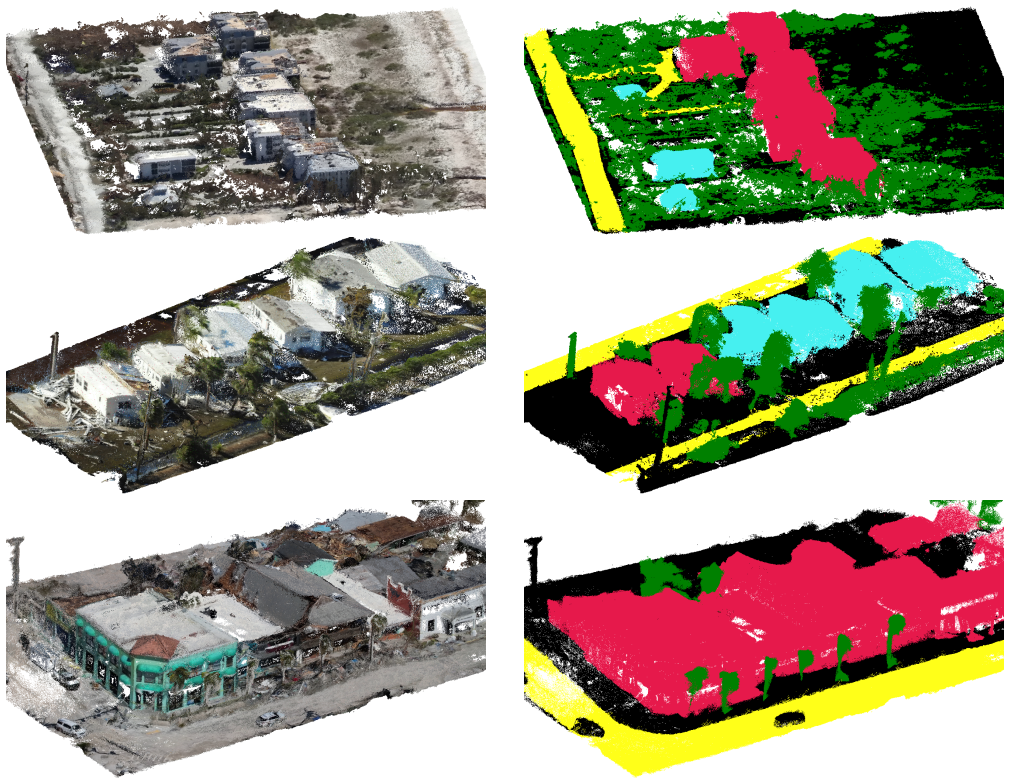
Summary. The manuscript introduces 3DAeroRelief, claimed to be the first 3D benchmark dataset specifically designed for post-disaster assessment. The dataset is constructed from UAV video collected over Hurricane Ian damage in Florida, processed with Structure-from-Motion and Multi-View Stereo into 64 dense point clouds from eight areas. Semantic labels for five classes (Building-no-damage, Building-damage, Road, Tree, Background) are produced by manually annotating every 10th frame in 2D, projecting these labels into 3D via majority voting, and refining interactively in CloudCompare. The paper also reports baseline mIoU/mAcc results for five state-of-the-art point cloud segmentation methods using a cross-area train/test split. The central claim is that the dataset fills a gap in 3D semantic segmentation for disaster response.
Significance. If the dataset is made publicly available and the ground-truth labels are reliable, 3DAeroRelief would be a useful community resource: it is one of the first 3D outdoor benchmarks tailored to post-disaster structural damage, uses low-cost UAV collection rather than expensive LiDAR, and provides a challenging cross-area evaluation setup. The authors also evaluate several representative modern segmentation architectures, which gives an initial sense of task difficulty. However, the current manuscript does not provide a data download link, any quantitative validation of the annotation process, or reconstruction accuracy metrics. These omissions currently prevent the dataset from being used or independently verified, so the practical significance is contingent on the authors supplying that missing evidence.
major comments (4)
- [§2.4.2] The 2D-to-3D label projection does not perform any occlusion or depth testing. A 3D point is considered to have a 'valid' projection simply if it falls inside the image bounds of an annotated frame. Consequently, a point on a building behind a tree or behind another damaged structure can project onto the foreground object's 2D segment and receive that object's label. The majority vote over every-10th-frame annotations cannot correct systematic occlusions if most visible projections are of the occluder. The CloudCompare refinement is described but no inter-annotator agreement, per-class error rate, or before/after refinement statistics are reported. Because Tables 3 and 4 are benchmark numbers built on this ground truth, this unquantified labeling bias is load-bearing. Please provide either a depth-aware projection, an independent annotation audit, or quantitative evidence that occlusion
- [§3 and §5] No dataset download URL, DOI, hosting repository, or data-availability statement is provided anywhere in the manuscript. Section 5 ('Code Availability') only states that '3DAeroRelief can be used without any accompanying code'; it does not say where to obtain the dataset. For a dataset paper, public access is the central deliverable, and its absence means the benchmark cannot currently be inspected, reproduced, or used. The authors should add a Data Availability statement with a stable link and license before the paper can be considered for publication.
- [§2.3.1] The absolute rescaling procedure relies on a single assumed reference: the average height of a single-story house, with h_real ≈ 3 meters, manually identified in the point cloud. No ground control points, known distances, or independent validation are provided. Scale errors directly affect the metric coordinates of the point clouds and any evaluation that depends on physical scale (e.g., voxel sizes, neighbor radii). Even if the semantic labels are unaffected, the claim that the reconstructions are aligned to 'real-world dimensions' is not supported. Please report the uncertainty of the scale factor or validate it against surveyed measurements.
- [§2.2, §4.2] The reconstruction quality is not quantitatively validated. The paper does not report SfM reprojection errors, MVS fusion statistics, or any comparison with an independent reference. Since 2D labels are projected using the SfM camera parameters, reconstruction errors can degrade both geometry and label accuracy. Additionally, the baseline experiments in Tables 3 and 4 lack training details (epochs, batch size, point density, voxelization parameters, optimizer settings) and contain no repeated-run variance. Without error bars, large performance gaps such as PTv2's Building-Damage mIoU of 0.002 versus PTv3's 0.761 cannot be interpreted reliably. Please report the experimental protocol and standard deviations over multiple runs.
minor comments (5)
- [Figure 1] Typos in the caption: 'damge' appears twice; should be 'damage'. Also the color description should be consistent with labels.txt.
- [§2.4.1] The phrase 'every 10th of order frame' is unclear; presumably 'every 10th frame'. Please rephrase.
- [Global] There are inconsistent spacings in 'UA Vs' and 'UAVs'; please standardize. The corresponding author's name is also misspelled as 'Ranehmoonfar' in the correspondence line.
- [Table 1] The 'Avg. Points per Scan' value of 0.520 million for 3DAeroRelief is not derived from any supporting statistic, and the paper does not report per-class point counts or class distributions. Such information is important for understanding the benchmark's difficulty and class imbalance.
- [References] References 20 and 28 are the same ScanNet++ paper; please consolidate. The table references '33' in the baseline list of Section 4.2 but the text names only five methods; please align the reference numbers.
Circularity Check
No significant circularity: the dataset is constructed from external UAV data and manual annotation, and the benchmark evaluations are standard model comparisons not derived from the dataset's own claims.
full rationale
The paper's central contribution is a new 3D benchmark dataset. The reconstruction pipeline (SfM/MVS, Section 2.2), annotation procedure (manual 2D labeling projected to 3D, Section 2.4), and evaluation of SOTA models (Section 4.2) are all externally grounded: point clouds come from UAV footage, labels come from human annotation, and model results are measured against that fixed ground truth. No equation or parameter in the paper is fitted to the benchmark numbers and then presented as a prediction; the dataset is not defined in terms of the model outputs or vice versa. The authors do cite their own prior datasets (FloodNet, RescueNet) for inspiration and label-scheme consistency, but these citations are not load-bearing for the claim of being the first 3D post-disaster benchmark, which is supported by comparison to other 3D datasets in Table 1. The only mildly self-referential aspect is that the authors created both the dataset and the evaluation, which is normal for dataset papers and does not constitute circular reasoning. Therefore no circular step can be quoted and exhibited, and the appropriate score is 1 rather than 0 only to acknowledge the presence of self-citations in the background sections, which are not load-bearing.
Assumptions & free parameters
free parameters (1)
- h_real =
~3 meters
assumptions (3)
- domain assumption SfM/MVS reconstruction produces geometrically accurate point clouds of the disaster scenes.
- domain assumption 2D manual labels projected via majority voting and refined with CloudCompare yield correct 3D semantic labels.
- domain assumption The cross-area train/test split (Area 2 held out) tests generalization to unseen disaster regions.
Cite this review
Pith. "Pith review of 3DAeroRelief: The first 3D Benchmark UAV Dataset for Post-Disaster Assessment." pith.science (2026). https://pith.science/paper/USRBOPOU
@misc{pith2026250911097,
  author       = {Pith},
  title        = {Pith review of: 3DAeroRelief: The first 3D Benchmark UAV Dataset for Post-Disaster Assessment},
  year         = {2026},
  howpublished = {\url{https://pith.science/paper/USRBOPOU}},
  note         = {Machine review of arXiv:2509.11097}
}
read the original abstract
Timely assessment of structural damage is critical for disaster response and recovery. However, most prior work in natural disaster analysis relies on 2D imagery, which lacks depth, suffers from occlusions, and provides limited spatial context. 3D semantic segmentation offers a richer alternative, but existing 3D benchmarks focus mainly on urban or indoor scenes, with little attention to disaster-affected areas. To address this gap, we present 3DAeroRelief--the first 3D benchmark dataset specifically designed for post-disaster assessment. Collected using low-cost unmanned aerial vehicles (UAVs) over hurricane-damaged regions, the dataset features dense 3D point clouds reconstructed via Structure-from-Motion and Multi-View Stereo techniques. Semantic annotations were produced through manual 2D labeling and projected into 3D space. Unlike existing datasets, 3DAeroRelief captures 3D large-scale outdoor environments with fine-grained structural damage in real-world disaster contexts. UAVs enable affordable, flexible, and safe data collection in hazardous areas, making them particularly well-suited for emergency scenarios. To demonstrate the utility of 3DAeroRelief, we evaluate several state-of-the-art 3D segmentation models on the dataset to highlight both the challenges and opportunities of 3D scene understanding in disaster response. Our dataset serves as a valuable resource for advancing robust 3D vision systems in real-world applications for post-disaster scenarios.
Figures


Figures from the paper (2 more)


Reference graph
Works this paper leans on
-
[2]
Sarkar, A., Chowdhury, T., Murphy, R. R., Gangopadhyay, A. & Rahnemoonfar, M. Sam-vqa: Supervised attention-based visual question answering model for post-disaster damage assessment on remote sensing imagery.IEEE Transactions on Geosci. Remote. Sens.61, 1–16, 10.1109/TGRS.2023.3276293 (2023)
arXiv 2023
-
[3]
Sarkar, A. & Rahnemoonfar, M. Grad-cam aware supervised attention for visual question answering for post-disaster damage assessment. In2022 IEEE International Conference on Image Processing (ICIP), 3783–3787, 10.1109/ICIP46576. 2022.9897381 (2022)
arXiv 2022
-
[4]
& Rahnemoonfar, M
Chowdhury, T. & Rahnemoonfar, M. Attention for damage assessment. InICML 2021 Workshop on Tackling Climate Change with Machine Learning(2021)
2021
-
[5]
Chowdhury, T. & Rahnemoonfar, M. Attention based semantic segmentation on uav dataset for natural disaster damage assessment. In2021 IEEE International Geoscience and Remote Sensing Symposium IGARSS, 2325–2328, 10.1109/IGARSS 47720.2021.9553712 (2021)
arXiv 2021
-
[6]
Chowdhury, T. & Rahnemoonfar, M. Self attention based semantic segmentation on a natural disaster dataset. In2021 IEEE International Conference on Image Processing (ICIP), 2798–2802, 10.1109/ICIP42928.2021.9506366 (2021)
arXiv 2021
-
[7]
Rahnemoonfar, M.et al.Floodnet: A high resolution aerial imagery dataset for post flood scene understanding (2020). 2012.02951
arXiv 2020
-
[8]
& Murphy, R
Rahnemoonfar, M., Chowdhury, T. & Murphy, R. Rescuenet: a high resolution uav semantic segmentation dataset for natural disaster damage assessment.Sci. data10, 913 (2023)
2023
-
[9]
Qi, C. R., Su, H., Mo, K. & Guibas, L. J. Pointnet: Deep learning on point sets for 3d classification and segmentation.arXiv preprint arXiv:1612.00593(2016)
arXiv 2016
Show all 31 references
-
[10]
R., Yi, L., Su, H
Qi, C. R., Yi, L., Su, H. & Guibas, L. J. Pointnet++: Deep hierarchical feature learning on point sets in a metric space. arXiv preprint arXiv:1706.02413(2017)
2017 arXiv
-
[11]
In Bengio, S.et al.(eds.)Advances in Neural Information Processing Systems, vol
Li, Y .et al.Pointcnn: Convolution on x-transformed points. In Bengio, S.et al.(eds.)Advances in Neural Information Processing Systems, vol. 31 (Curran Associates, Inc., 2018)
2018
-
[12]
InProceedings of the IEEE/CVF International Conference on Computer Vision (ICCV)(2019)
Thomas, H.et al.Kpconv: Flexible and deformable convolution for point clouds. InProceedings of the IEEE/CVF International Conference on Computer Vision (ICCV)(2019)
2019
-
[13]
IEEE Conf
Hu, Q.et al.Randla-net: Efficient semantic segmentation of large-scale point clouds.Proc. IEEE Conf. on Comput. Vis. Pattern Recognit.(2020)
2020
-
[14]
Zhao, H., Jiang, L., Jia, J., Torr, P. H. & Koltun, V . Point transformer. InProceedings of the IEEE/CVF International Conference on Computer Vision, 16259–16268 (2021)
2021
-
[15]
& Zhao, H
Wu, X., Lao, Y ., Jiang, L., Liu, X. & Zhao, H. Point transformer v2: Grouped vector attention and partition-based pooling. InNeurIPS(2022)
2022
-
[16]
InProceedings of the IEEE/CVF Conference on Computer Vision and Pattern Recognition (CVPR), 21305–21315 (2024)
Peng, B.et al.Oa-cnns: Omni-adaptive sparse cnns for 3d semantic segmentation. InProceedings of the IEEE/CVF Conference on Computer Vision and Pattern Recognition (CVPR), 21305–21315 (2024). 17.Wu, X.et al.Point transformer v3: Simpler, faster, stronger. InCVPR(2024)
2024
-
[18]
InProceedings of the IEEE/CVF Conference on Computer Vision and Pattern Recognition (CVPR), 1534–1543 (2016)
Armeni, I.et al.3d semantic parsing of large-scale indoor spaces. InProceedings of the IEEE/CVF Conference on Computer Vision and Pattern Recognition (CVPR), 1534–1543 (2016). 10/12
2016
-
[19]
Dai, A.et al.Scannet: Richly-annotated 3d reconstructions of indoor scenes. InProc. Computer Vision and Pattern Recognition (CVPR), IEEE(2017)
2017
-
[20]
& Dai, A
Rozenberszki, D., Litany, O. & Dai, A. Language-grounded indoor 3d semantic segmentation in the wild. InProceedings of the European Conference on Computer Vision (ECCV)(2022)
2022
-
[21]
& Dai, A
Yeshwanth, C., Liu, Y .-C., Nießner, M. & Dai, A. Scannet++: A high-fidelity dataset of 3d indoor scenes. InProceedings of the International Conference on Computer Vision (ICCV)(2023)
2023
-
[22]
Behley, J.et al.SemanticKITTI: A Dataset for Semantic Scene Understanding of LiDAR Sequences. InProc. of the IEEE/CVF International Conf. on Computer Vision (ICCV)(2019)
2019
-
[23]
Varney, N., Asari, V . K. & Graehling, Q. Dales: A large-scale aerial lidar data set for semantic segmentation. In2020 IEEE/CVF Conference on Computer Vision and Pattern Recognition Workshops (CVPRW), 717–726, 10.1109/CVPRW50498 .2020.00101 (2020)
2020
-
[24]
InProceedings of the IEEE/CVF Conference on Computer Vision and Pattern Recognition (CVPR)(2020)
Sun, P.et al.Scalability in perception for autonomous driving: Waymo open dataset. InProceedings of the IEEE/CVF Conference on Computer Vision and Pattern Recognition (CVPR)(2020)
2020
-
[25]
InProceedings of the IEEE/CVF Conference on Computer Vision and Pattern Recognition (CVPR)(2020)
Caesar, H.et al.nuscenes: A multimodal dataset for autonomous driving. InProceedings of the IEEE/CVF Conference on Computer Vision and Pattern Recognition (CVPR)(2020)
2020
-
[26]
& Geiger, A
Liao, Y ., Xie, J. & Geiger, A. Kitti-360: A novel dataset and benchmarks for urban scene understanding in 2d and 3d. In IEEE Trans. on Pattern Analysis and Machine Intelligence (PAMI)(2022)
2022
-
[27]
& Roche, F
Gaydon, C., Daab, M. & Roche, F. Fractal: An ultra-large-scale aerial lidar dataset for 3d semantic segmentation of diverse landscapes (2024). 2405.04634
2024 arXiv
-
[28]
& Dai, A
Yeshwanth, C., Liu, Y .-C., Nießner, M. & Dai, A. Scannet++: A high-fidelity dataset of 3d indoor scenes. InProceedings of the IEEE/CVF International Conference on Computer Vision (ICCV), 12–22 (2023)
2023
-
[29]
Schönberger, J. L. & Frahm, J.-M. Structure-from-motion revisited. InConference on Computer Vision and Pattern Recognition (CVPR)(2016)
2016
-
[30]
L., Zheng, E., Pollefeys, M
Schönberger, J. L., Zheng, E., Pollefeys, M. & Frahm, J.-M. Pixelwise view selection for unstructured multi-view stereo. InEuropean Conference on Computer Vision (ECCV)(2016)
2016
-
[31]
Cloudcompare (version 2.13.2) [gpl software] (2025)
CloudCompare development team. Cloudcompare (version 2.13.2) [gpl software] (2025). https://www.cloudcompare.org/
2025
-
[32]
& Park, J
Park, C., Jeong, Y ., Cho, M. & Park, J. Fast point transformer. InProceedings of the IEEE/CVF Conference on Computer Vision and Pattern Recognition (CVPR), 16949–16958 (2022)
2022
-
[33]
& Savarese, S
Choy, C., Gwak, J. & Savarese, S. 4d spatio-temporal convnets: Minkowski convolutional neural networks. InProceedings of the IEEE Conference on Computer Vision and Pattern Recognition, 3075–3084 (2019). Acknowledgements We gratefully acknowledge the Center for Robot-Assisted S...
2019
Reviewed August 4, 2026 · model on record in the stance chip above.
Discussion (0). Sign in to comment.