Compression, Impact and Hot Rebound Flows from Coronal Rain Downflows
Pith reviewed 2026-05-18 16:56 UTC · model grok-4.3
The pith
Coronal rain clumps compress plasma, impact the transition region, and generate hot rebound flows that reheat loops but carry less than 15% of their kinetic energy.
A machine-rendered reading of the paper's core claim, the machinery that carries it, and where it could break.
Core claim
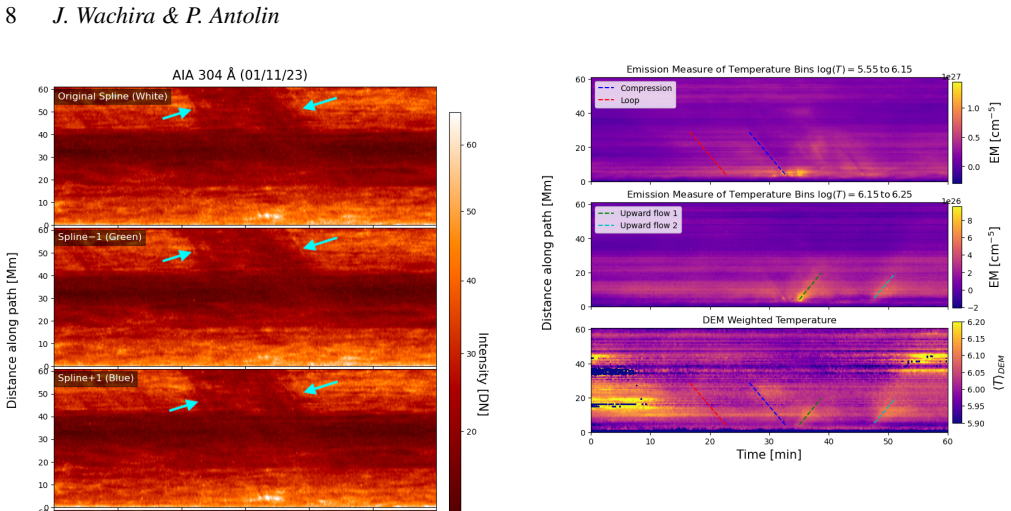
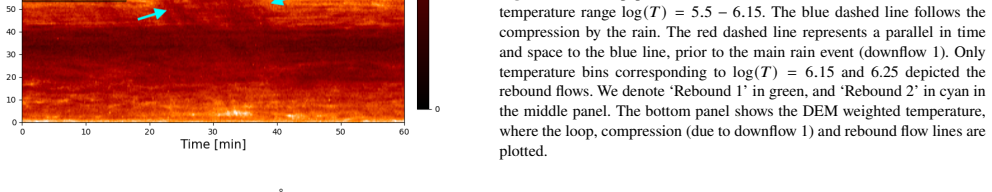
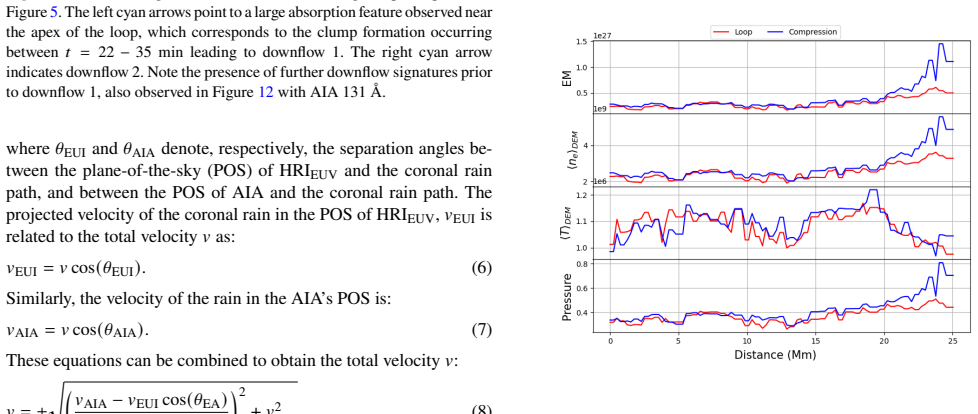
In the observed event, falling rain clumps with cool EUV-absorbing cores of about 600 km and densities near 6 times 10 to the 11 per cubic centimeter are preceded by mostly isothermal compressions. These compressions suggest energy transfer into the rain that decelerates it and may reduce cooling rates on accretion-braking timescales. The impacts reach the lower transition region and are visible across EUV channels and in SJI 1400 angstroms, generating hot rebound flows at 10 to the 6.2 to 10 to the 6.3 K and 85 to 87 km per second. These flows refill and reheat the loop yet carry less than 15 percent of the clumps' kinetic energy. Steady footpoint heating signatures with amplitude 10 to the
What carries the argument
Hot rebound flows generated by rain-clump impacts on the lower transition region, which refill and reheat the coronal loop while transferring only a minor fraction of the incoming kinetic energy.
If this is right
- The shower releases a total energy of 4.64 times 10 to the 26 erg, comparable to a microflare.
- Coronal rain can act as a template for studying accretion braking in other contexts.
- Steady footpoint heating with scale heights of 2 to 10 Mm matches values seen in active regions.
- Coronal rain serves as a proxy for the integrated heating that drives TNE-TI cycles.
Where Pith is reading between the lines
- If rebound flows carry so little kinetic energy, most of the rain's energy is likely converted to heat near the impact site.
- Repeated observations of such events could provide an independent way to estimate the total energy input needed to maintain coronal loops.
- The detected heating amplitude and scale height offer a direct link between rain formation and the underlying energy deposition mechanism.
Load-bearing premise
The observed compressions are treated as mostly isothermal so that energy can transfer into the rain, decelerating it and reducing cooling rates.
What would settle it
Direct temperature measurements during the compressions showing clear non-isothermal behavior, or rebound flows carrying substantially more than 15 percent of the clumps' kinetic energy.
Figures


read the original abstract
Studying coronal rain formation through thermal non-equilibrium (TNE) and thermal instability (TI) provides insights into coronal heating mechanisms. We analysed a quiescent coronal rain event using space-based observations from the High-Resolution Imager in Extreme Ultraviolet (\hrieuv) of Solar Orbiter (SolO), the Atmospheric Imaging Assembly (AIA) of the Solar Dynamics Observatory (SDO), and the Slit-Jaw Imager (SJI) from the Interface Region Imaging Spectrograph (IRIS) from November 1st, 2023. During the coronal rain shower, the coronal loop exhibits substantial EUV variability and structural changes. Rain clumps fell at $72-87$ km s$^{-1}$ with cool EUV absorbing core sizes of $\approx$600 km and densities of $\approx6\times10^{11}$ cm$^{-3}$ preceded by strong compressions. These mostly isothermal compressions suggest energy transfer into the rain, decelerating it and possibly reducing cooling rates -- consistent with accretion braking timescales. The shower carried microflare-level energy ($4.64\times10^{26}$ erg), with clumps producing impacts that reach the lower transition region and are visible across all EUV channels and in SJI 1400 \AA. The impacts generated hot rebound flows ($10^{6.2}-10^{6.3} $K, $85-87$ km s$^{-1}$) that refilled and reheated the loop but carried less than $15\%$ of the clumps' kinetic energy. We detected steady footpoint heating signatures consistent with the TNE-TI scenario, with an estimated amplitude of $10^{-2\pm0.3}$ erg cm$^{-3}$ s$^{-1}$ and heating scale heights of $2-10$~Mm, matching active region values. Coronal rain may thus serve as both a template for accretion braking and a proxy for integrated heating driving TNE-TI cycles.
Editorial analysis
A structured set of objections, weighed in public.
Referee Report
Summary. The manuscript reports high-resolution EUV observations of a quiescent coronal rain shower in a coronal loop on 2023 November 1 using Solar Orbiter HRI_EUV, SDO/AIA, and IRIS SJI. Rain clumps fall at 72-87 km s^{-1} with ~600 km cool cores and densities ~6e11 cm^{-3}, preceded by compressions interpreted as mostly isothermal. Impacts at the transition region produce hot rebound flows (10^{6.2-6.3} K, 85-87 km s^{-1}) that refill the loop. The shower energy is 4.64e26 erg; rebound flows carry <15% of clump kinetic energy. Steady footpoint heating signatures are reported with amplitude 10^{-2±0.3} erg cm^{-3} s^{-1} and scale heights 2-10 Mm, consistent with the TNE-TI scenario.
Significance. If the energy partitioning and heating estimates are robust, the work supplies direct observational constraints on accretion braking during coronal rain impacts and on the integrated heating that sustains TNE-TI cycles, with potential to link rain events quantitatively to coronal heating models.
major comments (2)
- [§4] §4 (Energy estimates): The central claim that rebound flows carry less than 15% of the clumps' kinetic energy depends on converting EUV intensities in the rebound regions to density via emission measure. The manuscript does not report a propagated uncertainty budget that includes temperature response functions of the AIA channels, volume filling factor, or possible line-of-sight overlap with cooler material. A factor-of-two uncertainty in rebound density (plausible for multi-thermal plasma) would move the fraction across the 15% threshold and alter the interpretation that most kinetic energy is dissipated locally rather than returned as bulk motion.
- [§3.2] §3.2 (Compression analysis): The interpretation that the observed compressions are mostly isothermal and transfer energy into the rain (thereby decelerating it and reducing cooling rates) is used to support accretion-braking timescales. This rests on EUV variability and structural changes, but the manuscript lacks a quantitative comparison (e.g., expected intensity ratios or cooling-function modification) that would distinguish isothermal compression from other scenarios such as line-of-sight superposition or non-isothermal effects.
minor comments (2)
- [Figure 5] Figure 5: The time-distance diagram for rebound flows would benefit from explicit annotation of the velocity measurements (85-87 km s^{-1}) and the spatial region used for the temperature estimate (10^{6.2-6.3} K).
- [§5] The heating amplitude and scale-height values are stated to match active-region TNE-TI models, but the exact fitting procedure (which data points are used, whether the values are free parameters or derived) should be clarified in §5 to avoid any appearance of circularity with the TNE-TI interpretation.
Simulated Author's Rebuttal
We thank the referee for their thorough and constructive review. We address each major comment below and indicate revisions made to the manuscript.
read point-by-point responses
-
Referee: [§4] §4 (Energy estimates): The central claim that rebound flows carry less than 15% of the clumps' kinetic energy depends on converting EUV intensities in the rebound regions to density via emission measure. The manuscript does not report a propagated uncertainty budget that includes temperature response functions of the AIA channels, volume filling factor, or possible line-of-sight overlap with cooler material. A factor-of-two uncertainty in rebound density (plausible for multi-thermal plasma) would move the fraction across the 15% threshold and alter the interpretation that most kinetic energy is dissipated locally rather than returned as bulk motion.
Authors: We agree that an explicit uncertainty budget improves the robustness of the energy partitioning result. In the revised manuscript we have added a dedicated paragraph in §4 that propagates uncertainties arising from the AIA temperature response functions (using the standard SSW routines), adopts a conservative volume filling factor range of 0.1–1.0, and quantifies possible line-of-sight overlap with cooler material by cross-checking the multi-channel light curves. Even under a factor-of-two excursion in rebound density the recovered kinetic-energy fraction remains below 18 %. We therefore retain the conclusion that the majority of the clump kinetic energy is dissipated locally, while acknowledging the residual uncertainty in the text. revision: yes
-
Referee: [§3.2] §3.2 (Compression analysis): The interpretation that the observed compressions are mostly isothermal and transfer energy into the rain (thereby decelerating it and reducing cooling rates) is used to support accretion-braking timescales. This rests on EUV variability and structural changes, but the manuscript lacks a quantitative comparison (e.g., expected intensity ratios or cooling-function modification) that would distinguish isothermal compression from other scenarios such as line-of-sight superposition or non-isothermal effects.
Authors: We have expanded §3.2 with a quantitative test that compares the observed intensity ratios across the AIA 171, 193 and 211 Å channels to those predicted by isothermal compression at the measured pre-compression temperature, using CHIANTI v10 and the AIA response functions. We also compute the change in the radiative loss function under the compressed density and temperature and contrast it with expectations for non-isothermal or pure line-of-sight superposition. The data are more consistent with the isothermal-compression scenario, although we now explicitly note that spectroscopic observations would be required to fully exclude line-of-sight effects. revision: yes
Circularity Check
Moderate dependence in heating-rate estimate tied to TNE-TI interpretive framework
specific steps
-
fitted input called prediction
[Abstract (heating signatures paragraph)]
"We detected steady footpoint heating signatures consistent with the TNE-TI scenario, with an estimated amplitude of 10^{-2±0.3} erg cm^{-3} s^{-1} and heating scale heights of 2-10 Mm, matching active region values."
The amplitude and scale-height values are obtained by fitting observed footpoint variability under the TNE-TI framework that is simultaneously used to interpret the rain formation and EUV changes; the 'consistency' statement therefore partly restates the fitting assumptions rather than providing an independent test.
full rationale
Core observables (clump velocities 72-87 km/s, sizes ~600 km, densities ~6e11 cm^-3, rebound flows 85-87 km/s at 10^6.2-6.3 K) are extracted directly from multi-instrument EUV imaging and intensity measurements. The <15% kinetic-energy fraction follows from straightforward conversion of those intensities to emission measure and mass, subject only to standard temperature-response and filling-factor uncertainties. The heating amplitude (10^{-2±0.3} erg cm^{-3} s^{-1}) and scale heights (2-10 Mm) are separately estimated from footpoint signatures and then declared consistent with the TNE-TI scenario invoked to explain the same rain event; this creates a mild interpretive loop but does not render the primary energy-budget or rebound-flow claims tautological.
Axiom & Free-Parameter Ledger
free parameters (2)
- heating amplitude =
10^{-2±0.3} erg cm^{-3} s^{-1}
- heating scale height =
2-10 Mm
axioms (2)
- domain assumption Coronal rain forms via thermal non-equilibrium and thermal instability cycles driven by footpoint heating
- domain assumption EUV absorption and emission can be used to derive clump densities and temperatures under isothermal compression assumptions
Reference graph
Works this paper leans on
-
[1]
Adrover-Gonz \'a lez A., Terradas J., Oliver R., Carbonell M., 2021, @doi [ ] 10.1051/0004-6361/202039677 , https://ui.adsabs.harvard.edu/abs/2021A&A...649A.142A 649, A142
-
[2]
Antiochos S. K., Karpen J. T., DeLuca E. E., Golub L., Hamilton P., 2003, @doi [ ] 10.1086/375003 , https://ui.adsabs.harvard.edu/abs/2003ApJ...590..547A 590, 547
-
[3]
Antolin P., Froment C., 2022, Frontiers in Astronomy and Space Sciences, 9, 820116
work page 2022
-
[4]
Antolin P., Rouppe van der Voort L., 2012, @doi [ ] 10.1088/0004-637X/745/2/152 , https://ui.adsabs.harvard.edu/abs/2012ApJ...745..152A 745, 152
-
[5]
Antolin P., Vissers G., Pereira T. M. D., Rouppe van der Voort L., Scullion E., 2015, @doi [ ] 10.1088/0004-637X/806/1/81 , https://ui.adsabs.harvard.edu/abs/2015ApJ...806...81A 806, 81
-
[6]
Antolin P., Mart \' nez-Sykora J., S ahin S., 2022, @doi [ ] 10.3847/2041-8213/ac51dd , https://ui.adsabs.harvard.edu/abs/2022ApJ...926L..29A 926, L29
-
[7]
Antolin P., et al., 2023, Astronomy & Astrophysics, 676, A112
work page 2023
-
[8]
J., Boerner P., 2011, The Astrophysical Journal, 732, 81
Aschwanden M. J., Boerner P., 2011, The Astrophysical Journal, 732, 81
work page 2011
-
[9]
Auch \`e re F., Bocchialini K., Solomon J., Tison E., 2014, @doi [ ] 10.1051/0004-6361/201322572 , http://adsabs.harvard.edu/abs/2014A
-
[10]
Auch \`e re F., Froment C., Soubri \'e E., Antolin P., Oliver R., Pelouze G., 2018, @doi [ ] 10.3847/1538-4357/aaa5a3 , http://adsabs.harvard.edu/abs/2018ApJ...853..176A 853, 176
-
[11]
Berghmans D., et al., 2021, @doi [ ] 10.1051/0004-6361/202140380 , https://ui.adsabs.harvard.edu/abs/2021A&A...656L...4B 656, L4
-
[12]
Brooks D. H., Warren H. P., Williams D. R., Watanabe T., 2009, @doi [ ] 10.1088/0004-637X/705/2/1522 , https://ui.adsabs.harvard.edu/abs/2009ApJ...705.1522B 705, 1522
-
[13]
Brooks D. H., Warren H. P., Ugarte-Urra I., Winebarger A. R., 2013, The Astrophysical Journal Letters, 772, L19
work page 2013
-
[14]
P., et al., 2022, Astronomy & Astrophysics, 667, A166
Chitta L. P., et al., 2022, Astronomy & Astrophysics, 667, A166
work page 2022
-
[15]
De Groof A., Bastiaensen C., M \"u ller D. A. N., Berghmans D., Poedts S., 2005, @doi [ ] 10.1051/0004-6361:20053129 , http://cdsads.u-strasbg.fr/abs/2005A
-
[16]
De Pontieu B., et al., 2014, @doi [ ] 10.1007/s11207-014-0485-y , http://adsabs.harvard.edu/abs/2014SoPh..289.2733D 289, 2733
-
[17]
Dere K., 1994, Advances in Space Research, 14, 13
work page 1994
-
[18]
Dere K. P., Landi E., Mason H. E., Monsignori Fossi B. C., Young P. R., 1997, @doi [Astronomy and Astrophysics Supplement Series] 10.1051/aas:1997368 , 125, 149
-
[19]
Dere K. P., Del Zanna G., Young P. R., Landi E., 2023, @doi [arXiv e-prints] 10.48550/arXiv.2305.15221
-
[20]
Edlen B., 1945, Monthly Notices of the Royal Astronomical Society, Vol. 105, p. 323, 105, 323
work page 1945
-
[21]
Fang X., Xia C., Keppens R., 2013, @doi [ ] 10.1088/2041-8205/771/2/L29 , http://adsabs.harvard.edu/abs/2013ApJ...771L..29F 771, L29
-
[22]
Fang X., Xia C., Keppens R., Van Doorsselaere T., 2015, @doi [ ] 10.1088/0004-637X/807/2/142 , http://adsabs.harvard.edu/abs/2015ApJ...807..142F 807, 142
-
[23]
Froment C., Auch \`e re F., Bocchialini K., Buchlin E., Guennou C., Solomon J., 2015, @doi [ ] 10.1088/0004-637X/807/2/158 , http://adsabs.harvard.edu/abs/2015ApJ...807..158F 807, 158
-
[24]
Froment C., Auch \`e re F., Miki \'c Z., Aulanier G., Bocchialini K., Buchlin E., Solomon J., Soubri \'e E., 2018, @doi [ ] 10.3847/1538-4357/aaaf1d , http://adsabs.harvard.edu/abs/2018ApJ...855...52F 855, 52
-
[25]
Grotrian W., 1934, Zeitschrift f \"u r Astrophysik, Vol. 8, p. 124, 8, 124
work page 1934
- [26]
-
[27]
Hillier A., Oliver R., Mart \' nez-G \'o mez D., 2025, @doi [ ] 10.1051/0004-6361/202452524 , https://ui.adsabs.harvard.edu/abs/2025A&A...696A.231H 696, A231
-
[28]
Matplotlib: A 2D Graphics Environment
Hunter J. D., 2007, @doi [Comp. Sci. Eng.] 10.1109/MCSE.2007.55 , 9, 90
-
[29]
Ishigami S., Hara H., Oba T., 2024, The Astrophysical Journal, 975, 289
work page 2024
-
[30]
T., Katsukawa Y., Antolin P., Toriumi S., 2020, Solar Physics, 295, 53
Ishikawa R. T., Katsukawa Y., Antolin P., Toriumi S., 2020, Solar Physics, 295, 53
work page 2020
-
[31]
Johnston C. D., Cargill P. J., Antolin P., Hood A. W., De Moortel I., Bradshaw S. J., 2019, @doi [ ] 10.1051/0004-6361/201834742 , https://ui.adsabs.harvard.edu/abs/2019A&A...625A.149J 625, A149
-
[32]
Kawaguchi I., 1970, Publications of the Astronomical Society of Japan, vol. 22, p. 405 (1970)., 22, 405
work page 1970
-
[33]
Klimchuk J. A., 2015, Philosophical Transactions of the Royal Society A: Mathematical, Physical and Engineering Sciences, 373, 20140256
work page 2015
- [34]
-
[35]
A., Luna M., 2019, The Astrophysical Journal, 884, 68
Klimchuk J. A., Luna M., 2019, The Astrophysical Journal, 884, 68
work page 2019
-
[36]
Lemen J. R., et al., 2012, @doi [ ] 10.1007/s11207-011-9776-8 , http://adsabs.harvard.edu/abs/2012SoPh..275...17L 275, 17
-
[37]
Leroy J.-L., 1972, Solar Physics, 25, 413
work page 1972
-
[38]
H., Galsgaard K., 2001, Solar Physics, 198, 289
Mackay D. H., Galsgaard K., 2001, Solar Physics, 198, 289
work page 2001
-
[39]
Mandal S., et al., 2023, @doi [ ] 10.1051/0004-6361/202347343 , https://ui.adsabs.harvard.edu/abs/2023A&A...678L...5M 678, L5
-
[40]
Mart \' nez-G \'o mez D., Oliver R., Khomenko E., Collados M., 2020, @doi [ ] 10.1051/0004-6361/201937078 , https://ui.adsabs.harvard.edu/abs/2020A&A...634A..36M 634, A36
-
[41]
Mulay S. M., Fletcher L., 2021, @doi [ ] 10.1093/mnras/stab367 , https://ui.adsabs.harvard.edu/abs/2021MNRAS.504.2842M 504, 2842
-
[42]
Mulay S. M., Tripathi D., Mason H., Del Zanna G., Archontis V., 2023, @doi [ ] 10.1093/mnras/stac3035 , https://ui.adsabs.harvard.edu/abs/2023MNRAS.518.2287M 518, 2287
-
[43]
M \"u ller D., Hansteen V., Peter H., 2003, Astronomy & Astrophysics, 411, 605
work page 2003
-
[44]
M \"u ller D., et al., 2017, Astronomy & Astrophysics, 606, A10
work page 2017
-
[45]
M \"u ller D., et al., 2020, @doi [ ] 10.1051/0004-6361/202038467 , 642, A1
-
[46]
Oliver R., Soler R., Terradas J., Zaqarashvili T., Khodachenko M., 2014, The Astrophysical Journal, 784, 21
work page 2014
-
[47]
Pesnell W. D., Thompson B. J., Chamberlin P. C., 2012, @doi [ ] 10.1007/s11207-011-9841-3 , http://adsabs.harvard.edu/abs/2012SoPh..275....3P 275, 3
-
[48]
Peter H., et al., 2013, Astronomy & Astrophysics, 556, A104
work page 2013
-
[49]
K., Raes J., Van Doorsselaere T., Magyar N., Jess D., 2018, The Astrophysical Journal, 868, 149
Prasad S. K., Raes J., Van Doorsselaere T., Magyar N., Jess D., 2018, The Astrophysical Journal, 868, 149
work page 2018
-
[50]
Reale F., 2014, Living Reviews in Solar Physics, 11, 4
work page 2014
-
[51]
Reale F., Orlando S., Testa P., Peres G., Landi E., Schrijver C. J., 2013, @doi [Science] 10.1126/science.1235692 , http://adsabs.harvard.edu/abs/2013Sci...341..251R 341, 251
-
[52]
Rochus P., et al., 2020, @doi [ ] 10.1051/0004-6361/201936663 , https://ui.adsabs.harvard.edu/abs/2020A&A...642A...8R 642, A8
-
[53]
Rouillard A., et al., 2017, Planetary and Space Science, 147, 61
work page 2017
-
[54]
A., 2023, The Astrophysical Journal, 950, 171
S ahin S., Antolin P., Froment C., Schad T. A., 2023, The Astrophysical Journal, 950, 171
work page 2023
-
[55]
Serio S., Peres G., Vaiana G. S., Golub L., Rosner R., 1981, @doi [ ] 10.1086/158597 , http://adsabs.harvard.edu/abs/1981ApJ...243..288S 243, 288
-
[56]
The SunPy Community et al., 2020, @doi [The Astrophysical Journal] 10.3847/1538-4357/ab4f7a , 890, 68
-
[57]
Ugarte-Urra I., Winebarger A. R., Warren H. P., 2006, The Astrophysical Journal, 643, 1245
work page 2006
-
[58]
M., 2011, The Astrophysical Journal Letters, 727, L32
Van Doorsselaere T., Wardle N., Del Zanna G., Jansari K., Verwichte E., Nakariakov V. M., 2011, The Astrophysical Journal Letters, 727, L32
work page 2011
-
[59]
Van Doorsselaere T., et al., 2020, Space Science Reviews, 216, 1
work page 2020
-
[60]
Vashalomidze Z. M., Zaqarashvili T. V., Kukhianidze V. D., 2019, @doi [Astrophysics] 10.1007/s10511-019-09565-8 , https://ui.adsabs.harvard.edu/abs/2019Ap.....62...69V 62, 69
-
[61]
Voit G. M., Donahue M., Bryan G. L., McDonald M., 2015, @doi [ ] 10.1038/nature14167 , https://ui.adsabs.harvard.edu/abs/2015Natur.519..203V 519, 203
-
[62]
Waters T., Stricklan A., 2024, @doi [arXiv e-prints] 10.48550/arXiv.2408.15869 , https://ui.adsabs.harvard.edu/abs/2024arXiv240815869W p. arXiv:2408.15869
-
[63]
Williams T., et al., 2020, The Astrophysical Journal, 892, 134
work page 2020
-
[64]
S ahin S., Antolin P., 2022, @doi [ ] 10.3847/2041-8213/ac6fe9 , https://ui.adsabs.harvard.edu/abs/2022ApJ...931L..27S 931, L27
-
[65]
V., Meng X., Jin M., Manchester IV W
van der Holst B., Sokolov I. V., Meng X., Jin M., Manchester IV W. B., Toth G., Gombosi T. I., 2014, The Astrophysical Journal, 782, 81
work page 2014
-
[66]
" write newline "" before.all 'output.state := FUNCTION fin.entry write newline FUNCTION new.block output.state before.all = 'skip after.block 'output.state := if FUNCTION new.sentence output.state after.block = 'skip output.state before.all = 'skip after.sentence 'output.state := if if FUNCTION not #0 #1 if FUNCTION and 'skip pop #0 if FUNCTION or pop #1...
discussion (0)
Sign in with ORCID, Apple, or X to comment. Anyone can read and Pith papers without signing in.