REVIEW 4 major objections 5 minor 27 references
BIM Informed Visual SLAM for Construction Environments
T0 review · 4 major / 5 minor · reviewed 2026-08-04 · deepseek-v4-flash
Pith's one-line read A visual SLAM system for construction monitoring that anchors its reconstructed walls to the as-planned BIM walls in the back-end optimization reduces trajectory drift by 23.71% and improves map RMSE by 7.14% on real construction sites and
desk verdict Useful engineering result on BIM-informed visual SLAM, but the map-accuracy improvement is partly circular and the paper needs cleanup of internal numbers before it can be trusted as-is. read the letter →
The pith
A machine-rendered reading of the paper's core claim, the machinery that carries it, and where it could break.
The reading
What carries the argument
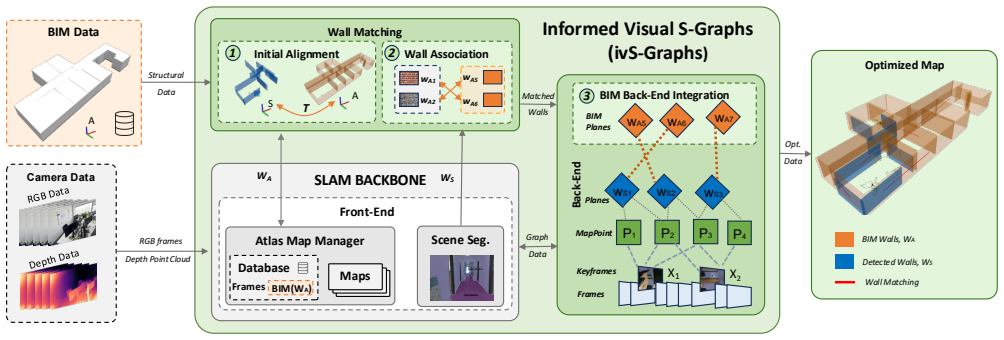
The load-bearing piece is the wall-to-wall factor in the back-end factor graph: for each matched pair (detected wall, BIM wall), the residual is the difference between their plane parameters, weighted by a covariance that is derived from the matching score. Carrying the argument are the matching logic itself—an initialization that finds two nearly perpendicular detected walls to compute the SE(3) alignment to the BIM frame, followed by a continuous association using a normalized weighted score of plane-parameter distance and projected centroid distance—and a robust kernel that downweights spurious associations. What this mechanism does is propagate corrections from fixed BIM walls into the o
What would settle it
Run the system on a site where the two user-specified BIM walls are not the first two nearly perpendicular walls observed (for example, they are occluded by equipment), and measure ATE: if the reported improvement disappears or the trajectory diverges, the initialization prior is the load-bearing assumption. A cleaner version is to deliberately swap the two wall IDs at startup and check whether alignment consistently fails.
Extended reading notes
Core claim
The paper's central claim is that architectural priors do not need to be used only for global localization; they can be injected continuously into the SLAM back-end. After an initial alignment that requires only two user-specified BIM wall IDs, every detected wall is matched to a BIM wall using a combined plane-distance and centroid-distance score, and each match becomes a factor that constrains the detected wall's plane to the fixed BIM wall's plane. The covariance of these factors is derived from the matching confidence, so trustworthy associations pull hard and uncertain ones barely pull. The result is a trajectory and map that stay consistent with the as-planned building model over long
Load-bearing premise
The system starts by assuming that the first two detected walls whose planes are nearly perpendicular are exactly the two BIM walls the user said to expect; if that initial correspondence is wrong, all later wall associations and constraints inherit the mistake.
Editorial extensions
If this is right
- Longer and larger mapping sessions stay accurate: drift that would grow roughly linearly in the baselines is kept roughly flat once enough wall associations exist.
- Construction progress can be monitored online from near the start of a site visit, because the initial alignment triggers after the first two nearly perpendicular walls are observed.
- Partially built environments are usable: with up to 30% of BIM walls absent, trajectory accuracy remains within about 92% of the nominal case.
- The approach preserves real-time operation: average frame rate drops only from about 24.2 to 23.3 FPS, and initial alignment takes about 0.24 ms.
- Small environments gain little—one office sequence shows worse ATE than the baseline—so the benefit is tied to drift-prone, extended trajectories.
Reading between the lines
- The same wall-factor construction could generalize to other stable planar BIM elements—floors, ceilings, columns—which would plausibly extend drift control to smaller environments where few walls are visible.
- A public benchmark that provides both RGB-D streams and aligned BIM models would make the reported percentage gains directly reproducible; the authors note no such dataset exists, so constructing one is a natural testbed.
- A deliberate failure-mode test in which the first two detected walls are chosen wrongly, or are occluded, would quantify how fragile the initialization is; the paper's robustness experiments do not exercise that scenario.
Editorial analysis
A structured set of objections, weighed in public.
Referee Report
Summary. The paper proposes ivS-Graphs, an RGB-D visual SLAM system that augments the vS-Graphs backbone with Building Information Model (BIM) wall priors. Detected walls are associated with BIM walls via an initial alignment step (based on two user-specified BIM wall IDs) and a continuous matching stage; matched pairs are inserted as wall-to-wall factors into the factor-graph back-end, with BIM walls kept fixed. The method is evaluated on 11 real sequences spanning offices and construction sites, reporting lower ATE than vS-Graphs, ORB-SLAM3, and BAD-SLAM in most sequences, as well as lower point-cloud RMSE against the BIM. Robustness experiments simulate partially built environments by adding BIM walls not present physically, and runtime measurements indicate real-time operation.
Significance. If the central claims are correct, this is a useful practical contribution: it is, to the authors' knowledge, the first visual SLAM system to integrate BIM structural priors directly into the back-end, and it operates in real time on real construction sites. The main ablation against vS-Graphs is well designed because it isolates the effect of adding BIM constraints, and the ATE evaluation uses a LiDAR-derived S-Graphs reference, which is independent of the BIM constraints. The construction-site datasets and the explicit focus on early-stage monitoring are also valuable. However, the numerical results contain several internal inconsistencies, and the map-RMSE evaluation is not an independent accuracy measurement, so the headline improvements need verification before the claims can be accepted.
major comments (4)
- [Abstract, §IV-B.1, Table II, Conclusion] The headline ATE improvement is reported inconsistently: the abstract says 25.23%, while the body and conclusion say 23.71%. Recomputing from Table II, the average of the per-sequence Diff column is 25.23%, while the aggregate-mean improvement is 33.8% (mean vS-Graphs 0.254 m vs. mean ivS-Graphs 0.168 m); neither yields 23.71%. In addition, Table IV lists office1-1 nominal ATE as 0.120 m, whereas Table II lists ivS-Graphs ATE for office1-1 as 0.226 m. Please state the exact aggregation formula and correct all affected numbers.
- [§IV-B.2 and §III-D, Eq. (8)] Map RMSE is computed against the BIM point cloud (§IV-B.2), but the back-end explicitly adds wall-to-wall factors to fixed BIM walls (Eq. 8, third term), pulling the reconstructed map toward that same BIM. The reported 7.14% RMSE improvement is therefore largely a measure of constraint satisfaction, not an independent as-built accuracy. This is especially problematic if the as-planned BIM deviates from the as-built site, which the robustness experiment itself simulates. Please evaluate against an independent geometric reference (e.g., LiDAR point cloud) or relabel the metric as 'BIM alignment error' and temper the claim that map accuracy improves.
- [§III-C, Algorithm 1, and §IV-B.3] Initialization assumes the first two detected walls with nearly perpendicular planes correspond exactly to the two user-specified BIM wall IDs. If the IDs are wrong, or the first two detections are occluded/misdetected, the estimated S_hat_T_A is wrong and every subsequent wall association and BIM constraint inherits that error. The robustness experiments only vary wall availability after a correct initialization; they never test incorrect wall IDs or a bad initial alignment. Please quantify sensitivity to this assumption, for example by running the pipeline with deliberately wrong wall IDs or with perturbed initial transformations.
- [Algorithm 1 and Eq. (5)] Several free parameters controlling matching are never given numerical values: tau_perp, tau_init, tau_p, tau_c, and epsilon. Only alpha = 0.7 is specified. Without these values the experiments are not reproducible, and the paper does not justify why the chosen thresholds are not dataset-specific. Please provide the values or a sensitivity analysis for these parameters.
minor comments (5)
- [Table III and Table IV] In Table III, the office2-4 row appears as '-0.386' with missing separation between a dash and the value; fix the formatting. In Table IV, the Similarity column uses comma decimals (e.g., '89,41%') which should be made consistent with the rest of the paper.
- [Table II] The reported mean ATE for BAD-SLAM (2.826 m) does not match the arithmetic mean (3.128 m) of the five non-dash values listed in the table. Please verify.
- [Algorithm 1, line 5] The condition '|n_Si ⊥ n_Sj| < tau_perp' should be written in terms of the absolute value of the dot product: |n_Si · n_Sj| < tau_perp. The perpendicular symbol is not a scalar quantity.
- [§III-C, Eq. (6)] The operator ⊖ is not defined for wall objects. Eq. (3) defines ⊖ for plane parameter vectors, but Eq. (6) applies it to the full wall representation w. Please define the wall-difference operator explicitly.
- [Fig. 3] The caption and in-figure labels contain garbled text (e.g., 'C S S', 'B : BIM Origin'). These should be cleaned up to match the notation used in the rest of the paper.
Circularity Check
Map-RMSE improvement is partly circular: the map is optimized against fixed BIM walls and then evaluated against the same BIM point cloud.
-
fitted input called prediction
[Section III-D (Eq. 6/8) and Section IV-B.2]
"BIM walls W_A are introduced as fixed wall nodes in the graph, while detected walls W_S remain optimizable. Wall-to-wall factors are created from the associations M = {(w_Si, w_Aj)} ... The cost function for the wall-to-wall factor is defined as: c_wall-wall(w_s, w_a) = ||w_Si ⊖ w_Aj||^2_Λ ... We evaluate the quality of the reconstructed maps by computing the Root Mean Square Error (RMSE) between the reconstructed point cloud and the reference BIM point cloud, which serves as ground truth."
The back-end optimization (Eq. 8) directly minimizes the distance between detected walls and fixed BIM walls via c_wall-wall, while the RMSE evaluation measures the distance between the reconstructed point cloud and the same BIM reference. The BIM model is therefore both the optimization target and the evaluation ground truth. Minimizing the wall-to-wall cost by construction tends to reduce RMSE to the BIM point cloud, making the reported 7.14% map-accuracy improvement partly a measure of the strength of the added constraints rather than an independent validation of as-built fidelity. The trajectory ATE claim is not affected, since it is evaluated against a LiDAR-based S-Graphs reference.
full rationale
The paper's primary drift-reduction claim (23.71% ATE improvement) is supported by an independent LiDAR-derived reference and is not circular. However, the map-accuracy claim (7.14% RMSE improvement) is evaluated against the BIM point cloud, which is the same prior that the proposed back-end is forced to satisfy via fixed BIM wall nodes and wall-to-wall factors. This is a partial circularity: the reported map improvement is partly self-fulfilling and does not by itself demonstrate better as-built mapping if the as-planned BIM differs from reality. The robustness experiment still uses ATE, so it does not remove this concern. Self-citations to the authors' own prior systems (vS-Graphs, S-Graphs) are used as baselines/references and do not load-bearingly import unverified claims. Overall, the central trajectory result is independent, but the map-accuracy metric is entangled with the optimization objective, warranting a score of 6.
Assumptions & free parameters
free parameters (3)
- alpha (matching score weight) =
0.7
- tau_p, tau_c (normalization thresholds) =
not specified numerically
- epsilon (covariance scale) =
not specified
assumptions (5)
- domain assumption The BIM provides the true as-planned geometry of walls, including accurate positions and dimensions.
- ad hoc to paper The first two detected walls with nearly perpendicular planes correspond exactly to the two user-specified BIM wall IDs.
- domain assumption The LiDAR+S-Graphs processing yields accurate reference trajectories and maps.
- domain assumption vS-Graphs' scene segmentor reliably extracts wall planes from RGB-D depth data.
- standard math The factor-graph optimizer reliably finds a good minimum for the combined cost function.
Cite this review
Pith. "Pith review of BIM Informed Visual SLAM for Construction Environments." pith.science (2026). https://pith.science/paper/KKPVVLXG
@misc{pith2026250913972,
  author       = {Pith},
  title        = {Pith review of: BIM Informed Visual SLAM for Construction Environments},
  year         = {2026},
  howpublished = {\url{https://pith.science/paper/KKPVVLXG}},
  note         = {Machine review of arXiv:2509.13972}
}
read the original abstract
Monitoring building construction sites requires comparing the as-planned design with the as-built state, which can be estimated in real time using Simultaneous Localization and Mapping (SLAM) techniques. However, visual SLAM is prone to trajectory drift in construction environments, producing maps that are geometrically inaccurate with the actual environment. To address this limitation, we augment an existing RGB-D SLAM system with structural priors derived from the Building Information Model (BIM). The system associates detected walls with their BIM counterparts and includes these correspondences as geometric constraints in the back-end optimization, reducing drift and enhancing global consistency. The proposed method operates in real time and is validated on multiple real construction sites, achieving an average trajectory error reduction of 25.23% and a 7.14% improvement in map accuracy over state-of-the-art baselines. Robustness analyses further demonstrate resilience to incomplete BIM data and geometric discrepancies between as-planned models and the as-built environment.
Figures


Figures from the paper (1 more)

Reference graph
Works this paper leans on
-
[1]
Graph-based global robot localization inform- ing situational graphs with architectural graphs,
M. Shaheer, J. A. Millan-Romera, H. Bavle, J. L. Sanchez-Lopez, J. Civera, and H. V oos, “Graph-based global robot localization inform- ing situational graphs with architectural graphs,” in 2023 IEEE/RSJ International Conference on Intelligent Robots and Systems (IROS), 2023, pp. 9155–9162
2023
-
[2]
Supporting construction and architectural visualization through bim and ar/vr: A systematic liter- ature review,
E. Yigitbas, A. Nowosad, and G. Engels, “Supporting construction and architectural visualization through bim and ar/vr: A systematic liter- ature review,” in IFIP Conference on Human-Computer Interaction. Springer, 2023, pp. 145–166
2023
-
[3]
Past, present, and future of simultaneous localization and mapping: Toward the robust-perception age,
C. Cadena, L. Carlone, H. Carrillo, Y . Latif, D. Scaramuzza, J. Neira, I. Reid, and J. J. Leonard, “Past, present, and future of simultaneous localization and mapping: Toward the robust-perception age,” IEEE Transactions on robotics, vol. 32, no. 6, pp. 1309–1332, 2016
2016
-
[4]
Present and future of slam in extreme environments: The darpa subt challenge,
K. Ebadi, L. Bernreiter, H. Biggie, G. Catt, Y . Chang, A. Chatterjee, C. E. Denniston, S.-P. Deschˆenes, K. Harlow, S. Khattak, L. Nogueira, M. Palieri, P. Petr´aˇcek, M. Petrl´ık, A. Reinke, V . Kr´atk´y, S. Zhao, A.-a. Agha-mohammadi, K. Alexis, C. Heckman, K. Khosoussi, N. Kottege, B. Morrell, M. Hutter, F. Pauling, F. Pomerleau, M. Saska, S. Scherer,...
2024
-
[5]
Nothing stands still: A spatiotemporal benchmark on 3d point cloud registration under large geometric and temporal change,
T. Sun, Y . Hao, S. Huang, S. Savarese, K. Schindler, M. Pollefeys, and I. Armeni, “Nothing stands still: A spatiotemporal benchmark on 3d point cloud registration under large geometric and temporal change,” ISPRS Journal of Photogrammetry and Remote Sensing, vol. 220, pp. 799–823, 2025
2025
-
[6]
Bim-based progress monitoring,
A. Braun, S. Tuttas, U. Stilla, and A. Borrmann, “Bim-based progress monitoring,” in Building Information Modeling: Technology Foundations and Industry Practice. Springer, 2018, pp. 463–476
2018
-
[7]
Bim-slam: Integrating bim models in multi-session slam for lifelong mapping using 3d lidar,
M. A. V . Torres, A. Braun, and A. Borrmann, “Bim-slam: Integrating bim models in multi-session slam for lifelong mapping using 3d lidar,” arXiv preprint arXiv:2408.15870, 2024
arXiv 2024
-
[8]
Pre- cise robot localization in architectural 3d plans,
H. Blum, J. Stiefel, C. Cadena, R. Siegwart, and A. Gawel, “Pre- cise robot localization in architectural 3d plans,” arXiv preprint arXiv:2006.05137, 2020
arXiv 2006
Show all 27 references
-
[10]
Tightly coupled slam with imprecise architectural plans,
M. Shaheer, J. A. Millan-Romera, H. Bavle, M. Giberna, J. L. Sanchez-Lopez, J. Civera, and H. V oos, “Tightly coupled slam with imprecise architectural plans,” IEEE Robotics and Automation Letters, vol. 10, no. 8, pp. 8019–8026, 2025
2025
-
[11]
Constructing Metric-Semantic Maps Using Floor Plan Priors for Long-Term Indoor Localization,
N. Zimmerman, M. Sodano, E. Marks, J. Behley, and C. Stachniss, “Constructing Metric-Semantic Maps Using Floor Plan Priors for Long-Term Indoor Localization,” in International Conference on Intelligent Robots and Systems, Oct. 2023, pp. 1366–1372
2023
-
[12]
Bim-constrained optimization for accurate localization and deviation correction in construction monitoring,
A. Bikandi, M. Shaheer, H. Bavle, J. Jevanesan, H. V oos, and J. L. Sanchez-Lopez, “Bim-constrained optimization for accurate localization and deviation correction in construction monitoring,”
-
[13]
Orb-slam3: An accurate open-source library for visual, visual–inertial, and multimap slam,
C. Campos, R. Elvira, J. J. G. Rodr ´ıguez, J. M. M. Montiel, and J. D. Tard ´os, “Orb-slam3: An accurate open-source library for visual, visual–inertial, and multimap slam,” IEEE Transactions on Robotics, vol. 37, no. 6, pp. 1874–1890, 2021
2021
-
[14]
vs-graphs: Integrating visual slam and situa- tional graphs through multi-level scene understanding,
A. Tourani, S. Ejaz, H. Bavle, D. Morilla-Cabello, J. L. Sanchez- Lopez, and H. V oos, “vs-graphs: Integrating visual slam and situa- tional graphs through multi-level scene understanding,” arXiv preprint arXiv:2503.01783, 2025
2025 arXiv
-
[15]
Bad slam: Bundle adjusted direct rgb-d slam,
T. Sch ¨ops, T. Sattler, and M. Pollefeys, “Bad slam: Bundle adjusted direct rgb-d slam,” in2019 IEEE/CVF Conference on Computer Vision and Pattern Recognition (CVPR), 2019, pp. 134–144
2019
-
[16]
cuvslam: Cuda accelerated visual odometry,
A. Korovko, D. Slepichev, A. Efitorov, A. Dzhumamuratova, V . Kuznetsov, H. Rabeti, and J. Biswas, “cuvslam: Cuda accelerated visual odometry,” arXiv preprint arXiv:2506.04359, 2025
2025 arXiv
-
[17]
Superpoint: Self- supervised interest point detection and description,
D. DeTone, T. Malisiewicz, and A. Rabinovich, “Superpoint: Self- supervised interest point detection and description,” in Proceedings of the IEEE conference on computer vision and pattern recognition workshops, 2018, pp. 224–236
2018
-
[18]
Industry foundation classes (ifc),
V . Thein, “Industry foundation classes (ifc),” BIM interoperability through a vendor-independent file format, p. 152, 2011
2011
-
[19]
Monte carlo local- ization for mobile robots,
F. Dellaert, D. Fox, W. Burgard, and S. Thrun, “Monte carlo local- ization for mobile robots,” in Proceedings 1999 IEEE international conference on robotics and automation (Cat. No. 99CH36288C), vol. 2. IEEE, 1999, pp. 1322–1328
1999
-
[20]
Towards BIM-based robot localization: a real-world case study,
H. Yin, J. Liew, W. Lee, M. Ang Jr, and J. Yeoh, “Towards BIM-based robot localization: a real-world case study,” International Symposium on Automation and Robotics in Construction, 2022
2022
-
[21]
Pixels-to-graph: Real-time integration of building information models and scene graphs for semantic-geometric human- robot understanding,
A. Longo, C. Chung, M. Palieri, S.-K. Kim, A. Agha, C. Guaragnella, and S. Khattak, “Pixels-to-graph: Real-time integration of building information models and scene graphs for semantic-geometric human- robot understanding,” arXiv preprint arXiv:2506.22593, 2025
2025 arXiv
-
[22]
S-graphs 2.0–a hierarchical-semantic optimization and loop closure for slam,
H. Bavle, J. L. Sanchez-Lopez, M. Shaheer, J. Civera, and H. V oos, “S-graphs 2.0–a hierarchical-semantic optimization and loop closure for slam,” arXiv preprint arXiv:2502.18044, 2025
2025
-
[23]
Drift-free visual slam using digital twins,
R. Merat, G. Cioffi, L. Bauersfeld, and D. Scaramuzza, “Drift-free visual slam using digital twins,” IEEE Robotics and Automation Letters, vol. 10, no. 2, pp. 1633–1640, 2025
2025
-
[24]
Robust kernels for robust location estimation,
J. A. Gallego, F. A. Gonz ´alez, and O. Nasraoui, “Robust kernels for robust location estimation,” Neurocomputing, vol. 429, pp. 174–186, 2021. [Online]. Available: https://www.sciencedirect.com/ science/article/pii/S0925231220317033
2021
-
[25]
G2o: A general framework for graph optimization,
R. K ¨ummerle, G. Grisetti, H. Strasdat, K. Konolige, and W. Burgard, “G2o: A general framework for graph optimization,” in 2011 IEEE International Conference on Robotics and Automation, 2011, pp. 3607–3613
2011
-
[26]
Scannet: Richly-annotated 3d reconstructions of indoor scenes,
A. Dai, A. X. Chang, M. Savva, M. Halber, T. Funkhouser, and M. Nießner, “Scannet: Richly-annotated 3d reconstructions of indoor scenes,” in Proceedings of the IEEE conference on computer vision and pattern recognition, 2017, pp. 5828–5839
2017
-
[27]
Smapper: A multi-modal data acquisition platform for slam benchmarking,
P. M. B. Soares, A. Tourani, M. Fernandez-Cortizas, A. B. Noya, J. L. Sanchez-Lopez, and H. V oos, “Smapper: A multi-modal data acquisition platform for slam benchmarking,” 2025. [Online]. Available: https://arxiv.org/abs/2509.09509
2025
-
[2025]
Available: https://arxiv.org/abs/2504.17693
[Online]. Available: https://arxiv.org/abs/2504.17693
Reviewed August 4, 2026 · model on record in the stance chip above.
Discussion (0). Sign in to comment.