The Galaxy Activity, Torus, and Outflow Survey (GATOS): N. Unveiling physical processes in local active galaxies. Unsupervised hierarchical clustering of JWST MIRI/MRS observations
Pith reviewed 2026-05-18 16:18 UTC · model grok-4.3
The pith
An unsupervised hierarchical clustering algorithm applied to JWST mid-infrared spectra separates AGN emission, star-forming regions, and galactic discs in nearby galaxies.
A machine-rendered reading of the paper's core claim, the machinery that carries it, and where it could break.
Core claim
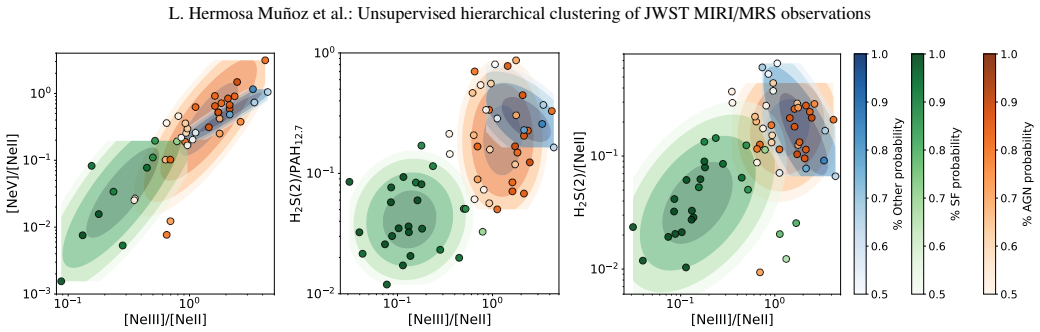
The authors claim that their hierarchical clustering algorithm, based on spectral similarity in the MIRI/MRS channel 3 range, successfully differentiates spaxels into groups corresponding to AGN-dominated, disc, and star-forming regions, as well as composite areas, with confirmation from new mid-infrared diagnostic diagrams using neon lines, hydrogen transitions, and PAH features.
What carries the argument
An unsupervised hierarchical clustering algorithm applied to the spectra of individual spaxels in data cubes, which groups them by similarity to isolate distinct ionisation mechanisms.
If this is right
- The clustering provides an initial characterisation of the main ionisation sources in the central regions of galaxies.
- Empirical diagnostic diagrams created from cluster properties separate physically distinct regions in the mid-infrared.
- The method serves as a preliminary tool to identify regions of interest in any spectral data cube before detailed analysis.
- It enables better understanding of complex systems observed with integral field spectroscopy.
Where Pith is reading between the lines
- Applying this approach to larger samples could reveal statistical trends in how different ionisation sources interact across galaxy types.
- Combining the clusters with kinematic data might help isolate outflow components driven by the AGN.
- Testing the method on simulated data cubes with known ionisation sources would quantify its accuracy in mixed regions.
Load-bearing premise
The assumption that spectral similarity within the selected mid-infrared wavelengths directly reflects distinct physical ionisation mechanisms rather than observational effects or continuum differences.
What would settle it
Observing that the derived clusters fail to align with independent classifications from optical diagnostic diagrams or high-resolution imaging of the same galaxies would falsify the mapping to physical processes.
Figures


read the original abstract
With the rise of the integral field spectroscopy, we are currently dealing with large amounts of spatially resolved data, whose analysis has become challenging, especially when observing complex objects such as nearby galaxies. We aim to develop a method to automatically separate different physical regions within the central parts (1"~160 pc, on average) of galaxies. This can allow us to better understand the systems, and provide an initial characterisation of the main ionisation sources affecting its evolution. We have developed an unsupervised hierarchical clustering algorithm to analyse data cubes based on spectral similarity. It clusters together spaxels with similar spectra, which is useful to disentangle between different physical processes. We have applied this method to a sample of 15 nearby (distances <100 Mpc) galaxies, 7 from the Galaxy Activity, Torus, and Outflow Survey (GATOS) and 8 archival sources, all observed with the medium resolution spectrometer (MRS) of the Mid-Infrared Instrument (MIRI) on board of the JWST. From the clusters, we computed their median spectrum and measured the line and continuum properties. We used these measurements to train random forest models and create several empirical mid-IR diagnostic diagrams for the MRS channel 3 wavelength range, including among others the bright [Ne II], [Ne III], and [Ne V] lines, several H2 transitions, and PAH features. The clustering technique allows to differentiate emission coming from an AGN, the disc, and star forming regions in galaxies, and other composite regions, potentially ionised by several sources simultaneously. This is supported by the results from the empirical diagnostic diagrams, that are indeed able to separate physically distinct regions. This innovative method serves as a tool to identify regions of interest in any data cube prior to an in-depth analysis of the sources. [abridged]
Editorial analysis
A structured set of objections, weighed in public.
Referee Report
Summary. The manuscript presents an unsupervised hierarchical clustering method applied to JWST MIRI/MRS spectral cubes of 15 nearby galaxies (7 from GATOS and 8 archival). Spaxels are grouped by spectral similarity in the channel-3 wavelength range; median spectra per cluster are used to measure lines ([Ne II], [Ne III], [Ne V], H2 transitions) and continuum/PAH properties. These measurements train random-forest models that generate new empirical mid-IR diagnostic diagrams. The central claim is that the resulting clusters correspond to physically distinct regions (AGN, disc, star-forming, and composite) and that the diagrams separate these regions.
Significance. If the mapping from spectral similarity to ionisation mechanism holds, the approach supplies a reproducible, data-driven tool for segmenting large IFS datasets and identifying regions of interest before detailed modeling. The construction of mid-IR diagnostics from [Ne] lines, H2, and PAH features is a useful addition. The work is strengthened by its explicit use of external benchmarks where possible, but its impact is limited by the absence of tests that isolate the clustering from continuum shape or S/N effects.
major comments (2)
- [Methods] Methods section: the number of clusters (or dendrogram cut height) and the choice of distance metric/linkage are free parameters. The manuscript does not state whether these were fixed before inspecting the data or selected to produce physically plausible groups; a sensitivity test or pre-specified criterion is required to support the claim that clusters map to distinct ionisation sources.
- [Results] Results / empirical diagrams: the random-forest diagnostics and the reported separation are derived from line and continuum measurements taken directly from the same cluster median spectra used to define the labels. This introduces the circularity noted in the stress-test note. An explicit check (e.g., re-running the clustering after continuum normalisation or line masking, or cross-comparison with independent optical tracers) is needed to demonstrate that the separation survives removal of continuum information and is not driven by observational artifacts.
minor comments (1)
- [Abstract] Abstract: the exact H2 transitions and PAH features used in the diagrams are not listed; adding the specific wavelengths or band names would improve reproducibility.
Simulated Author's Rebuttal
We thank the referee for their constructive and detailed report. We address each major comment below, indicating the changes we will make to strengthen the manuscript.
read point-by-point responses
-
Referee: [Methods] Methods section: the number of clusters (or dendrogram cut height) and the choice of distance metric/linkage are free parameters. The manuscript does not state whether these were fixed before inspecting the data or selected to produce physically plausible groups; a sensitivity test or pre-specified criterion is required to support the claim that clusters map to distinct ionisation sources.
Authors: We agree that the linkage method and dendrogram cut height are free parameters whose selection must be justified to support the physical interpretation of the clusters. In the submitted version, the cut was chosen after inspecting the dendrogram to yield a small number of clusters with distinct median spectra while ensuring each contained enough spaxels for reliable measurements. We will revise the Methods section to state this criterion explicitly and add a sensitivity analysis that varies both linkage (Ward, complete, average) and cut height over a plausible range, demonstrating that the primary separation into AGN, star-forming, and composite groups remains stable. revision: yes
-
Referee: [Results] Results / empirical diagrams: the random-forest diagnostics and the reported separation are derived from line and continuum measurements taken directly from the same cluster median spectra used to define the labels. This introduces the circularity noted in the stress-test note. An explicit check (e.g., re-running the clustering after continuum normalisation or line masking, or cross-comparison with independent optical tracers) is needed to demonstrate that the separation survives removal of continuum information and is not driven by observational artifacts.
Authors: We acknowledge that deriving both the cluster labels and the diagnostic features from the same median spectra introduces a degree of circularity. Although the clustering uses the full spectral vector while the random forest employs extracted line and PAH measurements, an independent validation is warranted. In the revision we will add a test in which the clustering is repeated on continuum-normalised spectra (and separately with strong emission lines masked) and show that the resulting groups still align with the original physical classifications. For the subset of galaxies with available optical IFS data we will also compare the mid-IR cluster assignments against optical line-ratio diagnostics. revision: yes
Circularity Check
Mild circularity: cluster labels used to train diagnostics that then validate the physical meaning of those clusters
specific steps
-
fitted input called prediction
[Abstract]
"From the clusters, we computed their median spectrum and measured the line and continuum properties. We used these measurements to train random forest models and create several empirical mid-IR diagnostic diagrams... The clustering technique allows to differentiate emission coming from an AGN, the disc, and star forming regions in galaxies... This is supported by the results from the empirical diagnostic diagrams, that are indeed able to separate physically distinct regions."
Line and continuum measurements are taken from the clusters produced by the unsupervised algorithm; random-forest diagrams are then trained on those measurements and cluster labels. The diagrams are invoked to confirm that the clusters map to physically distinct ionisation sources, so the validation step reduces to a re-expression of the clustering output rather than an independent test.
full rationale
The paper performs unsupervised hierarchical clustering on spectral similarity, then extracts line/continuum measurements from the resulting clusters to train random-forest models that produce empirical diagnostic diagrams. These diagrams are subsequently cited as independent support that the clusters correspond to distinct ionisation mechanisms (AGN, disc, SF). Because the diagrams are constructed directly from the same cluster-derived measurements and labels, the claimed physical separation is not shown to survive removal of the clustering information or continuum shape. No external validation (e.g., optical tracers or continuum-normalised tests) is described to break the dependence. This matches the 'fitted_input_called_prediction' pattern at a moderate level; the core clustering step itself remains data-driven and unsupervised.
Axiom & Free-Parameter Ledger
free parameters (2)
- number of clusters or dendrogram cut height
- spectral distance metric and linkage method
axioms (2)
- domain assumption Spectra that are close in feature space arise from the same dominant ionisation mechanism
- domain assumption Median spectrum of each cluster is representative of the physical process
Lean theorems connected to this paper
-
IndisputableMonolith/Foundation/Cost/FunctionalEquation.leanwashburn_uniqueness_aczel unclear?
unclearRelation between the paper passage and the cited Recognition theorem.
We have developed an unsupervised hierarchical clustering algorithm to analyse data cubes based on spectral similarity... From the clusters, we computed their median spectrum and measured the line and continuum properties. We used these measurements to train random forest models and create several empirical mid-IR diagnostic diagrams
-
IndisputableMonolith/Foundation/AlexanderDuality.leanalexander_duality_circle_linking unclear?
unclearRelation between the paper passage and the cited Recognition theorem.
The clustering technique allows to differentiate emission coming from an AGN, the disc, and star forming regions
What do these tags mean?
- matches
- The paper's claim is directly supported by a theorem in the formal canon.
- supports
- The theorem supports part of the paper's argument, but the paper may add assumptions or extra steps.
- extends
- The paper goes beyond the formal theorem; the theorem is a base layer rather than the whole result.
- uses
- The paper appears to rely on the theorem as machinery.
- contradicts
- The paper's claim conflicts with a theorem or certificate in the canon.
- unclear
- Pith found a possible connection, but the passage is too broad, indirect, or ambiguous to say the theorem truly supports the claim.
Reference graph
Works this paper leans on
-
[1]
Centro de Astrobiolog ´ıa (CAB) CSIC-INTA, Camino Bajo del Castillo s/n, 28692 Villanueva de la Ca˜nada, Madrid, Spain 13 L. Hermosa Mu˜noz et al.: Unsupervised hierarchical clustering of JWST MIRI/MRS observations Assign labels to the clusters Median spectrum per cluster Diagnostic diagrams Cluster formation Compute line ratios Data cube normalisation Un...
work page 2053
-
[2]
de la Paz 137, 26006 Logro˜no, La Rioja, Spain
Universidad Internacional de la Rioja (UNIR), Av. de la Paz 137, 26006 Logro˜no, La Rioja, Spain
-
[3]
San Jos´e de la Huerta, Morelia, Michoac´an, 58089, Mexico
Instituto de Radioastrononom ´ıa y Astrof´ısica (IRyA), Universidad Nacional Aut ´onoma de M ´exico, Antigua Carretera a P ´atzcuaro 8701 Ex-Hda. San Jos´e de la Huerta, Morelia, Michoac´an, 58089, Mexico
-
[4]
Instituto de F ´ısica Fundamental, CSIC, Calle Serrano 123, 28006 Madrid, Spain
-
[5]
Kavli Institute for Particle Astrophysics & Cosmology (KIPAC), Stanford University, Stanford, CA 94305, USA
-
[6]
Instituto de Astrof ´ısica de Canarias, C/V ´ıa L´actea s/n, 38205 La Laguna, Tenerife, Spain
-
[7]
Departamento de Astrof ´ısica, Universidad de La Laguna, 38205 La Laguna, Tenerife, Spain
-
[8]
Observatorio Astron ´omico Nacional (OAN-IGN) - Observatorio de Madrid, Alfonso XII, 3, 28014, Madrid, Spain
-
[9]
Department of Physics and Astronomy, The University of Texas at San Antonio, 1 UTSA Circle, San Antonio, Texas, 78249, USA
-
[10]
de CC F´ısicas, Universidad Complutense de Madrid, E-28040 Madrid, Spain
Departmento de F ´ısica de la Tierra y Astrof ´ısica, Fac. de CC F´ısicas, Universidad Complutense de Madrid, E-28040 Madrid, Spain
-
[11]
de CC F ´ısicas, Universidad Complutense de Madrid, E-28040 Madrid, 16 L
Instituto de F ´ısica de Part´ıculas y del Cosmos IPARCOS, Fac. de CC F ´ısicas, Universidad Complutense de Madrid, E-28040 Madrid, 16 L. Hermosa Mu˜noz et al.: Unsupervised hierarchical clustering of JWST MIRI/MRS observations 4 2 0 2 4 RA (arcsec) 4 2 0 2 4 DEC (arcsec) NGC3256N 1 2 3 4 5 4 2 0 2 4 RA (arcsec) 4 2 0 2 4 DEC (arcsec) NGC3256N 1 2 3 4 5 6...
-
[12]
Observatoire de Paris, LUX, PSL University, Sorbonne Universit´e, CNRS, F-75014 Paris, France
-
[13]
Coll `ege de France, 11 Place Marcelin Berthelot, 75231 Paris, France
-
[14]
Institute of Astrophysics, Foundation for Research and Technology - Hellas (FORTH), Heraklion 70013, Greece
-
[15]
School of Sciences, European University Cyprus, Diogenes Street, Engomi 1516, Nicosia, Cyprus
-
[16]
European Space Agency, c/o Space Telescope Science Institute, 3700 San Martin Drive, Baltimore MD 21218, USA
-
[17]
Department of Physics and Astronomy, University of Alaska Anchorage, Anchorage, AK 99508-4664, USA
-
[18]
Department of Physics, University of Alaska, Fairbanks, Alaska 99775-5920, USA
-
[19]
Telespazio UK for the European Space Agency (ESA), ESAC, Camino Bajo del Castillo s/n, 28692 Villanueva de la Ca˜nada, Spain
-
[20]
Space Telescope Science Institute, 3700 San Martin Drive, Baltimore, MD 21218, USA
-
[21]
1142 Sunset Point Rd, Clearwater, Florida 33755, USA
-
[22]
Roraima 1000, 97105-900, Santa Maria, RS, Brazil
Departamento de F ´ısica, CCNE, Universidade Federal de Santa Maria, Av. Roraima 1000, 97105-900, Santa Maria, RS, Brazil
-
[23]
de Ajalvir km 4, Torrej´on de Ard´oz, 28850, Madrid, Spain
Centro de Astrobiolog´ıa (CAB) CSIC-INTA, Ctra. de Ajalvir km 4, Torrej´on de Ard´oz, 28850, Madrid, Spain
-
[24]
Department of Physics, University of Oxford, Keble Road, Oxford, 17 L. Hermosa Mu˜noz et al.: Unsupervised hierarchical clustering of JWST MIRI/MRS observations 6 4 2 0 2 4 6 RA (arcsec) 4 2 0 2 4 DEC (arcsec) NGC5506 1 2 3 4 5 11.50 11.75 12.00 12.25 12.50 12.75 13.00 13.25 Wavelength ( m) 10 3 10 2 Normalised spectrum [NeII] Hn H2 S(2) [ArV] Median spec...
work page 2025
discussion (0)
Sign in with ORCID, Apple, or X to comment. Anyone can read and Pith papers without signing in.