Towards a Certificate of Trust: Task-Aware OOD Detection for Scientific AI
Pith reviewed 2026-05-18 12:08 UTC · model grok-4.3
The pith
A diffusion model estimating joint likelihood of inputs and predictions yields a score that tracks error in scientific regression tasks.
A machine-rendered reading of the paper's core claim, the machinery that carries it, and where it could break.
Core claim
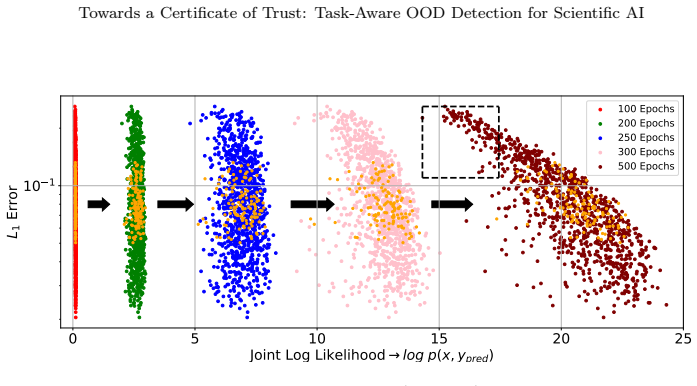
Estimating the joint likelihood of both an input and a regression model's prediction via a score-based diffusion model produces a reliability score that correlates strongly with actual prediction error on out-of-distribution scientific data.
What carries the argument
Score-based diffusion model trained on the joint distribution of inputs and regression predictions to compute a task-aware likelihood score.
If this is right
- Unreliable predictions can be flagged before they are used in downstream scientific decisions.
- The same joint-likelihood approach supplies a concrete numerical certificate for each individual forecast or segmentation.
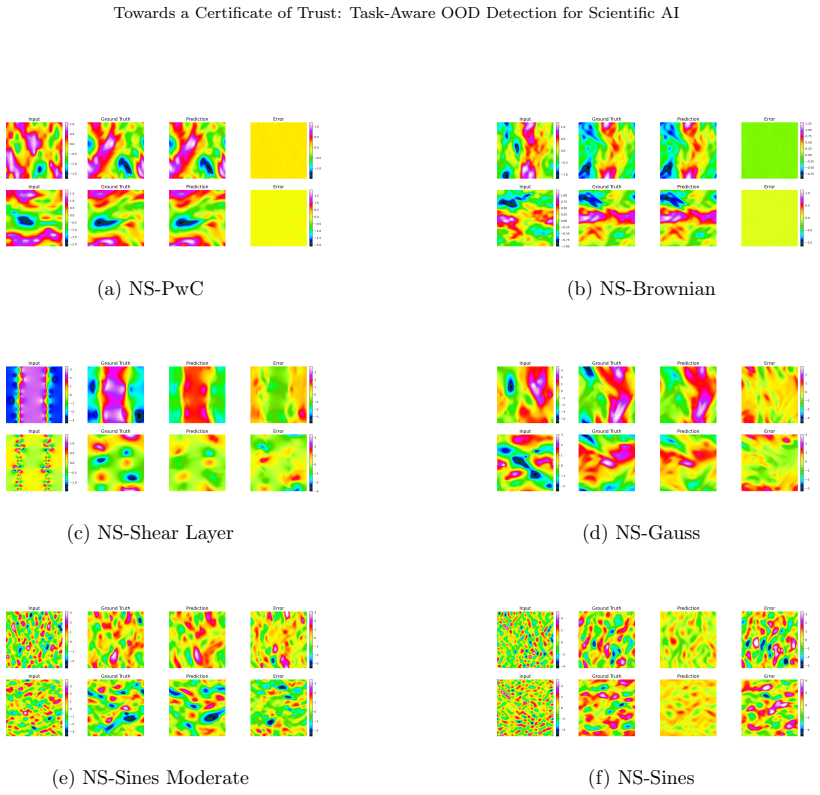
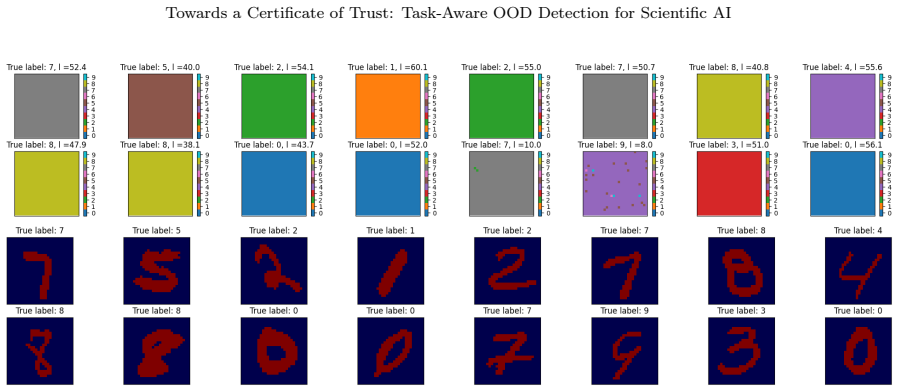
- The method applies uniformly to PDE regression, image-based regression, and segmentation tasks without task-specific redesign.
Where Pith is reading between the lines
- Extending the joint model to classification outputs could yield analogous reliability scores for non-regression scientific tasks.
- Combining the likelihood score with existing ensemble or dropout-based uncertainty estimates may produce tighter error bounds.
- Repeated application across successive model updates could track how trustworthiness changes as training data or architectures evolve.
Load-bearing premise
The diffusion model must faithfully capture the joint distribution of inputs and predictions so that the resulting score generalizes beyond the specific datasets tested.
What would settle it
On a new scientific dataset never seen during training or evaluation, the computed likelihood score shows no consistent correlation with measured prediction error.
Figures


read the original abstract
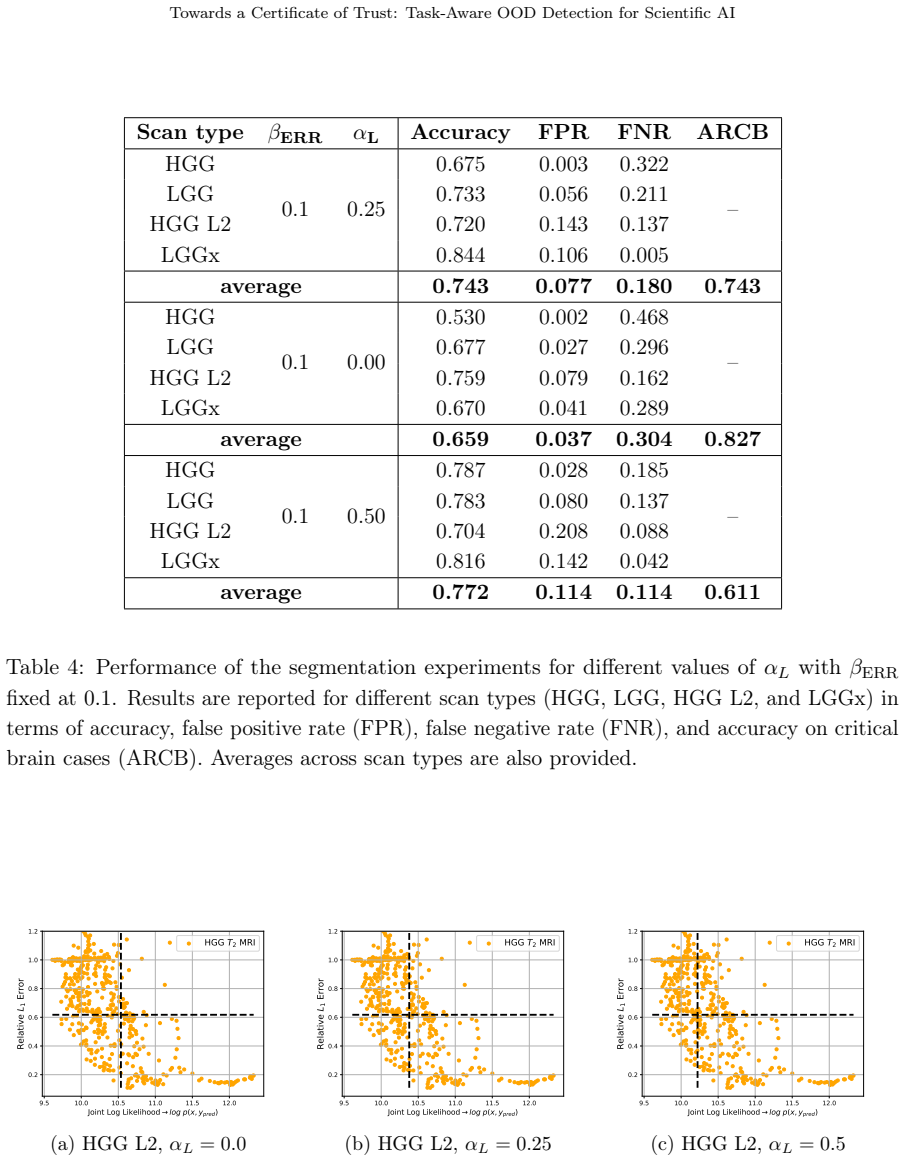
Data-driven models are increasingly adopted in critical scientific fields like weather forecasting and fluid dynamics. These methods can fail on out-of-distribution (OOD) data, but detecting such failures in regression tasks is an open challenge. We propose a new OOD detection method based on estimating joint likelihoods using a score-based diffusion model. This approach considers not just the input but also the regression model's prediction, providing a task-aware reliability score. Across numerous scientific datasets, including PDE datasets, satellite imagery and brain tumor segmentation, we show that this likelihood strongly correlates with prediction error. Our work provides a foundational step towards building a verifiable 'certificate of trust', thereby offering a practical tool for assessing the trustworthiness of AI-based scientific predictions. Our code is publicly available at https://github.com/bogdanraonic3/OOD_Detection_ScientificML
Editorial analysis
A structured set of objections, weighed in public.
Referee Report
Summary. The paper proposes a task-aware OOD detection method for regression tasks in scientific AI by training a score-based diffusion model on the joint distribution of inputs x and model predictions ŷ, then using the estimated joint likelihood p(x, ŷ) as a reliability score. It reports that this score correlates with prediction error across multiple scientific datasets (PDE, satellite imagery, brain tumor segmentation) and positions the approach as a step toward verifiable certificates of trust for AI-based scientific predictions. Code is released publicly.
Significance. If the reported correlations prove robust under statistical controls and the diffusion approximation generalizes without confounding bias, the method could supply a practical, task-aware reliability signal for high-stakes scientific regression. Public code release supports reproducibility and follow-up work.
major comments (2)
- [§4.3, Table 2] §4.3 and Table 2: the central claim that joint likelihood 'strongly correlates with prediction error' is presented without reported p-values, confidence intervals, or controls for multiple-testing across the 'numerous' datasets; the abstract-level summary therefore leaves the statistical support for the correlation unclear.
- [§3.1–3.2] §3.1–3.2: the score-based diffusion model is trained on finite ID samples to recover p(x, ŷ); no analysis quantifies approximation error of the ODE likelihood estimator in the high-dimensional regimes of the PDE grids or segmentation maps, nor tests whether such error systematically aligns with regions of high regressor failure.
minor comments (2)
- [Figure 3] Figure 3 caption: axis labels and color scale for the likelihood–error scatter plots are not defined in the caption or legend, hindering direct interpretation.
- [Related Work] Related-work section: the discussion of prior likelihood-based OOD detectors (e.g., those using normalizing flows or VAEs) omits direct quantitative comparison on the same scientific regression benchmarks.
Simulated Author's Rebuttal
We thank the referee for the constructive feedback on our manuscript. The comments highlight important aspects of statistical rigor and methodological limitations that we have addressed through revisions and additional discussion. We respond to each major comment below.
read point-by-point responses
-
Referee: [§4.3, Table 2] §4.3 and Table 2: the central claim that joint likelihood 'strongly correlates with prediction error' is presented without reported p-values, confidence intervals, or controls for multiple-testing across the 'numerous' datasets; the abstract-level summary therefore leaves the statistical support for the correlation unclear.
Authors: We agree that statistical measures are needed to support the correlation claims. In the revised manuscript, we have updated Table 2 and Section 4.3 to report Pearson correlation coefficients along with p-values for each dataset. We also include 95% bootstrap confidence intervals. To address multiple testing across the datasets, we apply Bonferroni correction and confirm that the key correlations remain statistically significant at the adjusted threshold. The abstract has been revised to note that the correlations are statistically supported rather than simply 'strong'. revision: yes
-
Referee: [§3.1–3.2] §3.1–3.2: the score-based diffusion model is trained on finite ID samples to recover p(x, ŷ); no analysis quantifies approximation error of the ODE likelihood estimator in the high-dimensional regimes of the PDE grids or segmentation maps, nor tests whether such error systematically aligns with regions of high regressor failure.
Authors: We acknowledge this limitation in our original analysis. We have added a dedicated paragraph in Section 3.2 discussing sources of approximation error in the probability flow ODE solver, including numerical integration tolerances and finite-sample effects in high dimensions. We also include a new sensitivity analysis in the appendix examining how likelihood estimates vary with the number of ODE function evaluations on PDE data. However, a comprehensive quantification of how estimator error systematically aligns with regions of high regressor failure would require substantial new theoretical and experimental work beyond the current scope. revision: partial
- Full quantification of the ODE likelihood estimator's approximation error in high-dimensional regimes and explicit testing of whether this error aligns with high regressor failure regions.
Circularity Check
No significant circularity; empirical validation of joint-likelihood OOD score
full rationale
The paper proposes an empirical OOD detection technique that trains a score-based diffusion model on the joint distribution of inputs and model predictions, then reports observed correlation between the resulting likelihood and prediction error across held-out scientific datasets. No derivation chain, uniqueness theorem, or self-citation is invoked to force the central claim; the correlation is presented as an experimental outcome rather than a quantity recovered by construction from fitted parameters or prior self-referential results. The method remains falsifiable on new data distributions and does not reduce the reported reliability score to a renaming or re-fitting of the same quantities used to train the detector.
Axiom & Free-Parameter Ledger
axioms (1)
- domain assumption Score-based diffusion models can be trained to estimate joint likelihoods of inputs and regression predictions for OOD scoring.
Lean theorems connected to this paper
-
IndisputableMonolith/Cost/FunctionalEquation.leanwashburn_uniqueness_aczel unclear?
unclearRelation between the paper passage and the cited Recognition theorem.
We propose a new OOD detection method based on estimating joint likelihoods using a score-based diffusion model... log ℓ(y⋆,Ψφ(x⋆)) ≈ log(ε) − log p(x⋆, ypred)
-
IndisputableMonolith/Foundation/RealityFromDistinction.leanreality_from_one_distinction unclear?
unclearRelation between the paper passage and the cited Recognition theorem.
Our work provides a foundational step towards building a verifiable 'certificate of trust'
What do these tags mean?
- matches
- The paper's claim is directly supported by a theorem in the formal canon.
- supports
- The theorem supports part of the paper's argument, but the paper may add assumptions or extra steps.
- extends
- The paper goes beyond the formal theorem; the theorem is a base layer rather than the whole result.
- uses
- The paper appears to rely on the theorem as machinery.
- contradicts
- The paper's claim conflicts with a theorem or certificate in the canon.
- unclear
- Pith found a possible connection, but the passage is too broad, indirect, or ambiguous to say the theorem truly supports the claim.
Reference graph
Works this paper leans on
- [2]
- [3]
- [4]
- [5]
- [6]
-
[7]
An Image is Worth 16x16 Words: Transformers for Image Recognition at Scale
A. Dosovitskiy, L. Beyer, A. Kolesnikov, D. Weissenborn, X. Zhai, T. Unterthiner, M. De- hghani, M. Minderer, G. Heigold, S. Gelly, et al. An image is worth 16x16 words: Trans- formers for image recognition at scale.arXiv preprint arXiv:2010.11929, 2020
work page internal anchor Pith review Pith/arXiv arXiv 2010
-
[8]
N. Drummond and R. Shearer. The open world assumption. IneSI Workshop: The Closed World of Databases meets the Open World of the Semantic Web, volume 15, page 1, 2006
work page 2006
-
[9]
I. Elsharkawy and Y. Kahn. Contrastive Normalizing Flows for Uncertainty-Aware Param- eter Estimation.arXiv preprint arXiv:2505.08709, 2025
-
[10]
L. C. Evans.Partial differential equations, volume 19. American Mathematical Society, 2022
work page 2022
-
[11]
C. Fanelli, J. Giroux, and Z. Papandreou. ‘flux+ mutability’: a conditional generative approach to one-class classification and anomaly detection.Machine Learning: Science and Technology, 3(4):045012, 2022
work page 2022
-
[12]
Global Modeling and Assimilation Office (GMAO). MERRA-2 tavg1_2d_flx_Nx (M2T1NXFLX): 2D, 1-Hourly, Time-Averaged, Single-Level, Assimilation, Surface Flux Diagnostics, Version 5.12.4. Goddard Earth Sciences Data and Information Services Center 60 Towards a Certificate of Trust: Task-Aware OOD Detection for Scientific AI (GES DISC), Greenbelt, MD, USA, 201...
work page 2015
-
[13]
J. Goodier and N. D. Campbell. Likelihood-based out-of-distribution detection with denoising diffusion probabilistic models.arXiv preprint arXiv:2310.17432, 2023
-
[14]
M. S. Graham, W. H. Pinaya, P.-D. Tudosiu, P. Nachev, S. Ourselin, and J. Cardoso. De- noising diffusion models for out-of-distribution detection. InProceedings of the IEEE/CVF Conference on Computer Vision and Pattern Recognition, pages 2948–2957, 2023
work page 2023
-
[15]
A Baseline for Detecting Misclassified and Out-of-Distribution Examples in Neural Networks
D. Hendrycks and K. Gimpel. A baseline for detecting misclassified and out-of-distribution examples in neural networks.arXiv preprint arXiv:1610.02136, 2016
work page internal anchor Pith review Pith/arXiv arXiv 2016
-
[18]
A. Heng, H. Soh, et al. Out-of-distribution detection with a single unconditional diffusion model.Advances in Neural Information Processing Systems, 37:43952–43974, 2024
work page 2024
- [19]
-
[20]
Y.-C. Hsu, Y. Shen, H. Jin, and Z. Kira. Generalized odin: Detecting out-of-distribution image without learning from out-of-distribution data. InProceedings of the IEEE/CVF conference on computer vision and pattern recognition, pages 10951–10960, 2020
work page 2020
- [21]
-
[22]
H. Kamkari, B. L. Ross, J. C. Cresswell, A. L. Caterini, R. Krishnan, and G. Loaiza- Ganem. A geometric explanation of the likelihood OOD detection paradox. InForty-first International Conference on Machine Learning, 2024
work page 2024
- [23]
-
[24]
K. Lee, K. Lee, H. Lee, and J. Shin. A simple unified framework for detecting out-of- distribution samples and adversarial attacks. In S. Bengio, H. Wallach, H. Larochelle, K. Grauman, N. Cesa-Bianchi, and R. Garnett, editors,Advances in Neural Information Processing Systems, volume 31. Curran Associates, Inc., 2018
work page 2018
-
[25]
S. Lee, J. Jo, and S. J. Hwang. Exploring chemical space with score-based out-of-distribution generation. InInternational Conference on Machine Learning, pages 18872–18892. PMLR, 2023. 61 Towards a Certificate of Trust: Task-Aware OOD Detection for Scientific AI
work page 2023
-
[26]
Z. Li, N. B. Kovachki, K. Azizzadenesheli, B. Liu, K. Bhattacharya, A. Stuart, and A. Anandkumar. Fourier neural operator for parametric partial differential equations. In International Conference on Learning Representations, 2021
work page 2021
-
[27]
W. Liu, X. Wang, J. Owens, and Y. Li. Energy-based out-of-distribution detection.Advances in neural information processing systems, 33:21464–21475, 2020
work page 2020
-
[28]
L. Lu, P. Jin, G. Pang, Z. Zhang, and G. E. Karniadakis. Learning nonlinear operators via DeepONet based on the universal approximation theorem of operators.Nature Machine Intelligence, 3(3):218–229, 2021
work page 2021
-
[29]
A. Mahmood, J. Oliva, and M. Styner. Multiscale score matching for out-of-distribution detection.arXiv preprint arXiv:2010.13132, 2020
-
[30]
B. H. Menze, A. Jakab, S. Bauer, J. Kalpathy-Cramer, K. Farahani, J. Kirby, Y. Burren, N. Porz, J. Slotboom, R. Wiest, et al. The multimodal brain tumor image segmentation benchmark (brats).IEEE transactions on medical imaging, 34(10):1993–2024, 2014
work page 1993
-
[31]
S. Mishra and A. E. Townsend.Numerical Analysis meets Machine Learning. Handbook of Numerical Analysis. Springer, 2024
work page 2024
-
[32]
R. Molinaro, S. Lanthaler, B. Raonić, T. Rohner, V. Armegioiu, S. Simonis, D. Grund, Y. Ramic, Z. Y. Wan, F. Sha, S. Mishra, and L. Zepeda-Núñez. Generative ai for fast and accurate statistical computation of fluids, 2025
work page 2025
-
[33]
E. Nalisnick and et al. Why Normalizing Flows Fail to Detect Out-of-Distribution Data. InNeurIPS, 2020
work page 2020
-
[34]
E. Nalisnick, A. Matsukawa, Y. W. Teh, D. Gorur, and B. Lakshminarayanan. Do deep generative models know what they don’t know? InInternational Conference on Learning Representations, 2019
work page 2019
-
[35]
E. Nalisnick, A. Matsukawa, Y. W. Teh, D. Gorur, and B. Lakshminarayanan. Hybrid models with deep and invertible features. InInternational Conference on Machine Learning, pages 4723–4732. PMLR, 2019
work page 2019
-
[36]
E. Nalisnick, A. Matsukawa, Y. W. Teh, and B. Lakshminarayanan. Detecting out-of- distribution inputs to deep generative models using typicality, 2019
work page 2019
- [37]
- [38]
-
[39]
A. Quarteroni and A. Valli.Numerical approximation of Partial differential equations, volume 23. Springer, 1994. 62 Towards a Certificate of Trust: Task-Aware OOD Detection for Scientific AI
work page 1994
-
[40]
B. Raonic, R. Molinaro, T. De Ryck, T. Rohner, F. Bartolucci, R. Alaifari, S. Mishra, and E. de Bézenac. Convolutional neural operators for robust and accurate learning of pdes. In A. Oh, T. Naumann, A. Globerson, K. Saenko, M. Hardt, and S. Levine, editors, Advances in Neural Information Processing Systems, volume 36, pages 77187–77200. Curran Associates...
work page 2023
-
[41]
J. Ren, P. J. Liu, E. Fertig, J. Snoek, R. Poplin, M. Depristo, J. Dillon, and B. Lak- shminarayanan. Likelihood ratios for out-of-distribution detection.Advances in neural information processing systems, 32, 2019
work page 2019
-
[42]
O. Ronneberger, P. Fischer, and T. Brox. U-net: Convolutional networks for biomedical image segmentation. InInternational Conference on Medical image computing and computer- assisted intervention, pages 234–241. Springer, 2015
work page 2015
-
[43]
W. Tang and H. Zhao. Score-based diffusion models via stochastic differential equations – a technical tutorial, 2024
work page 2024
-
[44]
J. Yang, K. Zhou, Y. Li, and Z. Liu. Generalized out-of-distribution detection: A survey. International Journal of Computer Vision, 132(12):5635–5662, Dec 2024
work page 2024
- [45]
discussion (0)
Sign in with ORCID, Apple, or X to comment. Anyone can read and Pith papers without signing in.