The Colors of Ices: Measuring ice column density through photometry
Pith reviewed 2026-05-18 11:00 UTC · model grok-4.3
The pith
JWST photometry alone can quantify interstellar ices in the Galactic Center, showing over 25 percent of carbon frozen as CO and implying at least 2.5 times solar metallicity.
A machine-rendered reading of the paper's core claim, the machinery that carries it, and where it could break.
Core claim
The central claim is that photometric measurements in JWST filters capture ice absorption features, enabling quantification of CO, H2O, and CO2 column densities in Galactic Center clouds. These abundances imply that more than 25 percent of the total carbon is frozen into CO ice, surpassing the entire solar-neighborhood carbon budget, and assuming identical freezeout fractions between center and disk clouds produces a metallicity estimate of at least 2.5 solar.
What carries the argument
The icemodels tool, which produces synthetic photometry of ices based on laboratory measurements to predict and fit absorption in JWST broadband filters.
If this is right
- Ice ratios differ between Galactic disk and Center, with GC clouds showing a higher H2O fraction.
- A large ice abundance in CO, H2O, and possibly complex molecules implies substantial freezeout and potential for ice-phase chemistry in non-star-forming gas.
- Accounting for all likely ices shows that more than 25 percent of the total carbon is frozen into CO ice in the GC, exceeding the solar-neighborhood carbon budget.
- Assuming the same freezeout fraction as in disk clouds yields a metallicity measurement of Z_GC at least 2.5 times solar.
Where Pith is reading between the lines
- The photometric technique could be scaled to map ice and metallicity variations across many more lines of sight in the Milky Way using existing JWST survey data.
- High ice abundances in cold non-star-forming gas may require revisions to models of molecular cloud chemistry and the efficiency of star formation.
- If freezeout fractions vary with local conditions, the metallicity estimate would need adjustment, but the core photometric detection method would remain valid.
Load-bearing premise
The assumption that the ice freezeout fraction is identical between Galactic Center and Galactic disk clouds.
What would settle it
Spectroscopic measurements of the total carbon abundance or gas-phase metallicity in the same Galactic Center clouds that fall below 2.5 solar would falsify the metallicity inference.
Figures


read the original abstract
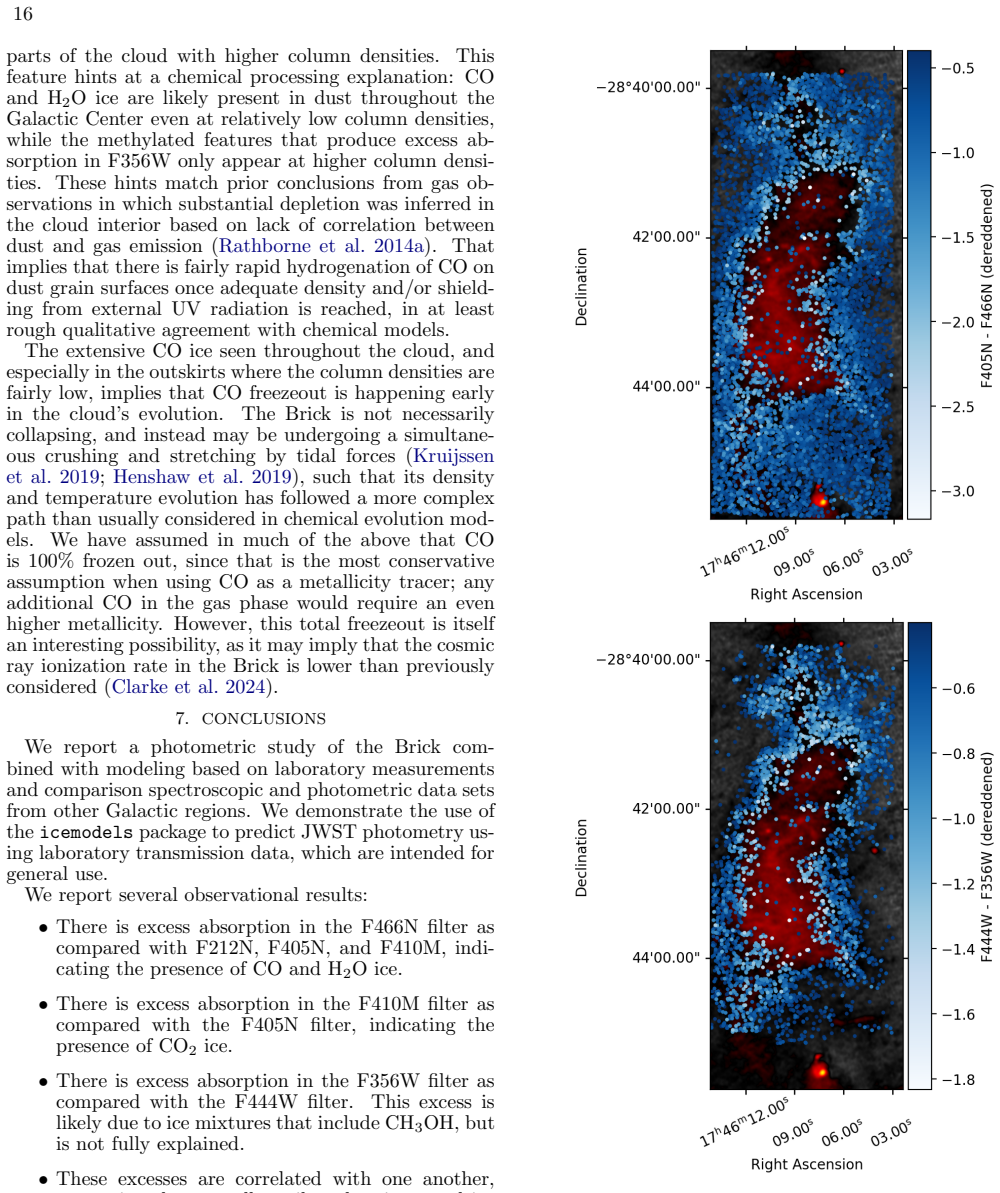
Ices imprint strong absorption features in the near- and mid-infrared, but until recently they have been studied almost exclusively with spectroscopy toward small samples of bright sources. We show that JWST photometry alone can reveal and quantify interstellar ices, and we present a new open-source modeling tool, icemodels, to produce synthetic photometry of ices based on laboratory measurements. We provide reference tables indicating which filters are likely to be observably affected by ice absorption. Applying these models to NIRCam data of background stars behind \refereeseveral Galactic Center (GC) clouds \referee(dust ridge clouds A [the Brick], C, and D), and validating against NIRSpec spectra of Galactic disk sources, we find clear signatures of CO, H$_2$O, and CO$_2$ ices and evidence for excess absorption in the F356W filter likely caused by CH-bearing species such as methanol. The ice ratios differ between the Galactic disk and Center, with GC clouds showing a higher H$_2$O fraction. \refereeA large ice abundance \refereeis observed in CO, H2O, and possibly complex molecules, \refereewhich implies that there is substantial freezeout and therefore potential for ice-phase chemistry in non-star-forming gas. Accounting for all likely ices, we infer that $>25%$ of the total carbon is frozen into CO ice in the GC, which exceeds the entire solar-neighborhood carbon budget. By assuming the freezeout fraction is the same in GC and disk clouds, we obtain a metallicity measurement indicating that $Z_GC\gtrsim2.5Z_\odot$. These results demonstrate that photometric ice measurements are feasible with JWST and capable of probing the metallicity structure of the cold interstellar medium.
Editorial analysis
A structured set of objections, weighed in public.
Referee Report
Summary. The paper demonstrates that JWST NIRCam photometry can be used to detect and quantify interstellar ice column densities (primarily CO, H2O, CO2, and CH-bearing species) by forward-modeling laboratory absorption spectra with the new open-source icemodels package. It validates the approach against NIRSpec spectra of Galactic disk sources, applies the method to background stars behind several Galactic Center dust ridge clouds (A/the Brick, C, D), reports clear filter-specific absorption signatures and differing ice ratios (higher H2O fraction in the GC), infers that >25% of carbon is locked in CO ice (exceeding the solar-neighborhood budget), and derives Z_GC ≳ 2.5 Z_⊙ by assuming the CO freezeout fraction equals the disk value.
Significance. If the photometric technique and its validation hold, the work provides a practical, scalable complement to spectroscopy for mapping ices across wide fields with existing JWST data, which is a clear methodological advance. The open-source icemodels tool, reference tables for affected filters, and evidence for substantial freezeout in non-star-forming GC gas are concrete strengths. The quantitative carbon-budget and metallicity conclusions, however, rest on an untested modeling assumption whose relaxation would materially change the headline numbers.
major comments (2)
- [§5] §5 (metallicity and carbon-budget discussion): The Z_GC ≳2.5 Z_⊙ result is obtained only after scaling the photometrically fitted N(CO ice) by a freezeout fraction taken to be identical to the Galactic-disk value. The manuscript itself reports differing ice ratios (elevated H2O fraction in GC clouds), indicating distinct physical or chemical conditions that could plausibly alter CO depletion efficiency. No gas-phase CO data, chemical models, or sensitivity tests are used to justify or bound the equality assumption, so the factor-of-2.5 metallicity boost is not independently supported.
- [Results section] Results section (ice-column fits and carbon accounting): The claim that >25% of total carbon is frozen into CO ice (exceeding the entire solar-neighborhood carbon budget) compares the fitted N(CO) to a total carbon reservoir derived from measured N(H) and a solar C/H ratio. Because the subsequent metallicity inference assumes a higher total C reservoir, the two statements are interdependent; the manuscript should explicitly show the arithmetic, propagate uncertainties from the free ice-column parameters, and test how the >25% figure changes if the freezeout fraction is allowed to differ.
minor comments (3)
- [Abstract] Abstract: the phrasing 'several Galactic Center (GC) clouds (dust ridge clouds A [the Brick], C, and D)' is slightly ambiguous about the exact number of sightlines or background stars analyzed; a parenthetical count would improve clarity.
- [Methods] Methods: while the open-source status of icemodels is a strength, the main text should include a direct GitHub/DOI link or citation to the code repository rather than leaving it only in a footnote or data-availability statement.
- [Figures and tables] Figure captions and tables: ensure every filter listed in the reference tables is cross-referenced to the corresponding synthetic photometry panel so readers can immediately see which ice species drive the absorption in each band.
Simulated Author's Rebuttal
We thank the referee for their constructive and detailed review. The concerns regarding the assumptions underlying the metallicity inference and the carbon-budget accounting are valid and have prompted us to strengthen the presentation of these results. We have revised the manuscript to include explicit arithmetic derivations, propagated uncertainties, and sensitivity tests on the freezeout-fraction assumption. Our point-by-point responses follow.
read point-by-point responses
-
Referee: §5 (metallicity and carbon-budget discussion): The Z_GC ≳2.5 Z_⊙ result is obtained only after scaling the photometrically fitted N(CO ice) by a freezeout fraction taken to be identical to the Galactic-disk value. The manuscript itself reports differing ice ratios (elevated H2O fraction in GC clouds), indicating distinct physical or chemical conditions that could plausibly alter CO depletion efficiency. No gas-phase CO data, chemical models, or sensitivity tests are used to justify or bound the equality assumption, so the factor-of-2.5 metallicity boost is not independently supported.
Authors: We agree that the differing ice ratios indicate distinct conditions and that the equality of CO freezeout fractions is an assumption rather than a directly tested result. The CO freezeout fraction depends primarily on local density and temperature in the dense gas we probe, which are expected to be comparable to disk clouds at similar extinctions. To address the referee's concern, the revised manuscript now includes sensitivity tests that vary the assumed freezeout fraction by factors of 0.5–2 relative to the disk value and report the resulting range in Z_GC. We also clarify that the >25% carbon-in-CO-ice statement is a direct lower limit independent of the metallicity scaling. While gas-phase CO data and full chemical models are beyond the scope of the current photometric study, the added tests bound the impact of relaxing the assumption. revision: yes
-
Referee: Results section (ice-column fits and carbon accounting): The claim that >25% of total carbon is frozen into CO ice (exceeding the entire solar-neighborhood carbon budget) compares the fitted N(CO) to a total carbon reservoir derived from measured N(H) and a solar C/H ratio. Because the subsequent metallicity inference assumes a higher total C reservoir, the two statements are interdependent; the manuscript should explicitly show the arithmetic, propagate uncertainties from the free ice-column parameters, and test how the >25% figure changes if the freezeout fraction is allowed to differ.
Authors: We concur that the carbon accounting requires clearer exposition and that the interdependence with the metallicity result should be quantified. The revised Results section now contains an explicit step-by-step derivation: the fraction of carbon in CO ice is computed as N(CO ice) / [N(H) × (C/H)_solar], with uncertainties propagated from the posterior distributions of the fitted ice columns (including covariances with N(H2O) and N(CO2)). We further test the robustness of the >25% figure by allowing the freezeout fraction to differ from the disk value; even under a factor-of-two lower freezeout, the carbon locked in CO ice remains ≳20% of the solar-neighborhood budget. These additions make the arithmetic transparent and demonstrate that the headline carbon-budget result is not solely dependent on the metallicity scaling. revision: yes
Circularity Check
No significant circularity in the derivation chain
full rationale
The paper fits ice column densities as adjustable parameters to match JWST photometry via laboratory-based synthetic models in the new icemodels tool. The >25% carbon-in-CO-ice fraction is computed directly from these fitted columns relative to an external total carbon budget. The Z_GC ≳2.5 Z_⊙ result is obtained only after an explicitly stated assumption that the CO freezeout fraction equals the disk value; this assumption is not derived from the photometry, not obtained by self-citation, and not equivalent to any fitted input by construction. No equations reduce outputs to inputs tautologically, and the chain relies on independent photometric data plus external lab spectra.
Axiom & Free-Parameter Ledger
free parameters (2)
- ice column densities for CO, H2O, CO2, and CH-bearing species
- freezeout fraction
axioms (1)
- domain assumption Laboratory transmission spectra of ices accurately predict the absorption features observed in interstellar environments.
Reference graph
Works this paper leans on
-
[1]
doi:10.1088/0004-637X/736/2/133. D. An, K. Sellgren, A. C. A. Boogert, S. V. Ram´ ırez, and T.-S. Pyo. Abundant Methanol Ice toward a Massive Young Stellar Object in the Central Molecular Zone.ApJ, 843(2):L36, July
-
[2]
doi:10.3847/2041-8213/aa7cfe. K. Z. Arellano-C´ ordova, C. Esteban, J. Garc´ ıa-Rojas, and J. E. M´ endez-Delgado. The Galactic radial abundance gradients of C, N, O, Ne, S, Cl, and Ar from deep spectra of H II regions. MNRAS, 496(2):1051–1076, Aug. 2020. doi:10.1093/mnras/staa1523. M. L. N. Ashby, J. L. Hora, K. Lakshmipathaiah, S. Vig, R. K. Sai Subrahm...
-
[3]
doi:10.1146/annurev.astro.45.071206.100404. M. P. Bernstein, D. P. Cruikshank, and S. A. Sandford. Near-infrared laboratory spectra of solid H 2O/CO 2 and CH 3OH/CO 2 ice mixtures.Icarus, 179(2):527–534, Dec. 2005. doi:10.1016/j.icarus.2005.07.009. 18 J. J. Bock, A. M. Aboobaker, J. Adamo, R. Akeson, J. M. Alred, F. Alibay, M. L. N. Ashby, Y. P. Bach, L. ...
-
[4]
doi:10.1088/0004-637X/690/1/496. J. E. Chiar and A. G. G. M. Tielens. Pixie Dust: The Silicate Features in the Diffuse Interstellar Medium.ApJ, 637(2): 774–785, Feb. 2006. doi:10.1086/498406. J. E. Chiar, A. J. Adamson, Y. J. Pendleton, D. C. B. Whittet, D. A. Caldwell, and E. L. Gibb. Hydrocarbons, Ices, and “XCN” in the Line of Sight toward the Galactic...
-
[5]
doi:10.1088/0004-637X/809/2/143. P. Ehrenfreund, A. C. A. Boogert, P. A. Gerakines, D. J. Jansen, W. A. Schutte, A. G. G. M. Tielens, and E. F. van Dishoeck. A laboratory database of solid CO and CO 2 for ISO.A&A, 315:L341–L344, Nov. 1996a. P. Ehrenfreund, P. A. Gerakines, W. A. Schutte, M. C. van Hemert, and E. F. van Dishoeck. Infrared properties of iso...
-
[6]
doi:10.1038/s42004-024-01117-2. S. A. Federman, S. T. Megeath, A. E. Rubinstein, R. Gutermuth, M. Narang, H. Tyagi, P. Manoj, G. Anglada, P. Atnagulov, H. Beuther, T. L. Bourke, N. Brunken, A. Caratti o Garatti, N. J. Evans, W. J. Fischer, E. Furlan, J. D. Green, N. Habel, L. Hartmann, N. Karnath, P. Klaassen, H. Linz, L. W. Looney, M. Osorio, J. Muzeroll...
-
[7]
doi:10.1086/307611. P. A. Gerakines, C. K. Materese, and R. L. Hudson. Carbon monoxide ices - a semicentennial review and update for crystalline CO along with the first IR spectrum and band strength for amorphous CO.MNRAS, 522(2):3145–3162, June
-
[8]
doi:10.1093/mnras/stad1164. E. L. Gibb, D. C. B. Whittet, A. C. A. Boogert, and A. G. G. M. Tielens. Interstellar Ice: The Infrared Space Observatory Legacy.ApJS, 151(1):35–73, Mar. 2004. doi:10.1086/381182. 19 A. Ginsburg, B. M. Sip˝ ocz, C. E. Brasseur, P. S. Cowperthwaite, M. W. Craig, C. Deil, J. Guillochon, G. Guzman, S. Liedtke, P. Lian Lim, K. E. L...
-
[9]
doi:10.1007/978-3-642-18418-5˙17. K. D. Gordon, K. A. Misselt, J. Bouwman, G. C. Clayton, M. Decleir, D. C. Hines, Y. Pendleton, G. Rieke, J. D. T. Smith, and D. C. B. Whittet. Milky Way Mid-Infrared Spitzer Spectroscopic Extinction Curves: Continuum and Silicate Features.ApJ, 916(1):33, July 2021. doi:10.3847/1538-4357/ac00b7. K. D. Gordon, G. C. Clayton...
-
[10]
doi:10.1038/s41586-020-2649-2. J. D. Henshaw, A. Ginsburg, T. J. Haworth, S. N. Longmore, J. M. D. Kruijssen, E. A. C. Mills, V. Sokolov, D. L. Walker, A. T. Barnes, Y. Contreras, J. Bally, C. Battersby, H. Beuther, N. Butterfield, J. E. Dale, T. Henning, J. M. Jackson, J. Kauffmann, T. Pillai, S. Ragan, M. Riener, and Q. Zhang. ‘The Brick’ is not a brick...
-
[11]
doi:10.1007/BF00057607. G. Nandakumar, N. Ryde, M. Schultheis, B. Thorsbro, H. J¨ onsson, P. S. Barklem, R. M. Rich, and F. Fragkoudi. Chemical characterization of the inner Galactic bulge:North-South symmetry.MNRAS, 478(4):4374–4389, Aug. 2018. doi:10.1093/mnras/sty1255. M. F. Nieva and N. Przybilla. Present-day cosmic abundances. A comprehensive study o...
-
[12]
doi:10.3847/1538-4357/ad072d. J. Rigby, M. Perrin, M. McElwain, R. Kimble, S. Friedman, M. Lallo, R. Doyon, L. Feinberg, P. Ferruit, A. Glasse, M. Rieke, G. Rieke, G. Wright, C. Willott, et al. The Science Performance of JWST as Characterized in Commissioning. PASP, 135(1046):048001, Apr. 2023. doi:10.1088/1538-3873/acb293. T. P. Robitaille. A modular set...
-
[13]
doi:10.1051/0004-6361/201425486. W. Rocha and S. Pilling. Determination of optical constants n and k of thin films from absorbance data using kramers-kronig relationship.Spectrochimica Acta Part A: Molecular and Biomolecular Spectroscopy, 123:436–446, 2014. ISSN 1386-1425. doi:https://doi.org/10.1016/j.saa.2013.12.075. URLhttps://www.sciencedirect.com/sci...
discussion (0)
Sign in with ORCID, Apple, or X to comment. Anyone can read and Pith papers without signing in.