Decomposition-Based Modular Conformal Prediction for Two-Stage Modeling
Pith reviewed 2026-05-25 08:21 UTC · model grok-4.3
The pith
Decomposing prediction residuals into stage-specific parts lets conformal prediction maintain coverage in two-stage models while revealing which stage drives uncertainty.
A machine-rendered reading of the paper's core claim, the machinery that carries it, and where it could break.
Core claim
The authors introduce a modular conformal prediction framework in which the overall residual is expressed as a sum or scaled combination of stage-specific residuals. Stage-wise scaling parameters are then chosen through a risk-controlled procedure that controls the family-wise error rate. The resulting prediction sets retain finite-sample coverage under the stated decomposition while identifying the contribution of each stage to total uncertainty. Experiments on synthetic shifts and real supply-chain and stock-market data show improved coverage relative to non-modular conformal baselines under stage-wise changes.
What carries the argument
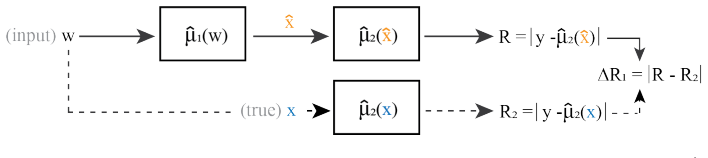
Decomposition of the overall prediction residual into stage-specific components that can be scaled independently while preserving the conformal coverage guarantee.
If this is right
- Coverage guarantees hold under structural shifts that affect only one stage, where black-box conformal methods lose coverage.
- Practitioners obtain explicit attribution of uncertainty to the upstream or downstream stage.
- A single FWER-controlled calibration step selects the stage-specific scaling parameters.
- An adaptive extension maintains the guarantees when the underlying distribution changes over time.
Where Pith is reading between the lines
- The same decomposition idea could be applied to pipelines with more than two stages if the residuals remain additive or independently scalable.
- The diagnostic output might be combined with causal stage models to decide which stage to retrain first.
- In supply-chain or financial settings the stage-wise intervals could directly inform targeted inventory or hedging adjustments.
Load-bearing premise
The overall prediction residual can be decomposed into additive or independently scalable stage-specific components without invalidating the finite-sample coverage guarantee of conformal prediction.
What would settle it
An experiment in which stage-wise distribution shifts are introduced and the empirical coverage of the decomposed conformal intervals falls below the nominal target level would falsify the central claim.
Figures





read the original abstract
Conformal prediction offers finite-sample coverage guarantees under minimal assumptions. However, existing methods treat the entire modeling process as a black box, overlooking opportunities to exploit and understand modular structure. We introduce a conformal prediction framework for two-stage sequential models, where an upstream predictor generates intermediate representations for a downstream model. By decomposing the overall prediction residual into stage-specific components, our method enables practitioners to attribute uncertainty to specific pipeline stages. We develop a risk-controlled parameter selection procedure using family-wise error rate (FWER) control to calibrate stage-wise scaling parameters, and introduce an adaptive extension for non-stationary settings. Experiments on synthetic distribution shifts, as well as real-world supply chain and stock market data, demonstrate that our approach improves coverage under structural, stage-wise shifts compared to standard conformal methods, while identifying stage-wise error contribution. This framework offers diagnostic advantages and robust coverage that standard conformal methods lack.
Editorial analysis
A structured set of objections, weighed in public.
Referee Report
Summary. The paper introduces a decomposition-based modular conformal prediction framework for two-stage sequential models. It decomposes the overall prediction residual into stage-specific components to attribute uncertainty to specific pipeline stages, develops a risk-controlled parameter selection procedure using family-wise error rate (FWER) control to calibrate stage-wise scaling parameters, and introduces an adaptive extension for non-stationary settings. Experiments on synthetic distribution shifts as well as real-world supply chain and stock market data claim improved coverage under structural stage-wise shifts compared to standard conformal methods while identifying stage-wise error contributions.
Significance. If the finite-sample coverage guarantee is preserved after the proposed decomposition, the framework would provide useful diagnostic tools for attributing uncertainty in modular pipelines, which is valuable in domains like supply chain and finance. The use of FWER control for multiple scaling parameters and the adaptive extension represent practical extensions of conformal prediction.
major comments (1)
- [Abstract] Abstract: The central claim that the method retains the exact finite-sample coverage guarantee of conformal prediction after decomposing the overall residual into stage-specific components is load-bearing for the contribution. In sequential two-stage models the downstream predictor is typically a nonlinear function of the upstream output, so upstream residuals are transformed before reaching the final prediction; the abstract provides no indication of how the proof establishes that the resulting stage-wise scores remain exchangeable with the test point or that the decomposition exactly cancels the induced dependence.
minor comments (1)
- [Abstract] The abstract states that FWER control is used to calibrate stage-wise scaling parameters but does not specify the exact multiple-testing procedure, the definition of the family of hypotheses, or how the control is applied to the scaling parameters.
Simulated Author's Rebuttal
We thank the referee for the detailed review and constructive feedback on our manuscript. We respond to the major comment below.
read point-by-point responses
-
Referee: [Abstract] Abstract: The central claim that the method retains the exact finite-sample coverage guarantee of conformal prediction after decomposing the overall residual into stage-specific components is load-bearing for the contribution. In sequential two-stage models the downstream predictor is typically a nonlinear function of the upstream output, so upstream residuals are transformed before reaching the final prediction; the abstract provides no indication of how the proof establishes that the resulting stage-wise scores remain exchangeable with the test point or that the decomposition exactly cancels the induced dependence.
Authors: We appreciate the referee highlighting the need for clarity on this central claim. The finite-sample coverage guarantee is established in Theorem 1 (Section 3) by defining each stage-wise nonconformity score as a deterministic function of an individual data point (x, y) using the fixed trained models f1 and f2. Under the exchangeability assumption on the data, the vectors of stage-wise scores for the calibration points and test point are therefore exchangeable. The decomposition is constructed to be exactly additive, recovering the overall residual, so the standard conformal quantile on the overall score delivers the coverage guarantee while the stage-wise terms provide attribution. The nonlinear downstream mapping is applied identically to every point and thus does not disrupt exchangeability. We will revise the abstract to include a concise reference to this exchangeability argument. revision: yes
Circularity Check
No circularity: derivation builds on standard CP without self-referential reduction
full rationale
The paper introduces a modular CP framework by decomposing overall residuals into stage-specific components and using FWER-controlled calibration of scaling parameters. No quoted equations or procedures reduce the claimed finite-sample coverage or stage-wise attribution to quantities defined by the fitted scalings themselves. The method is presented as an extension of standard conformal prediction under an explicit (if strong) assumption that the decomposition preserves exchangeability; this assumption is not smuggled in via self-citation or by renaming a fitted quantity as a prediction. Experiments are empirical demonstrations rather than tautological outputs. The derivation chain therefore remains self-contained against external benchmarks.
Axiom & Free-Parameter Ledger
free parameters (1)
- stage-wise scaling parameters
axioms (2)
- standard math Standard conformal prediction coverage holds under exchangeability of the data.
- domain assumption The two-stage structure is known and the residual can be decomposed into stage-specific components.
Reference graph
Works this paper leans on
-
[1]
Anastasios Angelopoulos, Emmanuel Candes, and Ryan J Tibshirani. Conformal pid control for time series prediction.Advances in neural information processing systems, 36:23047–23074, 2023
work page 2023
-
[2]
Anastasios N Angelopoulos, Stephen Bates, Emmanuel J Candès, Michael I Jordan, and Lihua Lei. Learn then test: Calibrating predictive algorithms to achieve risk control.arXiv preprint arXiv:2110.01052, 2021
-
[3]
Conformal risk control.arXiv preprint arXiv:2208.02814, 2022
Anastasios N Angelopoulos, Stephen Bates, Adam Fisch, Lihua Lei, and Tal Schuster. Conformal risk control.arXiv preprint arXiv:2208.02814, 2022
-
[4]
Online conformal prediction with decaying step sizes.arXiv preprint arXiv:2402.01139, 2024
Anastasios N Angelopoulos, Rina Foygel Barber, and Stephen Bates. Online conformal prediction with decaying step sizes.arXiv preprint arXiv:2402.01139, 2024
-
[5]
A note on strong mixing of arma processes.Statistics & probability letters, 4(4):187–190, 1986
Krishna B Athreya and Sastry G Pantula. A note on strong mixing of arma processes.Statistics & probability letters, 4(4):187–190, 1986
work page 1986
-
[6]
Rina Foygel Barber. Hoeffding and bernstein inequalities for weighted sums of exchangeable random variables.arXiv preprint arXiv:2404.06457, 2024
-
[7]
Conformal prediction beyond exchangeability.The Annals of Statistics, 51(2):816–845, 2023
Rina Foygel Barber, Emmanuel J Candes, Aaditya Ramdas, and Ryan J Tibshirani. Conformal prediction beyond exchangeability.The Annals of Statistics, 51(2):816–845, 2023
work page 2023
-
[8]
Distribution- free, risk-controlling prediction sets.Journal of the ACM (JACM), 68(6):1–34, 2021
Stephen Bates, Anastasios Angelopoulos, Lihua Lei, Jitendra Malik, and Michael Jordan. Distribution- free, risk-controlling prediction sets.Journal of the ACM (JACM), 68(6):1–34, 2021
work page 2021
-
[9]
Multiple testing in clinical trials.Statistics in medicine, 10(6):871–890, 1991
Peter Bauer. Multiple testing in clinical trials.Statistics in medicine, 10(6):871–890, 1991
work page 1991
-
[10]
On the multiple hypotheses test, 1937
Carlo Emilio Bonferroni. On the multiple hypotheses test, 1937. origin of the Bonferroni correction
work page 1937
-
[11]
Dwight B Crane and James R Crotty. A two-stage forecasting model: Exponential smoothing and multiple regression.Management Science, 13(8):B–501, 1967
work page 1967
-
[12]
Non-exchangeable conformal risk control.arXiv preprint arXiv:2310.01262, 2023
António Farinhas, Chrysoula Zerva, Dennis Ulmer, and André FT Martins. Non-exchangeable conformal risk control.arXiv preprint arXiv:2310.01262, 2023
-
[13]
FRED. automobile indicators, 2025. data retrieved from FRED, https://fred.stlouisfed. org/series/CUSR0000SETA02
work page 2025
-
[14]
Isaac Gibbs and Emmanuel Candes. Adaptive conformal inference under distribution shift.Advances in Neural Information Processing Systems, 34:1660–1672, 2021
work page 2021
-
[15]
Isaac Gibbs and Emmanuel J Candès. Conformal inference for online prediction with arbitrary distribu- tion shifts.Journal of Machine Learning Research, 25(162):1–36, 2024
work page 2024
-
[16]
Leonid Kontorovich and Kavita Ramanan. Concentration inequalities for dependent random variables via the martingale method.Annals of Probability, 2008
work page 2008
-
[17]
Used vehicle value index, 2025
Manheim. Used vehicle value index, 2025. data retrieved from Cox Automative, https://site. manheim.com/en/services/consulting/used-vehicle-value-index.html. 12
work page 2025
-
[18]
Mehryar Mohri and Afshin Rostamizadeh. Stability bounds for stationary φ-mixing and β-mixing processes.Journal of Machine Learning Research, 11(2), 2010
work page 2010
-
[19]
Supply chain disruptions, inflation, and the fed.Econ Focus, 22(3Q):14–17, 2022
John Mullin. Supply chain disruptions, inflation, and the fed.Econ Focus, 22(3Q):14–17, 2022
work page 2022
-
[20]
Roberto I Oliveira, Paulo Orenstein, Thiago Ramos, and João Vitor Romano. Split conformal prediction and non-exchangeable data.Journal of Machine Learning Research, 25(225):1–38, 2024
work page 2024
-
[21]
Conformal language modeling.arXiv preprint arXiv:2306.10193, 2023
Victor Quach, Adam Fisch, Tal Schuster, Adam Yala, Jae Ho Sohn, Tommi S Jaakkola, and Regina Barzilay. Conformal language modeling.arXiv preprint arXiv:2306.10193, 2023
-
[22]
Conformalized quantile regression.Advances in neural information processing systems, 32, 2019
Yaniv Romano, Evan Patterson, and Emmanuel Candes. Conformalized quantile regression.Advances in neural information processing systems, 32, 2019
work page 2019
-
[23]
Robert J Serfling. Probability inequalities for the sum in sampling without replacement.The Annals of Statistics, pages 39–48, 1974
work page 1974
-
[24]
A tutorial on conformal prediction.Journal of Machine Learning Research, 9(3), 2008
Glenn Shafer and Vladimir V ovk. A tutorial on conformal prediction.Journal of Machine Learning Research, 9(3), 2008
work page 2008
-
[25]
Barı¸ s Soybilgen and Ege Yazgan. Nowcasting us gdp using tree-based ensemble models and dynamic factors.Computational Economics, 57(1):387–417, 2021
work page 2021
-
[26]
Ryan J. Tibshirani. Conformal prediction, 2023. URL https://www.stat.berkeley.edu/ ~ryantibs/statlearn-s23/lectures/conformal.pdf. Lecture notes for Advanced Top- ics in Statistical Learning, Spring 2023, University of California, Berkeley
work page 2023
-
[27]
Conditional validity of inductive conformal predictors
Vladimir V ovk. Conditional validity of inductive conformal predictors. InAsian conference on machine learning, pages 475–490. PMLR, 2012
work page 2012
-
[28]
Vladimir V ovk, Alexander Gammerman, and Glenn Shafer.Algorithmic learning in a random world, volume 29. Springer, 2005
work page 2005
-
[29]
Error-quantified conformal inference for time series.arXiv preprint arXiv:2502.00818, 2025
Junxi Wu, Dongjian Hu, Yajie Bao, Shu-Tao Xia, and Changliang Zou. Error-quantified conformal inference for time series.arXiv preprint arXiv:2502.00818, 2025
-
[30]
Adaptive conformal predictions for time series
Margaux Zaffran, Olivier Féron, Yannig Goude, Julie Josse, and Aymeric Dieuleveut. Adaptive conformal predictions for time series. InInternational Conference on Machine Learning, pages 25834–25866. PMLR, 2022
work page 2022
-
[31]
Conformal prediction sets for graph neural networks
Soroush H Zargarbashi, Simone Antonelli, and Aleksandar Bojchevski. Conformal prediction sets for graph neural networks. InInternational Conference on Machine Learning, pages 12292–12318. PMLR, 2023
work page 2023
-
[32]
Conformal structured prediction
Botong Zhang, Shuo Li, and Osbert Bastani. Conformal structured prediction. InICLR 2025 Workshop on Building Trust in Language Models and Applications, 2025. URLhttps://openreview.net/ forum?id=mKfmLQXP6J. 13 A Appendix A.1 Main Results/Proofs Proof of Theorem 1 Proof.We consider the event ytest /∈ˆCc,d(wtest) where ˆCc,d is the prediction interval define...
work page 2025
-
[33]
tY s=1 exp(τ(err s −E[err s|As])) # ≤exp(τ 2/2)E
By the intermediate value theorem, there must exist a pair (a∗, b∗)∈[0,1] 2 such that the interval achieves exactly1−αcoverage. As an aside, one can further view the problem as an optimization problem min a,b aQ1−α({∆R1}) +bQ 1−α({R2}) s.t. P(R≥aQ 1−α({∆R1}) +bQ 1−α({R2}))≤α which by KKT conditions implies that anya ∗, b∗ must satisfy 1 Q1−α({∆R1}) ∂P(R≥a...
work page 2007
discussion (0)
Sign in with ORCID, Apple, or X to comment. Anyone can read and Pith papers without signing in.