REVIEW 3 major objections 5 minor 1 cited by
What is the True HI Gas Content in Massive Quiescent Galaxies in the Local Universe?
T0 review · 3 major / 5 minor · reviewed 2026-08-04 · deepseek-v4-flash
Pith's one-line read Deep 21-cm observations show that most nearby massive quiescent galaxies are far poorer in atomic hydrogen than previous surveys implied, with a stacked upper limit of about 0.03% of stellar mass for the non-detected majority.
desk verdict First deep HI survey of a representative massive-quiescent sample; the two-thirds HI-poor claim is plausible but rests on upper limits and an unquantified FAST flux-loss correction. read the letter →
The pith
A machine-rendered reading of the paper's core claim, the machinery that carries it, and where it could break.
The reading
What carries the argument
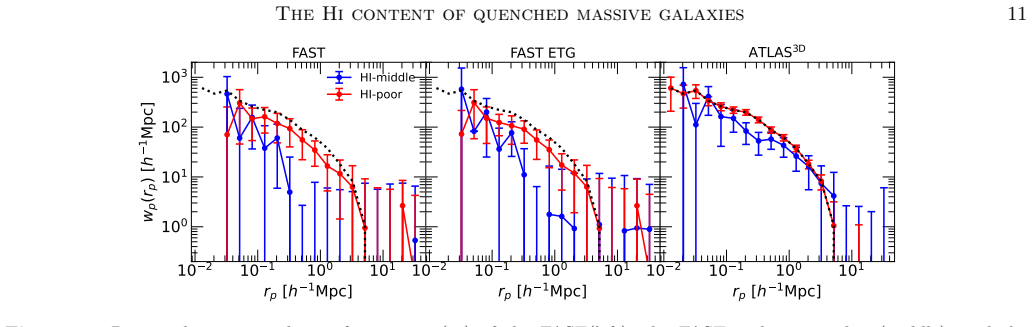
The measurements rest on deep single-pointing 21-cm spectroscopy with a very large single-dish telescope, reaching 5-sigma sensitivity of log(M_HI/M*) = -2.4 for the full sample and -3 for a subset. The second essential tool is spectral stacking: co-adding the undetected spectra to reach a population-average 3-sigma limit of log(M_HI/M*) < -3.46. Environmental characterisation uses projected cross-correlation functions, background-subtracted neighbour counts, and central-versus-satellite classification in a galaxy group catalogue; these provide the paper's evidence on how environment relates to gas content.
What would settle it
Observe a representative sample of ~20 of the 44 non-detected galaxies with a synthesis interferometer that can recover extended, low-surface-brightness 21-cm emission. If a significant fraction show HI disks or tidal tails beyond the single beam, the quoted 63% HI-poor fraction and the stacked -3.46 limit would be overestimated.
Extended reading notes
Core claim
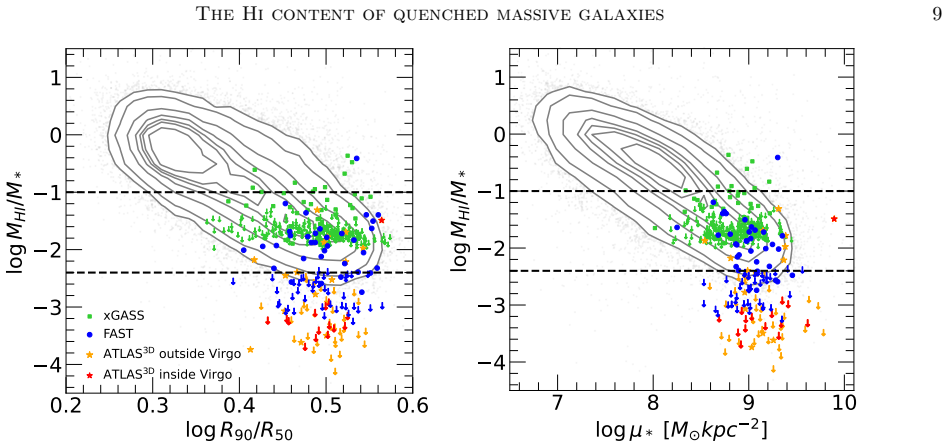
The central claim is that the majority of local massive quiescent galaxies are far poorer in atomic hydrogen than previous surveys implied, and that this extreme poverty is a general property of the population rather than a quirk of early-type morphology. From 21-cm spectra of 78 galaxies chosen by stellar mass (above 10^10 solar masses) and colour (NUV-r > 5), the authors detect only one-third; the remaining two-thirds have upper limits below log(M_HI/M*) = -2.4, and a stack of the 44 non-detections gives a 3-sigma limit of log(M_HI/M*) < -3.46. The detected galaxies follow the scaling relations derived from shallower surveys, while the non-detections systematically fall far below the predi
Load-bearing premise
The paper's central numbers assume that a non-detection in a single radio pointing really means the galaxy has almost no atomic hydrogen, rather than that its hydrogen is spread over a region larger than the telescope beam.
Editorial extensions
If this is right
- Most massive quiescent galaxies hold less than ~0.4% of their stellar mass in atomic hydrogen, and the non-detected majority is probably well below ~0.03% on average.
- Existing empirical HI estimators calibrated on shallower, morphology-mixed samples systematically overpredict gas in this regime; they need a non-Gaussian scatter model or extra morphology/environment terms.
- Since a large minority of HI-poor galaxies are centrals, gas removal cannot be exclusively an environmental process; internal feedback or cooling failure must also be able to strip the reservoir.
- Early-type morphology is a necessary but insufficient condition for extreme HI poverty, so 'quenched must mean gas-poor' is empirically false in the other direction: some early types retain moderate HI.
- The required depth for future surveys is set: detection limits near 0.1–0.01% of stellar mass are needed to map the full gas-fraction distribution of quiescent systems.
Reading between the lines
- The single-pointing strategy may undercount HI in galaxies with extended or lopsided disks; mapping a subsample with an interferometer would separate real poverty from beam-missed emission—a test the authors flag but do not perform.
- The double-peaked distribution of gas fractions is consistent with two quenching channels—a gas-stripping channel for early types/satellites and a slower residual-gas channel for some centrals—which the paper leaves as an open possibility.
- If the stacked limit holds, the non-detected galaxies have less than about 10^7 solar masses of atomic hydrogen; comparing that with their molecular gas, hot halo gas, and radio-AGN activity would discriminate between AGN feedback and shock-heating as the dominant gas-removal mechanism.
- A direct extension would be to apply the same selection and depth at z ≈ 0.1–0.2 to see whether the extreme HI poverty is already in place shortly after quenching or develops later; current data only constrain the local endpoint.
Editorial analysis
A structured set of objections, weighed in public.
Referee Report
Summary. This paper presents FAST single-dish HI observations of 78 massive quiescent galaxies selected from NSA by M* > 10^10 Msun and NUV-r > 5, with 34 detections and 44 non-detections reaching log(M_HI/M*) ≈ -2.4 to -3. The central claim is that roughly two-thirds (63% ± 7%, 49/78) of the sample are HI-poor, defined as log(M_HI/M*) < -2.4, and that stacking the non-detections gives a 3σ upper limit of log(M_HI/M*) < -3.46. The authors compare their sample with xGASS and ATLAS3D, examine dependencies on color, sSFR, structure, morphology and environment, and conclude that early-type morphology and satellite status are important but not sufficient, implying additional quenching mechanisms. They also test the HI mass estimator of X. Li et al. (2022) and find that only the HI-detected third follows its predictions.
Significance. If the HI-poor fraction and stacked upper limit are robust, this is a valuable observational constraint: it extends evidence for extreme HI poverty beyond morphologically selected early-type galaxies to a representative massive-quiescent sample and provides a quantitative benchmark for gas-removal mechanisms. The paper is careful in several respects: it uses a random subset of a well-defined parent sample, provides deep limits, performs a stacking analysis, and explicitly compares FAST with ALFALFA to assess systematics. The environmental analysis based on cross-correlation functions, neighbor counts, and central/satellite classification is a useful addition. However, the headline fraction rests almost entirely on non-detections, and the acknowledged FAST/ALFALFA flux deficit is not propagated into the HI-poor classification. The abstract and body also disagree on the achieved sensitivities. These issues must be resolved before the central claim can be accepted.
major comments (3)
- [§3.1 and Appendix A (Eq. A2; Figs. 10-11)] The claim that roughly two-thirds (63%) of the sample are HI-poor rests on 44 non-detections plus 5 detections below log(M_HI/M*) = -2.4. Appendix A reports that FAST integrated fluxes are 20-30% lower than ALFALFA for 5 of 6 comparison galaxies, that for id=24 the HI disk is larger than the FAST beam, and that the authors 'cannot rule out potential flux loss from extended HI components beyond the HI radius.' The text asserts this 'does not affect the qualitative conclusions,' but no quantitative test is given. A systematic flux deficit of 0.1-0.15 dex applied to the upper limits could move a substantial fraction of the 44 non-detections across the -2.4 threshold; moving roughly 10 objects would bring the HI-poor fraction below 50%. Please propagate the FAST/ALFALFA calibration offset into the individual and stacked limits, quote a systematic uncertainty on the 63% fraction, and state ho
- [Abstract vs. §2.1 and §5] The abstract states that the observations reach log(M_HI/M*) = -2.6 for 55 targets and -3.2 for 23 targets, while §2.1 and §5 state that the first round reached -2.4 for 74 targets and -3 for 4 targets, with a follow-up of 19 non-detections to -3. These numbers are mutually inconsistent. Since the sensitivity limits directly determine which galaxies are classified as HI-poor and the depth of the stacking limit, this discrepancy must be corrected and the abstract aligned with the body.
- [§3.1-§3.3 and Figs. 3-5] The conclusion that the HI mass fraction shows no clear correlation with sSFR, NUV-r, concentration, or stellar surface density is based primarily on visual inspection of plots in which 44 of 78 objects are upper limits and several detections lie near the -2.4 threshold. With this degree of censoring, a visual statement is not a robust null result. I ask the authors to add a quantitative censored-data analysis (e.g., survival regression or a likelihood that incorporates upper limits) or to soften the claim to 'no significant correlation is detected with the current sample,' clearly stating the sensitivity of this conclusion to the systematic flux issue.
minor comments (5)
- [Appendix A heading] The heading reads 'FAST HI OBSERVATION AND DATA DEDUCTION'; 'DEDUCTION' should be 'REDUCTION'.
- [Abstract and §2.1] The abstract lists log sSFR < -11 as a selection criterion, but §2.1 states the sample is selected only by M* and NUV-r; the sSFR condition is checked a posteriori. Please make these statements consistent.
- [§3.1] The sentence 'approximately two-thirds of the sample galaxies remain undetected in HI' is inaccurate: 44/78 = 56% are non-detections, while the HI-poor fraction including the five low-mass detections is 63%. Rephrase to refer to the HI-poor classification rather than non-detections.
- [Appendix A, Figs. 10-11] The claim of a 20-30% systematic offset includes sources with poor ALFALFA quality flags (id=3 and id=75). Please state how the offset changes if these two low-SNR sources are excluded, to show that the conclusion is not driven by them.
- [Eq. A2 and §3.1] The assumed line width W=300 km/s in Eq. (A2) is a conservative choice, but the text should note explicitly that narrower real lines would yield lower (more restrictive) upper limits, so the assumption cannot bias the sample toward HI-poor classification.
Circularity Check
No significant circularity: the central HI-poor fraction is a direct observational measurement, independent of the authors' earlier estimator.
full rationale
The paper's central claims rest on FAST detections, non-detections, and a stacked upper limit (log M_HI/M* < -3.46), which are direct data products. The X. Li et al. (2022) estimator enters only as a comparison baseline for a predicted HI distribution; it is not fitted to the FAST data and does not determine the measured non-detection fraction. The HI-poor threshold of log M_HI/M* = -2.4 is tied to the survey's designed 5-sigma sensitivity, so counting non-detections as HI-poor is a sensitivity-driven observational classification rather than a fitted parameter renamed as a prediction. The Appendix A FAST/ALFALFA flux offset is an acknowledged observational bias and a correctness concern, not circularity. Self-citations to X. Li et al. (2022, 2024) appear in comparisons and discussion, but they are not load-bearing for the main measurement: the conclusion that the estimator under-predicts the extreme HI-poor population follows from comparing independent FAST upper limits with model predictions. No step reduces by construction to its own inputs.
Assumptions & free parameters
free parameters (2)
- HI-poor threshold log(M_HI/M*) = -2.4 =
-2.4 (chosen by hand)
- Assumed HI line width W =
300 km/s
assumptions (6)
- standard math HI mass formula from integrated flux (Meyer et al. 2017) is correct for these sources
- domain assumption NSA stellar masses and NUV-r colors are accurate
- domain assumption SED fitting with CIGALE yields reliable SFRs
- ad hoc to paper No significant HI confusion from companion galaxies within 3' and 500 km/s
- domain assumption Yang et al. (2007) group catalog correctly identifies central/satellite status
- domain assumption FAST flux calibration and gain parameters are accurate
Cite this review
Pith. "Pith review of What is the True HI Gas Content in Massive Quiescent Galaxies in the Local Universe?." pith.science (2026). https://pith.science/paper/FMRCXGNS
@misc{pith2026251015145,
  author       = {Pith},
  title        = {Pith review of: What is the True HI Gas Content in Massive Quiescent Galaxies in the Local Universe?},
  year         = {2026},
  howpublished = {\url{https://pith.science/paper/FMRCXGNS}},
  note         = {Machine review of arXiv:2510.15145}
}
abstract
While massive quiescent galaxies are known to be poor in atomic hydrogen (HI), their true HI content remains poorly constrained due to the limited sensitivity and morphological biases of existing surveys. We present deep HI observations using the Five-hundred-meter Aperture Spherical radio Telescope (FAST) for a representative sample of 78 low-redshift massive quiescent galaxies, selected by stellar mass ($M_\ast > 10^{10} M_\odot$), color (NUV$-r > 5$), and specific star formation rate ($\rm \log sSFR < -11\ yr^{-1}$). Our observations reach a remarkable sensitivity of $\log(M_{HI}/M_\ast) = -2.6$ for 55 targets and $\log(M_{HI}/M_\ast) = -3.2$ for 23 targets. We find that one-third of the sample follows the HI scaling relation derived from previous surveys, while the remaining two-thirds exhibit significantly lower HI content. The HI mass fraction shows no clear correlation with specific star formation rate, NUV$-r$ color index, stellar surface mass density, and concentration. Our FAST sample shows remarkable similarity to the $ATLAS^{3D}$ sample which only includes early-type galaxies, both in its high fraction of HI-poor galaxies and its high satellite fraction among HI-poor galaxies. These results suggest that while both early-type morphology and environment may contribute to the extreme HI deficiency, neither factor alone fully explains the observed gas depletion, indicating that additional physical mechanisms must be responsible for the extreme HI deficiency prevalent in massive quiescent galaxies.
Figures


Figures from the paper (10 more)



Forward citations
Cited by 1 Pith paper
-
The FAST Hundred-Deg$^2$ HI Deep (HD$^2$) Survey: Early Results from the Pilot Survey
Pilot FAST HD² survey reports 339 new HI detections in 10 deg² with 0.45 mJy rms, high DESI optical matching rates, and gas fraction relations consistent with ALFALFA, DINGO, and xGASS.
Reference graph
Works this paper leans on
-
[1]
, " * write output.state after.block = add.period write newline
ENTRY address archivePrefix author booktitle chapter doi edition editor eprint howpublished institution journal key month number organization pages publisher school series title misctitle type volume year version url label extra.label sort.label short.list INTEGERS output.state before.all mid.sentence after.sentence after.block FUNCTION init.state.consts ...
-
[2]
write newline
" write newline "" before.all 'output.state := FUNCTION format.url url empty "" new.block "" url * "" * if FUNCTION format.eprint eprint empty "" archivePrefix empty "" archivePrefix "arXiv" = new.block " " eprint * " " * new.block " " eprint * " " * if if if FUNCTION format.doi doi empty "" " " doi * " " * if FUNCTION format.pid doi empty eprint empty ur...
-
[3]
2۽/h#V« be x k6o ^e +UF) ⋯ ^e +UFs ,a5c Px!.PxO ɅZ zb [ Tr#^ i@ּ
thebibliography [1] 20pt to REFERENCES 6pt =0pt \@twocolumntrue 12pt -12pt 10pt plus 3pt =0pt =0pt =1pt plus 1pt =0pt =0pt -12pt =13pt plus 1pt =20pt =13pt plus 1pt \@M =10000 =-1.0em =0pt =0pt 0pt =0pt =1.0em @enumiv\@empty 10000 10000 `\.\@m \@noitemerr \@latex@warning Empty `thebibliography' environment \@ifnextchar \@reference \@latexerr Missing key o...
arXiv 2017
-
[4]
Abadi , M. G., Moore , B., & Bower , R. G. 1999, title Ram pressure stripping of spiral galaxies in clusters , , 308, 947, 10.1046/j.1365-8711.1999.02715.x
arXiv 1999
-
[5]
Adelman-McCarthy, J. K., Agüeros, M. A., Allam, S. S., et al. 2008, title The Sixth Data Release of the Sloan Digital Sky Survey, The Astrophysical Journal Supplement Series, 175, 297, 10.1086/524984
doi:10.1086/524984 2008
-
[6]
Astropy Collaboration , Robitaille , T. P., Tollerud , E. J., et al. 2013, title Astropy: A community Python package for astronomy , AAP, 558, A33, 10.1051/0004-6361/201322068
-
[7]
Astropy Collaboration , Price-Whelan , A. M., Sip o cz , B. M., et al. 2018, title The Astropy Project: Building an Open-science Project and Status of the v2.0 Core Package , AJ, 156, 123, 10.3847/1538-3881/aabc4f
-
[8]
Astropy Collaboration , Price-Whelan , A. M., Lim , P. L., et al. 2022, title The Astropy Project: Sustaining and Growing a Community-oriented Open-source Project and the Latest Major Release (v5.0) of the Core Package , ApJ, 935, 167, 10.3847/1538-4357/ac7c74
Show all 95 references
-
[9]
K., Glazebrook , K., Brinkmann , J., et al
Baldry , I. K., Glazebrook , K., Brinkmann , J., et al. 2004, title Quantifying the Bimodal Color-Magnitude Distribution of Galaxies , , 600, 681, 10.1086/380092
2004 doi
-
[11]
2025, title Atomic hydrogen reservoirs in quiescent galaxies at z = 0.4 , arXiv e-prints, arXiv:2507.16917, 10.48550/arXiv.2507.16917
Bianchetti , A., Rodighiero , G., Donevski , D., et al. 2025, title Atomic hydrogen reservoirs in quiescent galaxies at z = 0.4 , arXiv e-prints, arXiv:2507.16917, 10.48550/arXiv.2507.16917
2025 doi
-
[12]
1977, title The physics of dissipational galaxy formation
Binney , J. 1977, title The physics of dissipational galaxy formation. , , 215, 483, 10.1086/155378
1977 doi
-
[13]
2003, title Virial shocks in galactic haloes? , , 345, 349, 10.1046/j.1365-8711.2003.06955.x
Birnboim , Y., & Dekel , A. 2003, title Virial shocks in galactic haloes? , , 345, 349, 10.1046/j.1365-8711.2003.06955.x
2003
-
[14]
R., Kazin , E., Muna , D., Weaver , B
Blanton , M. R., Kazin , E., Muna , D., Weaver , B. A., & Price-Whelan , A. 2011, title Improved Background Subtraction for the Sloan Digital Sky Survey Images , AJ, 142, 31, 10.1088/0004-6256/142/1/31
2011 doi
-
[15]
R., Faber , S
Blumenthal , G. R., Faber , S. M., Primack , J. R., & Rees , M. J. 1984, title Formation of galaxies and large-scale structure with cold dark matter. , , 311, 517, 10.1038/311517a0
1984 doi
-
[17]
2019, title CIGALE: a python Code Investigating GALaxy Emission , , 622, A103, 10.1051/0004-6361/201834156
Boquien , M., Burgarella , D., Roehlly , Y., et al. 2019, title CIGALE: a python Code Investigating GALaxy Emission , , 622, A103, 10.1051/0004-6361/201834156
2019 doi
-
[18]
2006, title Environmental Effects on Late-Type Galaxies in Nearby Clusters , , 118, 517, 10.1086/500691
Boselli , A., & Gavazzi , G. 2006, title Environmental Effects on Late-Type Galaxies in Nearby Clusters , , 118, 517, 10.1086/500691
2006 doi
-
[19]
S., Wagg , J., Cicone , C., et al
Bothwell , M. S., Wagg , J., Cicone , C., et al. 2014, title ALLSMOG: an APEX Low-redshift Legacy Survey for MOlecular Gas - I. Molecular gas scaling relations, and the effect of the CO/H _ 2 conversion factor , , 445, 2599, 10.1093/mnras/stu1936
2014 doi
-
[20]
2015, title The effect of structure and star formation on the gas content of nearby galaxies , , 452, 2479, 10.1093/mnras/stv1311
Brown , T., Catinella , B., Cortese , L., et al. 2015, title The effect of structure and star formation on the gas content of nearby galaxies , , 452, 2479, 10.1093/mnras/stv1311
2015 doi
-
[21]
2017, title Cold gas stripping in satellite galaxies: from pairs to clusters , , 466, 1275, 10.1093/mnras/stw2991
Brown , T., Catinella , B., Cortese , L., et al. 2017, title Cold gas stripping in satellite galaxies: from pairs to clusters , , 466, 1275, 10.1093/mnras/stw2991
2017 doi
-
[23]
2013, title The ATLAS ^ 3D project - XV
Cappellari , M., Scott , N., Alatalo , K., et al. 2013, title The ATLAS ^ 3D project - XV. Benchmark for early-type galaxies scaling relations from 260 dynamical models: mass-to-light ratio, dark matter, Fundamental Plane and Mass Plane , MNRAS, 432, 1709, 10.1093/mnras/stt562
2013 doi
-
[25]
2018, title xGASS: total cold gas scaling relations and molecular-to-atomic gas ratios of galaxies in the local Universe , MNRAS, 476, 875, 10.1093/mnras/sty089
Catinella, B., Saintonge, A., Janowiecki, S., et al. 2018, title xGASS: total cold gas scaling relations and molecular-to-atomic gas ratios of galaxies in the local Universe , MNRAS, 476, 875, 10.1093/mnras/sty089
2018 doi
-
[27]
2003, title Galactic Stellar and Substellar Initial Mass Function , PASP, 115, 763, 10.1086/376392
Chabrier , G. 2003, title Galactic Stellar and Substellar Initial Mass Function , PASP, 115, 763, 10.1086/376392
2003 doi
-
[28]
Cortese , L., Catinella , B., Cook , R. H. W., & Janowiecki , S. 2020, title xGASS: passive discs do not host unexpectedly large reservoirs of cold atomic hydrogen , MNRAS, 494, L42, 10.1093/mnrasl/slaa032
2020 doi
-
[29]
2021, title The Dawes Review 9: The role of cold gas stripping on the star formation quenching of satellite galaxies , , 38, e035, 10.1017/pasa.2021.18
Cortese , L., Catinella , B., & Smith , R. 2021, title The Dawes Review 9: The role of cold gas stripping on the star formation quenching of satellite galaxies , , 38, e035, 10.1017/pasa.2021.18
2021 doi
-
[30]
A., Schaye , J., Bower , R
Crain , R. A., Schaye , J., Bower , R. G., et al. 2015, title The EAGLE simulations of galaxy formation: calibration of subgrid physics and model variations , MNRAS, 450, 1937, 10.1093/mnras/stv725
2015 doi
-
[33]
2005, title Energy input from quasars regulates the growth and activity of black holes and their host galaxies , , 433, 604, 10.1038/nature03335
Di Matteo , T., Springel , V., & Hernquist , L. 2005, title Energy input from quasars regulates the growth and activity of black holes and their host galaxies , , 433, 604, 10.1038/nature03335
2005 doi
-
[34]
Dom \' nguez S \'a nchez , H., Huertas-Company , M., Bernardi , M., Tuccillo , D., & Fischer , J. L. 2018, title Improving galaxy morphologies for SDSS with Deep Learning , , 476, 3661, 10.1093/mnras/sty338
2018 doi
-
[36]
D., Kannappan , S
Eckert , K. D., Kannappan , S. J., Stark , D. V., et al. 2015, title RESOLVE Survey Photometry and Volume-limited Calibration of the Photometric Gas Fractions Technique , ApJ, 810, 166, 10.1088/0004-637X/810/2/166
2015 doi
-
[37]
2011 a , title ALFALFA H I data stacking - I
Fabello , S., Catinella , B., Giovanelli , R., et al. 2011 a , title ALFALFA H I data stacking - I. Does the bulge quench ongoing star formation in early-type galaxies? , , 411, 993, 10.1111/j.1365-2966.2010.17742.x
2011
-
[40]
2016, title corner.py: Scatterplot matrices in Python, The Journal of Open Source Software, 1, 24, 10.21105/joss.00024
Foreman-Mackey, D. 2016, title corner.py: Scatterplot matrices in Python, The Journal of Open Source Software, 1, 24, 10.21105/joss.00024
2016 doi
-
[41]
A., Guglielmino , G., & Prandoni , I
Ger \'e b , K., Morganti , R., Oosterloo , T. A., Guglielmino , G., & Prandoni , I. 2013, title The Lockman Hole project: gas and galaxy properties from a stacking experiment , , 558, A54, 10.1051/0004-6361/201322113
2013 doi
-
[42]
P., Kent, B
Giovanelli, R., Haynes, M. P., Kent, B. R., et al. 2005, title The Arecibo Legacy Fast ALFA Survey. I. Science Goals, Survey Design, and Strategy, The Astronomical Journal, 130, 2598, 10.1086/497431
2005 doi
-
[43]
E., & Gott , J
Gunn , J. E., & Gott , J. Richard, I. 1972, title On the Infall of Matter Into Clusters of Galaxies and Some Effects on Their Evolution , ApJ, 176, 1, 10.1086/151605
1972 doi
-
[44]
G., Haynes , M
Guo , H., Jones , M. G., Haynes , M. P., & Fu , J. 2020, title Direct Measurement of the H I-halo Mass Relation through Stacking , ApJ, 894, 92, 10.3847/1538-4357/ab886f
2020 doi
-
[45]
G., Wang , J., & Lin , L
Guo , H., Jones , M. G., Wang , J., & Lin , L. 2021, title Star Formation and Quenching of Central Galaxies from Stacked HI Measurements , ApJ, 918, 53, 10.3847/1538-4357/ac062e
2021 doi
-
[46]
2017, title Constraining the H I-Halo Mass Relation from Galaxy Clustering , ApJ, 846, 61, 10.3847/1538-4357/aa85e7
Guo , H., Li , C., Zheng , Z., et al. 2017, title Constraining the H I-Halo Mass Relation from Galaxy Clustering , ApJ, 846, 61, 10.3847/1538-4357/aa85e7
2017 doi
-
[47]
R., Millman , K
Harris , C. R., Millman , K. J., van der Walt , S. J., et al. 2020, title Array programming with NumPy , Nature, 585, 357, 10.1038/s41586-020-2649-2
2020 doi
-
[48]
P., Giovanelli , R., Kent , B
Haynes , M. P., Giovanelli , R., Kent , B. R., et al. 2018, title The Arecibo Legacy Fast ALFA Survey: The ALFALFA Extragalactic H I Source Catalog , ApJ, 861, 49, 10.3847/1538-4357/aac956
2018 doi
-
[49]
F., Hernquist , L., Cox , T
Hopkins , P. F., Hernquist , L., Cox , T. J., et al. 2006, title A Unified, Merger-driven Model of the Origin of Starbursts, Quasars, the Cosmic X-Ray Background, Supermassive Black Holes, and Galaxy Spheroids , , 163, 1, 10.1086/499298
2006 doi
-
[50]
F., Kere s , D., O \ n orbe , J., et al
Hopkins , P. F., Kere s , D., O \ n orbe , J., et al. 2014, title Galaxies on FIRE (Feedback In Realistic Environments): stellar feedback explains cosmologically inefficient star formation , , 445, 581, 10.1093/mnras/stu1738
2014 doi
-
[51]
2019, title An accurate low-redshift measurement of the cosmic neutral hydrogen density , , 489, 1619, 10.1093/mnras/stz2038
Hu , W., Hoppmann , L., Staveley-Smith , L., et al. 2019, title An accurate low-redshift measurement of the cosmic neutral hydrogen density , , 489, 1619, 10.1093/mnras/stz2038
2019 doi
-
[52]
P., Giovanelli , R., & Brinchmann , J
Huang , S., Haynes , M. P., Giovanelli , R., & Brinchmann , J. 2012, title The Arecibo Legacy Fast ALFA Survey: The Galaxy Population Detected by ALFALFA , ApJ, 756, 113, 10.1088/0004-637X/756/2/113
2012 doi
-
[53]
Hunter , J. D. 2007, title Matplotlib: A 2D Graphics Environment , Computing in Science and Engineering, 9, 90, 10.1109/MCSE.2007.55
2007 doi
-
[54]
2019, title Commissioning progress of the FAST , Science China Physics, Mechanics, and Astronomy, 62, 959502, 10.1007/s11433-018-9376-1
Jiang , P., Yue , Y., Gan , H., et al. 2019, title Commissioning progress of the FAST , Science China Physics, Mechanics, and Astronomy, 62, 959502, 10.1007/s11433-018-9376-1
2019 doi
-
[55]
2020, title The fundamental performance of FAST with 19-beam receiver at L band , Research in Astronomy and Astrophysics, 20, 064, 10.1088/1674-4527/20/5/64
Jiang , P., Tang , N.-Y., Hou , L.-G., et al. 2020, title The fundamental performance of FAST with 19-beam receiver at L band , Research in Astronomy and Astrophysics, 20, 064, 10.1088/1674-4527/20/5/64
2020 doi
-
[56]
Kannappan , S. J. 2004, title Linking Gas Fractions to Bimodalities in Galaxy Properties , ApJl, 611, L89, 10.1086/423785
2004 doi
-
[57]
J., & Wei , L
Kannappan , S. J., & Wei , L. H. 2008, title Galaxy Gas Fractions, Characteristic Mass Scales, and the RESOLVE Survey , in American Institute of Physics Conference Series, Vol. 1035, The Evolution of Galaxies Through the Neutral Hydrogen Window, ed. R. Minchin & E. Momjian , 1...
2008 doi
-
[58]
Kauffmann , G., White , S. D. M., Heckman , T. M., et al. 2004, title The environmental dependence of the relations between stellar mass, structure, star formation and nuclear activity in galaxies , , 353, 713, 10.1111/j.1365-2966.2004.08117.x
2004
-
[59]
H., & Dav \'e , R
Kere s , D., Katz , N., Weinberg , D. H., & Dav \'e , R. 2005, title How do galaxies get their gas? , , 363, 2, 10.1111/j.1365-2966.2005.09451.x
2005
-
[61]
2017, title A star formation study of the ATLAS ^ 3D early-type galaxies with the AKARI all-sky survey , AAP, 605, A74, 10.1051/0004-6361/201630158
Kokusho , T., Kaneda , H., Bureau , M., et al. 2017, title A star formation study of the ATLAS ^ 3D early-type galaxies with the AKARI all-sky survey , AAP, 605, A74, 10.1051/0004-6361/201630158
2017 doi
-
[62]
W., & Schlegel , D
Lang , D., Hogg , D. W., & Schlegel , D. J. 2016, title WISE Photometry for 400 Million SDSS Sources , , 151, 36, 10.3847/0004-6256/151/2/36
2016 doi
-
[63]
J., Schiminovich , D., Catinella , B., Heckman , T
Lemonias , J. J., Schiminovich , D., Catinella , B., Heckman , T. M., & Moran , S. M. 2014, title Resolved H I Imaging of a Population of Massive H I-rich Galaxies with Suppressed Star Formation , ApJ, 790, 27, 10.1088/0004-637X/790/1/27
2014 doi
-
[66]
M., White , S
Li , C., Kauffmann , G., Heckman , T. M., White , S. D. M., & Jing , Y. P. 2008 b , title Interactions, star formation and AGN activity , MNRAS, 385, 1915, 10.1111/j.1365-2966.2008.13023.x
2008
-
[67]
2006, title The clustering of narrow-line AGN in the local Universe , MNRAS, 373, 457, 10.1111/j.1365-2966.2006.11079.x
Li , C., Kauffmann , G., Wang , L., et al. 2006, title The clustering of narrow-line AGN in the local Universe , MNRAS, 373, 457, 10.1111/j.1365-2966.2006.11079.x
2006
-
[68]
2024, title Exploring the Origin of Cold Gas and Star Formation in a Rare Population of Strongly Bulge-dominated Early-type Galaxies , , 974, 238, 10.3847/1538-4357/ad6b97
Li , F., Wang , E., Zhu , M., et al. 2024, title Exploring the Origin of Cold Gas and Star Formation in a Rare Population of Strongly Bulge-dominated Early-type Galaxies , , 974, 238, 10.3847/1538-4357/ad6b97
2024 doi
-
[69]
Li , X., Li , C., & Mo , H. J. 2025, title What Drives the H I Content of Central Galaxies A Comparison between Hydrodynamic Simulations and Observations Using Random Forest , , 980, 145, 10.3847/1538-4357/adace2
2025 doi
-
[70]
J., et al
Li , X., Li , C., Mo , H. J., et al. 2024, title On the Existence, Rareness, and Uniqueness of Quenched H I-rich Galaxies in the Local Universe , ApJ, 963, 86, 10.3847/1538-4357/ad1ce3
2024 doi
-
[71]
J., Xiao , T., & Wang , J
Li , X., Li , C., Mo , H. J., Xiao , T., & Wang , J. 2022, title Conditional H I Mass Functions and the H I-to-halo Mass Relation in the Local Universe , ApJ, 941, 48, 10.3847/1538-4357/ac9ccb
2022 doi
-
[72]
A., Ho , L
Li , Y. A., Ho , L. C., Shangguan , J., Li , Z.-Y., & Peng , Y. 2025, title The Origin of the Gas and Its Low Star Formation Efficiency in Quiescent Galaxies , arXiv e-prints, arXiv:2503.11198. 2503.11198
2025 arXiv
-
[73]
2024, title Establishing HI mass vs
Lu , Y., Yang , X., Liu , C., et al. 2024, title Establishing HI mass vs. stellar mass and halo mass scaling relations using an abundance matching method , Science China Physics, Mechanics, and Astronomy, 67, 119511, 10.1007/s11433-024-2440-3
2024 doi
-
[74]
A., Schaye , J., et al
Marasco , A., Crain , R. A., Schaye , J., et al. 2016, title The environmental dependence of H I in galaxies in the EAGLE simulations , , 461, 2630, 10.1093/mnras/stw1498
2016 doi
-
[75]
C., Fanson, J., Schiminovich, D., et al
Martin, D. C., Fanson, J., Schiminovich, D., et al. 2005, title The Galaxy Evolution Explorer : A Space Ultraviolet Survey Mission, The Astrophysical Journal, 619, L1, 10.1086/426387
2005 doi
- [76]
-
[77]
2017, title Tracing HI Beyond the Local Universe , , 34, 52, 10.1017/pasa.2017.31
Meyer , M., Robotham , A., Obreschkow , D., et al. 2017, title Tracing HI Beyond the Local Universe , , 34, 52, 10.1017/pasa.2017.31
2017 doi
-
[78]
1996, title Galaxy harassment and the evolution of clusters of galaxies , , 379, 613, 10.1038/379613a0
Moore , B., Katz , N., Lake , G., Dressler , A., & Oemler , A. 1996, title Galaxy harassment and the evolution of clusters of galaxies , , 379, 613, 10.1038/379613a0
1996 doi
-
[79]
V., Koyama , Y., Koyama , S., et al
Namiki , S. V., Koyama , Y., Koyama , S., et al. 2021, title What Determines the H I Gas Content in Galaxies? Morphological Dependence of the H I Gas Fraction across the M _ * -SFR Plane , , 918, 68, 10.3847/1538-4357/abfe08
2021 doi
-
[80]
2006, title Five hundred meter aperture spherical radio telescope (FAST) , Science in China: Physics, Mechanics and Astronomy, 49, 129, 10.1007/s11433-006-0129-9
Nan , R. 2006, title Five hundred meter aperture spherical radio telescope (FAST) , Science in China: Physics, Mechanics and Astronomy, 49, 129, 10.1007/s11433-006-0129-9
2006 doi
-
[81]
2018, title First results from the IllustrisTNG simulations: the stellar mass content of groups and clusters of galaxies , , 475, 648, 10.1093/mnras/stx3112
Pillepich , A., Nelson , D., Hernquist , L., et al. 2018, title First results from the IllustrisTNG simulations: the stellar mass content of groups and clusters of galaxies , , 475, 648, 10.1093/mnras/stx3112
2018 doi
-
[82]
J., & Ostriker , J
Rees , M. J., & Ostriker , J. P. 1977, title Cooling, dynamics and fragmentation of massive gas clouds: clues to the masses and radii of galaxies and clusters. , , 179, 541, 10.1093/mnras/179.4.541
1977 doi
-
[83]
N., Catinella , B., Cortese , L., et al
Reynolds , T. N., Catinella , B., Cortese , L., et al. 2022, title WALLABY pilot survey: H I gas disc truncation and star formation of galaxies falling into the Hydra I cluster , , 510, 1716, 10.1093/mnras/stab3522
2022 doi
-
[84]
2022, title The Cold Interstellar Medium of Galaxies in the Local Universe , ARA&A, 60, 319, 10.1146/annurev-astro-021022-043545
Saintonge , A., & Catinella , B. 2022, title The Cold Interstellar Medium of Galaxies in the Local Universe , ARA&A, 60, 319, 10.1146/annurev-astro-021022-043545
2022 doi
-
[86]
J., et al
Saintonge , A., Catinella , B., Tacconi , L. J., et al. 2017, title xCOLD GASS: The Complete IRAM 30 m Legacy Survey of Molecular Gas for Galaxy Evolution Studies , , 233, 22, 10.3847/1538-4365/aa97e0
2017 doi
-
[87]
M., Simmons , B
Schawinski , K., Urry , C. M., Simmons , B. D., et al. 2014, title The green valley is a red herring: Galaxy Zoo reveals two evolutionary pathways towards quenching of star formation in early- and late-type galaxies , , 440, 889, 10.1093/mnras/stu327
2014 doi
-
[88]
2012, title The ATLAS ^ 3D project - XIII
Serra , P., Oosterloo , T., Morganti , R., et al. 2012, title The ATLAS ^ 3D project - XIII. Mass and morphology of H I in early-type galaxies as a function of environment , MNRAS, 422, 1835, 10.1111/j.1365-2966.2012.20219.x
2012
-
[89]
1977, title On the fragmentation of cosmic gas clouds
Silk , J. 1977, title On the fragmentation of cosmic gas clouds. I. The formation of galaxies and the first generation of stars. , , 211, 638, 10.1086/154972
1977 doi
-
[90]
2018, title First results from the IllustrisTNG simulations: matter and galaxy clustering , MNRAS, 475, 676, 10.1093/mnras/stx3304
Springel , V., Pakmor , R., Pillepich , A., et al. 2018, title First results from the IllustrisTNG simulations: matter and galaxy clustering , MNRAS, 475, 676, 10.1093/mnras/stx3304
2018 doi
-
[91]
M., Haynes , M
Springob , C. M., Haynes , M. P., Giovanelli , R., & Kent , B. R. 2005, title A Digital Archive of H I 21 Centimeter Line Spectra of Optically Targeted Galaxies , , 160, 149, 10.1086/431550
2005 doi
-
[92]
V., Masters , K
Stark , D. V., Masters , K. L., Avila-Reese , V., et al. 2021, title H I-MaNGA: tracing the physics of the neutral and ionized ISM with the second data release , MNRAS, 503, 1345, 10.1093/mnras/stab566
2021 doi
-
[93]
Stevens , A. R. H., Diemer , B., Lagos , C. d. P., et al. 2019, title Atomic hydrogen in IllustrisTNG galaxies: the impact of environment parallelled with local 21-cm surveys , MNRAS, 483, 5334, 10.1093/mnras/sty3451
2019 doi
-
[94]
1972, title Galactic Bridges and Tails , , 178, 623, 10.1086/151823
Toomre , A., & Toomre , J. 1972, title Galactic Bridges and Tails , , 178, 623, 10.1086/151823
1972 doi
-
[95]
A., Heckman , T
Tremonti , C. A., Heckman , T. M., Kauffmann , G., et al. 2004, title The Origin of the Mass-Metallicity Relation: Insights from 53,000 Star-forming Galaxies in the Sloan Digital Sky Survey , , 613, 898, 10.1086/423264
2004 doi
-
[96]
E., et al
Virtanen, P., Gommers, R., Oliphant, T. E., et al. 2020, title SciPy 1.0: Fundamental Algorithms for Scientific Computing in Python , Nature Methods, 17, 261, 10.1038/s41592-019-0686-2
2020 doi
-
[97]
S., Serra , P., et al
Wang , J., Koribalski , B. S., Serra , P., et al. 2016, title New lessons from the H I size-mass relation of galaxies , MNRAS, 460, 2143, 10.1093/mnras/stw1099
2016 doi
-
[98]
2014, title An observational and theoretical view of the radial distribution of H I gas in galaxies , MNRAS, 441, 2159, 10.1093/mnras/stu649
Wang , J., Fu , J., Aumer , M., et al. 2014, title An observational and theoretical view of the radial distribution of H I gas in galaxies , MNRAS, 441, 2159, 10.1093/mnras/stu649
2014 doi
-
[99]
2019, title Revisiting the clustering of narrow-line AGN in the local Universe: Joint dependence on stellar mass and colour , MNRAS, 483, 1452, 10.1093/mnras/sty3204
Wang , L., & Li , C. 2019, title Revisiting the clustering of narrow-line AGN in the local Universe: Joint dependence on stellar mass and colour , MNRAS, 483, 1452, 10.1093/mnras/sty3204
2019 doi
-
[100]
Waskom, M. L. 2021, title seaborn: statistical data visualization, Journal of Open Source Software, 6, 3021, 10.21105/joss.03021
2021 doi
-
[101]
2017, title Simulating galaxy formation with black hole driven thermal and kinetic feedback , , 465, 3291, 10.1093/mnras/stw2944
Weinberger , R., Springel , V., Hernquist , L., et al. 2017, title Simulating galaxy formation with black hole driven thermal and kinetic feedback , , 465, 3291, 10.1093/mnras/stw2944
2017 doi
-
[103]
2020, title X-CIGALE: Fitting AGN/galaxy SEDs from X-ray to infrared , , 491, 740, 10.1093/mnras/stz3001
Yang , G., Boquien , M., Buat , V., et al. 2020, title X-CIGALE: Fitting AGN/galaxy SEDs from X-ray to infrared , , 491, 740, 10.1093/mnras/stz3001
2020 doi
-
[104]
J., van den Bosch , F
Yang , X., Mo , H. J., van den Bosch , F. C., et al. 2007, title Galaxy Groups in the SDSS DR4. I. The Catalog and Basic Properties , ApJ, 671, 153, 10.1086/522027
2007 doi
-
[105]
G., Adelman , J., Anderson , Jr., J
York , D. G., Adelman , J., Anderson , Jr., J. E., et al. 2000, title The Sloan Digital Sky Survey: Technical Summary , , 120, 1579, 10.1086/301513
2000 doi
-
[106]
M., Bureau , M., Davis , T
Young , L. M., Bureau , M., Davis , T. A., et al. 2011, title The ATLAS ^ 3D project - IV. The molecular gas content of early-type galaxies , , 414, 940, 10.1111/j.1365-2966.2011.18561.x
2011
-
[107]
2024, title The FAST all sky H I survey (FASHI): The first release of catalog , Science China Physics, Mechanics, and Astronomy, 67, 219511, 10.1007/s11433-023-2219-7
Zhang , C.-P., Zhu , M., Jiang , P., et al. 2024, title The FAST all sky H I survey (FASHI): The first release of catalog , Science China Physics, Mechanics, and Astronomy, 67, 219511, 10.1007/s11433-023-2219-7
2024 doi
-
[108]
2013, title Gas depletion in cluster galaxies depends strongly on their internal structure , , 429, 2191, 10.1093/mnras/sts490
Zhang , W., Li , C., Kauffmann , G., & Xiao , T. 2013, title Gas depletion in cluster galaxies depends strongly on their internal structure , , 429, 2191, 10.1093/mnras/sts490
2013 doi
-
[109]
2009, title Estimating the HI gas fractions of galaxies in the local Universe , MNRAS, 397, 1243, 10.1111/j.1365-2966.2009.15050.x
Zhang , W., Li , C., Kauffmann , G., et al. 2009, title Estimating the HI gas fractions of galaxies in the local Universe , MNRAS, 397, 1243, 10.1111/j.1365-2966.2009.15050.x
2009
-
[110]
Zu , Y. 2020, title H I gas content of SDSS galaxies revealed by ALFALFA: implications for the mass-metallicity relation and the environmental dependence of H I in the local Universe , MNRAS, 496, 111, 10.1093/mnras/staa1457
2020 doi
Reviewed August 4, 2026 · model on record in the stance chip above.
Discussion (0). Sign in to comment.