MoveOD: Synthesizing Origin-Destination Commute Distribution from U.S. Census Data
Pith reviewed 2026-05-18 04:18 UTC · model grok-4.3
The pith
MOVEOD fuses public census and mapping data into fine-grained origin-destination commute tables for any U.S. county.
A machine-rendered reading of the paper's core claim, the machinery that carries it, and where it could break.
Core claim
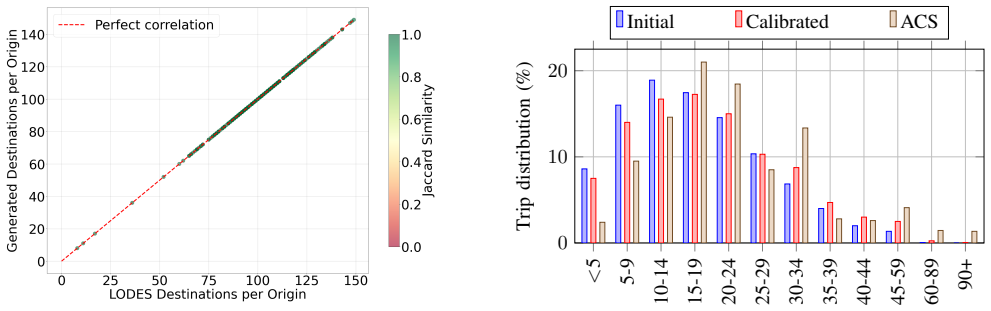
MOVEOD is an end-to-end automated system that combines ACS departure-time and travel-time distributions, LODES residence-to-workplace flows, county geometries, OSM road networks, and building footprints into a single OD dataset. Constrained sampling and integer programming reconcile the data by matching commuter totals per origin zone, aligning workplace destinations with employment distributions, and calibrating travel durations to ACS-reported commute times, yielding roughly 150,000 synthetic trips for a test county in minutes.
What carries the argument
constrained sampling and integer-programming reconciliation that forces synthetic OD flows to match aggregate commuter counts, workplace destinations, and travel durations from ACS and LODES.
If this is right
- Traffic simulation and signal optimization models can be run at county scale using the generated tables.
- Classical and learning-based vehicle-routing algorithms receive realistic inputs for benchmarking.
- Any user can produce data for a chosen county and year by supplying only that information to the open pipeline.
- The same reconciliation steps support studies of congestion pricing or routing at local resolution.
Where Pith is reading between the lines
- The pipeline logic could be adapted to other countries that release comparable census and employment statistics.
- Generated trips could be checked against mobile-phone or app-based mobility traces now becoming available.
- Adding non-work trips would let the method support full-day activity-based models rather than commute-only flows.
Load-bearing premise
Matching the reported aggregate totals for commuters, workplaces, and trip lengths produces individual trip patterns that are close enough to actual unobserved commuting behavior.
What would settle it
Comparison of the generated trip origins, destinations, departure times, and durations against a held-out household travel survey or GPS trace dataset collected inside the same county.
Figures


read the original abstract
High-resolution origin-destination (OD) tables are essential for a wide spectrum of transportation applications, from modeling traffic and signal timing optimization to congestion pricing and vehicle routing. However, outside a handful of data rich cities, such data is rarely available. We introduce MOVEOD, an open-source pipeline that synthesizes public data into commuter OD flows with fine-grained spatial and temporal departure times for any county in the United States. MOVEOD combines five open data sources: American Community Survey (ACS) departure time and travel time distributions, Longitudinal Employer-Household Dynamics (LODES) residence-to-workplace flows, county geometries, road network information from OpenStreetMap (OSM), and building footprints from OSM and Microsoft, into a single OD dataset. We use a constrained sampling and integer-programming method to reconcile the OD dataset with data from ACS and LODES. Our approach involves: (1) matching commuter totals per origin zone, (2) aligning workplace destinations with employment distributions, and (3) calibrating travel durations to ACS-reported commute times. This ensures the OD data accurately reflects commuting patterns. We demonstrate the framework on Hamilton County, Tennessee, where we generate roughly 150,000 synthetic trips in minutes, which we feed into a benchmark suite of classical and learning-based vehicle-routing algorithms. The MOVEOD pipeline is an end-to-end automated system, enabling users to easily apply it across the United States by giving only a county and a year; and it can be adapted to other countries with comparable census datasets. The source code and a lightweight browser interface are publicly available.
Editorial analysis
A structured set of objections, weighed in public.
Referee Report
Summary. The manuscript presents MOVEOD, an open-source pipeline that synthesizes high-resolution origin-destination (OD) commute distributions for any U.S. county by integrating American Community Survey (ACS) departure-time and travel-time distributions, Longitudinal Employer-Household Dynamics (LODES) residence-to-workplace flows, county geometries, OpenStreetMap (OSM) road networks, and building footprints. It applies constrained sampling followed by integer programming to reconcile origin-zone commuter totals, workplace destinations, and travel durations with the input marginals. The pipeline is demonstrated on Hamilton County, Tennessee, generating roughly 150,000 synthetic trips that are subsequently used to benchmark classical and learning-based vehicle-routing algorithms. The system is designed to require only a county and year as input and is claimed to be adaptable to other countries with comparable census data.
Significance. If the synthesized OD tables faithfully reproduce real commuting patterns beyond the enforced marginals, the work would provide a practical, reproducible resource for transportation modeling, traffic simulation, congestion pricing, and optimization in data-scarce regions. The end-to-end automation, public code release, and minimal user requirements constitute clear strengths that could enable widespread use. The approach builds on standard public datasets and constrained optimization, which is methodologically sound in principle. Significance is limited, however, by the absence of evidence that the disaggregated origin-destination-departure assignments capture higher-order structure present in actual commute behavior.
major comments (2)
- [§3] §3 (reconciliation pipeline): The constrained sampling plus integer-programming procedure is described as matching origin commuter totals, aligning LODES workplace flows, and calibrating durations to ACS travel-time distributions, yet the manuscript provides no explicit integer-program formulation, feasibility proof, or post-solution verification that the joint distribution of building-level origins, LODES destinations, and sampled departure times remains consistent with all marginals simultaneously without iterative adjustments.
- [§4] §4 (Hamilton County demonstration): Only generation runtime and downstream VRP benchmark performance are reported; no held-out validation, comparison against withheld ACS or LODES micro-data, or metrics for higher-order statistics (e.g., correlation between origin income proxy and departure time or spatial clustering of short versus long commutes) are presented, leaving the realism of the disaggregated trip patterns unverified.
minor comments (3)
- [Abstract] Abstract: The claim that the pipeline 'ensures the OD data accurately reflects commuting patterns' should be qualified to indicate that only aggregate marginals are enforced; the phrasing overstates the current empirical support.
- [Data sources] Data sources paragraph: Clarify whether 'county geometries' constitute a distinct fifth source or are derived from the ACS/LODES extracts, and specify the exact preprocessing steps applied to building footprints before sampling.
- [Availability] Code and interface: While the source code and browser interface are stated to be publicly available, the manuscript should include a permanent DOI or GitHub release tag to facilitate reproducibility.
Simulated Author's Rebuttal
We thank the referee for the constructive comments on our manuscript. We address each major comment below and outline the revisions we will make to strengthen the presentation and analysis.
read point-by-point responses
-
Referee: [§3] §3 (reconciliation pipeline): The constrained sampling plus integer-programming procedure is described as matching origin commuter totals, aligning LODES workplace flows, and calibrating durations to ACS travel-time distributions, yet the manuscript provides no explicit integer-program formulation, feasibility proof, or post-solution verification that the joint distribution of building-level origins, LODES destinations, and sampled departure times remains consistent with all marginals simultaneously without iterative adjustments.
Authors: We agree that the current description of the reconciliation procedure is high-level and lacks the explicit mathematical details requested. In the revised manuscript we will add a dedicated subsection in §3 that presents the full integer-programming formulation (objective and all constraints), a brief feasibility argument based on the consistency of the input marginals, and post-solution verification steps (including constraint satisfaction checks and a description of the single-pass procedure that avoids iterative adjustments). These additions will make the method fully reproducible from the text. revision: yes
-
Referee: [§4] §4 (Hamilton County demonstration): Only generation runtime and downstream VRP benchmark performance are reported; no held-out validation, comparison against withheld ACS or LODES micro-data, or metrics for higher-order statistics (e.g., correlation between origin income proxy and departure time or spatial clustering of short versus long commutes) are presented, leaving the realism of the disaggregated trip patterns unverified.
Authors: The referee correctly observes that the demonstration section emphasizes runtime and the VRP use case. Because fine-grained building-level ground-truth OD data with departure times are not publicly available, a true held-out micro-data validation is not possible. In the revision we will add (i) quantitative checks of selected higher-order statistics against available ACS aggregates (e.g., income-by-departure-time correlations and commute-distance distributions) and (ii) an explicit limitations paragraph discussing what aspects of realism cannot be verified with public data. We believe these additions will address the core concern while remaining honest about data limitations. revision: partial
Circularity Check
No significant circularity; pipeline reconciles external aggregates via standard optimization
full rationale
The described MOVEOD method ingests independent public datasets (ACS departure-time and travel-time distributions, LODES residence-to-workplace flows, OSM networks, and building footprints) and applies constrained sampling plus integer programming to enforce matching on commuter totals, workplace destinations, and duration distributions. No equation or procedure in the provided text defines a target quantity in terms of a parameter fitted from the same run, nor does any load-bearing step reduce to a self-citation or internal renaming. The derivation remains self-contained against the external census benchmarks it explicitly reconciles.
Axiom & Free-Parameter Ledger
axioms (2)
- domain assumption ACS departure-time and travel-time distributions are accurate marginals for the target county and year.
- domain assumption LODES residence-to-workplace flows provide reliable origin-destination marginals at the zone level.
Lean theorems connected to this paper
-
IndisputableMonolith/Foundation/RealityFromDistinction.leanreality_from_one_distinction unclear?
unclearRelation between the paper passage and the cited Recognition theorem.
We use a constrained sampling and integer-programming method to reconcile the OD dataset with data from ACS and LODES.
-
IndisputableMonolith/Cost/FunctionalEquation.leanwashburn_uniqueness_aczel unclear?
unclearRelation between the paper passage and the cited Recognition theorem.
MOVEOD combines five open data sources... into a single OD dataset.
What do these tags mean?
- matches
- The paper's claim is directly supported by a theorem in the formal canon.
- supports
- The theorem supports part of the paper's argument, but the paper may add assumptions or extra steps.
- extends
- The paper goes beyond the formal theorem; the theorem is a base layer rather than the whole result.
- uses
- The paper appears to rely on the theorem as machinery.
- contradicts
- The paper's claim conflicts with a theorem or certificate in the canon.
- unclear
- Pith found a possible connection, but the passage is too broad, indirect, or ambiguous to say the theorem truly supports the claim.
Reference graph
Works this paper leans on
-
[1]
J. M. Abowd, J. Haltiwanger, and J. Lane. Integrated longitudinal employer-employee data for the united states.American Economic Review, 94(2):224–229, 2004
work page 2004
-
[2]
J. Alonso-Mora, S. Samaranayake, A. Wallar, E. Frazzoli, and D. Rus. On-demand high-capacity ride-sharing via dynamic trip-vehicle assign- ment.Proceedings of the National Academy of Sciences, 114(3):462– 467, 2017
work page 2017
-
[3]
B. M. Baker and M. Ayechew. A genetic algorithm for the vehicle routing problem.Computers & Operations Research, 30(5):787–800, 2003
work page 2003
-
[4]
E. Cipriani, S. Gori, and M. Petrelli. Transit network design: A procedure and an application to a large urban area.Transportation Research Part C: Emerging Technologies, 20(1):3–14, 2012
work page 2012
-
[5]
F. Crawford, D. P. Watling, and R. D. Connors. Identifying road user classes based on repeated trip behaviour using bluetooth data. Transportation Research Part A: Policy and Practice, 113:55–74, 2018
work page 2018
-
[6]
Z. J. Czech and P. Czarnas. Parallel simulated annealing for the vehicle routing problem with time windows. In10th Euromicro Workshop on Parallel, Distributed and Network-based Processing, pages 376–383. IEEE, 2002
work page 2002
-
[7]
F. F. Dias, P. S. Lavieri, T. Kim, C. R. Bhat, and R. M. Pendyala. Fusing multiple sources of data to understand ride-hailing use.Transportation Research Record, 2673(6):214–224, 2019
work page 2019
-
[8]
W. Du, J. Ye, J. Gu, J. Li, H. Wei, and G. Wang. Safelight: A rein- forcement learning method toward collision-free traffic signal control. InAAAI Conference on Artificial Intelligence, volume 37, pages 14801– 14810, 2023
work page 2023
- [9]
-
[10]
B. Eksioglu, A. V . Vural, and A. Reisman. The vehicle routing problem: A taxonomic review.Computers & Industrial Engineering, 57(4):1472– 1483, 2009
work page 2009
-
[11]
N. Ferreira, J. Poco, H. T. V o, J. Freire, and C. T. Silva. Visual exploration of big spatio-temporal urban data: A study of new york city taxi trips.IEEE Transactions on Visualization and Computer Graphics, 19(12):2149–2158, 2013
work page 2013
-
[12]
V . Guihaire and J.-K. Hao. Transit network design and scheduling: A global review.Transportation Research Part A: Policy and Practice, 42(10):1251–1273, 2008
work page 2008
-
[13]
D. Guo, X. Zhu, H. Jin, P. Gao, and C. Andris. Discovering spatial patterns in origin-destination mobility data.Transactions in GIS, 16(3):411–429, 2012
work page 2012
- [14]
-
[15]
M. P. Heris, N. L. Foks, K. J. Bagstad, A. Troy, and Z. H. Ancona. A rasterized building footprint dataset for the united states.Scientific Data, 7(1):207, 2020
work page 2020
- [16]
- [17]
-
[18]
R. Jiang, D. Yin, Z. Wang, Y . Wang, J. Deng, H. Liu, Z. Cai, J. Deng, X. Song, and R. Shibasaki. Dl-traff: Survey and benchmark of deep learning models for urban traffic prediction. In30th ACM International Conference on Information & Knowledge Management (CIKM), pages 4515–4525, 2021
work page 2021
-
[19]
T. Kashiyama, Y . Pang, and Y . Sekimoto. Open pflow: Creation and evaluation of an open dataset for typical people mass movement in urban areas.Transportation Research Part C: Emerging Technologies, 85:249– 267, 2017
work page 2017
-
[20]
Kitchin.The data revolution: Big data, open data, data infrastruc- tures and their consequences
R. Kitchin.The data revolution: Big data, open data, data infrastruc- tures and their consequences. Sage, 2014
work page 2014
-
[21]
W. Kool, H. van Hoof, and M. Welling. Attention, learn to solve routing problems! In7th International Conference on Learning Representations (ICLR), 2019
work page 2019
-
[22]
Y .-D. Kwon, J. Choo, B. Kim, I. Yoon, Y . Gwon, and S. Min. Pomo: Policy optimization with multiple optima for reinforcement learning. Advances in Neural Information Processing Systems, 33, 2020
work page 2020
-
[23]
Q. Li, Z. M. Peng, L. Feng, Z. Liu, C. Duan, W. Mo, and B. Zhou. Sce- narionet: Open-source platform for large-scale traffic scenario simulation and modeling.Advances in Neural Information Processing Systems, 36:3894–3920, 2023
work page 2023
-
[24]
S. Li, Z. Yan, and C. Wu. Learning to delegate for large-scale vehicle routing.Advances in Neural Information Processing Systems (NeurIPS), 34:26198–26211, 2021
work page 2021
-
[25]
Y . Li, R. Yu, C. Shahabi, and Y . Liu. Diffusion convolutional re- current neural network: Data-driven traffic forecasting.arXiv preprint arXiv:1707.01926, 2017
work page internal anchor Pith review Pith/arXiv arXiv 2017
-
[26]
X. Liu, Y . Xia, Y . Liang, J. Hu, Y . Wang, L. Bai, C. Huang, Z. Liu, B. Hooi, and R. Zimmermann. Largest: A benchmark dataset for large- scale traffic forecasting. InAdvances in Neural Information Processing Systems, 2023
work page 2023
-
[27]
S. Liyanage and H. Dia. An agent-based simulation approach for evaluating the performance of on-demand bus services.Sustainability, 12(10):4117, 2020
work page 2020
-
[28]
M. Mohammed and J. Oke. Origin-destination inference in public transportation systems: A comprehensive review.International Journal of Transportation Science and Technology, 12(1):315–328, 2023
work page 2023
- [29]
-
[30]
The National Academies Press, Washington, DC, 2007
National Research Council and National Academies of Sciences, Engi- neering, and Medicine.Using the American Community Survey: Benefits and Challenges. The National Academies Press, Washington, DC, 2007
work page 2007
-
[31]
S. Peer, J. Knockaert, P. Koster, and E. T. Verhoef. Over-reporting vs. overreacting: Commuters’ perceptions of travel times.Transportation Research Part A: Policy and Practice, 69:476–494, 2014
work page 2014
-
[32]
D. Perlman, K. Tufte, L. Flint, and T. Reel. Emerging data science for transit: Market scan and feasibility analysis. Technical Report FTA Report No. 0218, U.S. Department of Transportation, Federal Transit Administration, Washington, D.C., June 2022. Prepared by the John A. V olpe National Transportation Systems Center
work page 2022
-
[33]
T. Pichpibul and R. Kawtummachai. A heuristic approach based on clarke-wright algorithm for open vehicle routing problem.Scientific World Journal, 2013(1):874349, 2013
work page 2013
-
[34]
M. Randall, A. Kheiri, and A. N. Letchford. Insertion heuristics for a class of dynamic vehicle routing problems, 2022
work page 2022
-
[35]
A. E. Rizzoli, R. Montemanni, E. Lucibello, and L. M. Gambardella. Ant colony optimization for real-world vehicle routing problems: from theory to applications.Swarm Intelligence, 1:135–151, 2007
work page 2007
-
[36]
R. Sen, T. Tran, S. Khaleghian, P. Pugliese, M. Sartipi, H. Neema, and A. Dubey. Bte-sim: Fast simulation environment for public transporta- tion. In2022 IEEE International Conference on Big Data (Big Data), pages 2886–2894, 2022
work page 2022
-
[37]
P. R. Stopher and S. P. Greaves. Household travel surveys: Where are we going?Transportation Research Part A: Policy and Practice, 41(5):367– 381, 2007
work page 2007
-
[38]
P. Thakuriah, N. Y . Tilahun, and M. Zellner.Introduction to seeing cities through big data: Research, methods and applications in urban informatics. Springer, 2017
work page 2017
-
[39]
P. Toth and D. Vigo.Vehicle routing: problems, methods, and applica- tions. SIAM, 2014
work page 2014
-
[40]
Longitudinal Employer-Household Dy- namics - Origin-Destination Employment Statistics, 2017
United States Census Bureau. Longitudinal Employer-Household Dy- namics - Origin-Destination Employment Statistics, 2017
work page 2017
- [41]
-
[42]
W. Wang, W. Jiang, B. Zhang, Q. Zhu, and C. Liao. A real network environment dataset for traffic analysis.Scientific Data, 12(1):1–12, 2025
work page 2025
-
[43]
B. Xu, Y . Wang, Z. Wang, H. Jia, and Z. Lu. Hierarchically and cooperatively learning traffic signal control. InAAAI Conference on Artificial Intelligence, volume 35, pages 669–677, 2021
work page 2021
-
[44]
X. Xu, Z. Zheng, Z. Hu, K. Feng, and W. Ma. A unified dataset for the city-scale traffic assignment model in 20 us cities.Scientific Data, 11(1):325, 2024
work page 2024
discussion (0)
Sign in with ORCID, Apple, or X to comment. Anyone can read and Pith papers without signing in.