Feature Extraction in the Remote Sensing Data Value Chain: A Systematic Review of Methods and Applications
Pith reviewed 2026-05-18 04:41 UTC · model grok-4.3
The pith
A framework for feature extraction traces its evolution in remote sensing from task-specific tools to unified representations that support multiple applications.
A machine-rendered reading of the paper's core claim, the machinery that carries it, and where it could break.
Core claim
The paper establishes a framework that classifies feature extraction techniques according to their position and role in the remote sensing data value chain. Using this structure, it documents the historical shift from single-task, often hand-crafted methods to unified, multi-purpose representations. In the foundation-model setting, the work concludes that future progress requires both stronger robustness and interpretability in extracted features and deliberate efforts to combine classical extraction approaches with modern representation learning.
What carries the argument
A proposed framework that organizes feature extraction methods by their stage and function within the remote sensing data value chain, enabling comparison across classical and modern techniques.
If this is right
- Unified representations reduce feature redundancy and lower the computational cost of analyzing high-dimensional satellite and aerial data.
- Robust and interpretable feature extraction becomes a required property for foundation models applied to environmental monitoring and disaster response.
- Bridging classical extraction methods with learned representations can preserve domain knowledge while scaling to larger datasets.
- The data-value-chain view helps practitioners choose extraction techniques that match the specific stage and goal of their remote-sensing pipeline.
- Future work should test whether hybrid classical-modern features improve performance on downstream tasks such as land-cover classification and change detection.
Where Pith is reading between the lines
- The framework could be extended to quantify how much interpretability is gained or lost when moving from classical to deep-learned features.
- Applying the same value-chain lens to non-remote-sensing domains such as medical imaging might reveal similar shifts toward unified representations.
- Developers of new foundation models for Earth observation could use the framework to decide where to insert explicit feature-extraction modules rather than relying solely on end-to-end learning.
- Empirical tests could measure whether models built on the proposed unified representations actually reduce the need for task-specific retraining across different remote-sensing applications.
Load-bearing premise
The review assumes that the collection of papers surveyed is broad enough and representative enough to reveal the true trends in how feature extraction has developed.
What would settle it
Discovery of a large, coherent body of recent remote-sensing literature on feature extraction that falls outside the proposed framework or that shows no movement toward unified representations.
Figures


read the original abstract
Earth observation involves collecting, analyzing, and processing an ever-growing mass of data. This planetary data is crucial for addressing relevant societal, economic, and environmental challenges, ranging from environmental monitoring to urban planning and disaster management. However, its high dimensionality entails significant feature redundancy and computational overhead, limiting the effectiveness of machine learning models. Feature extraction (FE) techniques address these challenges by preserving essential data properties while reducing redundancy and enhancing tasks in Remote Sensing (RS). The landscape of FE for RS is diverse, disorganized, and rapidly evolving. We offer a practical guide for this landscape by introducing a framework of FE. Using this framework, we trace the evolution of FE across the data value chain in RS. Finally, we synthesize these trends and offer perspectives for the future of FE in RS by first characterizing this shift from single-task models to unified representations, then identifying two perspectives in the foundation model era: the need for robust and interpretable FE and the potential of bridging classical FE with modern representation learning.
Editorial analysis
A structured set of objections, weighed in public.
Referee Report
Summary. The paper presents a systematic review of feature extraction (FE) techniques in remote sensing (RS). It introduces a framework for organizing FE methods, traces their evolution across the RS data value chain, characterizes a shift from single-task models to unified representations, and synthesizes two perspectives for the foundation-model era: the need for robust and interpretable FE and the potential to bridge classical FE with modern representation learning.
Significance. If the literature base is representative, the work offers a practical organizing framework and forward-looking synthesis for a rapidly evolving subfield, potentially helping researchers connect classical dimensionality-reduction techniques with foundation-model representations in Earth-observation applications.
major comments (2)
- [Methods] Methods section: the literature-selection protocol (search strings, databases, time window, inclusion/exclusion criteria, and handling of 2023–2024 foundation-model papers) is not described with sufficient specificity or accompanied by a PRISMA-style flow diagram. Because the central claims about evolutionary trends and the two foundation-model perspectives rest on the representativeness of the surveyed corpus, this omission is load-bearing for the synthesis.
- [Framework definition] Framework introduction (early sections): the proposed FE framework is presented as a practical guide, yet the manuscript does not explicitly compare it against prior taxonomies in RS (e.g., those based on spectral, spatial, or deep-feature categories) or demonstrate how the new framework adds non-redundant structure. This weakens the justification for using it to trace the claimed single-task-to-unified shift.
minor comments (2)
- [Abstract and Introduction] Several long sentences in the abstract and introduction could be split to improve readability.
- [Figures] Figure captions should explicitly state the data sources or example images used so readers can assess representativeness.
Simulated Author's Rebuttal
We sincerely thank the referee for the constructive and detailed feedback on our systematic review. We address each major comment below and describe the revisions we will implement to strengthen the manuscript.
read point-by-point responses
-
Referee: [Methods] Methods section: the literature-selection protocol (search strings, databases, time window, inclusion/exclusion criteria, and handling of 2023–2024 foundation-model papers) is not described with sufficient specificity or accompanied by a PRISMA-style flow diagram. Because the central claims about evolutionary trends and the two foundation-model perspectives rest on the representativeness of the surveyed corpus, this omission is load-bearing for the synthesis.
Authors: We agree that greater specificity is required for a systematic review. The current manuscript outlines the overall search approach at a high level but does not provide the granular protocol details requested. In the revised manuscript we will expand the Methods section with: (i) the precise search strings used (combinations of terms such as “feature extraction” AND (“remote sensing” OR “Earth observation”) together with keywords for classical and deep-learning methods); (ii) the databases queried (Scopus, Web of Science, IEEE Xplore, arXiv, and Google Scholar); (iii) the time window (2010–2024, with explicit handling of the 2023–2024 foundation-model surge via targeted supplementary searches); (iv) clear inclusion/exclusion criteria; and (v) a PRISMA-style flow diagram documenting the screening and selection process. These additions will directly substantiate the representativeness of the corpus and thereby support the evolutionary-trend and foundation-model-perspective claims. revision: yes
-
Referee: [Framework definition] Framework introduction (early sections): the proposed FE framework is presented as a practical guide, yet the manuscript does not explicitly compare it against prior taxonomies in RS (e.g., those based on spectral, spatial, or deep-feature categories) or demonstrate how the new framework adds non-redundant structure. This weakens the justification for using it to trace the claimed single-task-to-unified shift.
Authors: We acknowledge that an explicit side-by-side comparison with established taxonomies would strengthen the justification. While the framework’s primary contribution lies in situating feature extraction within the RS data value chain and in highlighting the transition toward unified representations, the manuscript does not currently include a dedicated comparison subsection. In the revision we will add a concise comparison (text plus table) in the framework-introduction section that contrasts our value-chain-oriented organization against prior spectral/spatial, handcrafted/learned, and deep-feature taxonomies. This addition will clarify the non-redundant elements—particularly the explicit linkage to downstream tasks and the synthesis toward foundation models—thereby reinforcing the rationale for employing the framework to trace the single-task-to-unified shift. revision: yes
Circularity Check
No significant circularity in this literature review synthesis
full rationale
This paper is a systematic review that synthesizes existing literature on feature extraction methods in remote sensing. It introduces a conceptual framework and traces evolutionary trends across the data value chain solely by surveying and organizing published work, without any mathematical derivations, equations, fitted parameters, or predictions that could reduce to the paper's own inputs by construction. No self-citation chains, ansatzes, or uniqueness theorems are invoked as load-bearing elements for new results. The central claims rest on the external literature base rather than internal self-reference, rendering the synthesis self-contained with no circular steps.
Axiom & Free-Parameter Ledger
Lean theorems connected to this paper
-
IndisputableMonolith/Cost/FunctionalEquation.leanwashburn_uniqueness_aczel unclear?
unclearRelation between the paper passage and the cited Recognition theorem.
We propose a framework for classifying popular DR methods used in RS... dataset... mapping... constraints and property preservation (reconstruction, variance, distribution, geometry, topology)
-
IndisputableMonolith/Foundation/RealityFromDistinction.leanreality_from_one_distinction unclear?
unclearRelation between the paper passage and the cited Recognition theorem.
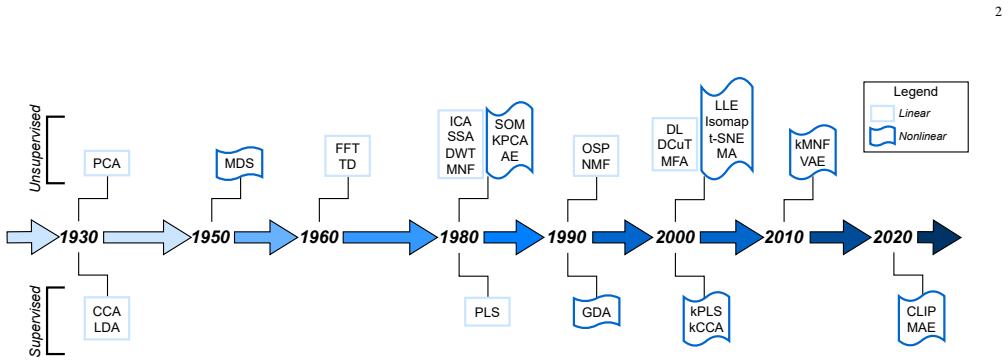
DR for feature extraction began with linear multivariate analysis methods like Principal Component Analysis (PCA) ... manifold learning boom ... deep learning DR methods, like the variational autoencoder
What do these tags mean?
- matches
- The paper's claim is directly supported by a theorem in the formal canon.
- supports
- The theorem supports part of the paper's argument, but the paper may add assumptions or extra steps.
- extends
- The paper goes beyond the formal theorem; the theorem is a base layer rather than the whole result.
- uses
- The paper appears to rely on the theorem as machinery.
- contradicts
- The paper's claim conflicts with a theorem or certificate in the canon.
- unclear
- Pith found a possible connection, but the passage is too broad, indirect, or ambiguous to say the theorem truly supports the claim.
Reference graph
Works this paper leans on
-
[1]
Deep learning and process understand- ing for data-driven Earth system science,
M. Reichstein, G. Camps-Valls, B. Stevens, M. Jung, J. Denzler, N. Carvalhais, and F. Prabhat, “Deep learning and process understand- ing for data-driven Earth system science,”Nature, vol. 566, no. 7743, pp. 195–204, 2019
work page 2019
-
[2]
A review of remote sensing for environmental monitoring in China,
J. Li, Y . Pei, S. Zhao, R. Xiao, X. Sang, and C. Zhang, “A review of remote sensing for environmental monitoring in China,”Remote Sensing, vol. 12, no. 7, p. 1130, 2020
work page 2020
-
[3]
P. K. Kingra, D. Majumder, and S. P. Singh, “Application of remote sensing and GIS in agriculture and natural resource management under changing climatic conditions.”Agricultural Research Journal, vol. 53, no. 3, 2016
work page 2016
-
[4]
Remote sensing in urban planning: Contributions towards ecologically sound policies?
T. Wellmann, A. Lausch, E. Andersson, S. Knapp, C. Cortinovis, J. Jache, S. Scheuer, P. Kremer, A. Mascarenhas, R. Kraemeret al., “Remote sensing in urban planning: Contributions towards ecologically sound policies?”Landscape and urban planning, vol. 204, p. 103921, 2020
work page 2020
-
[5]
Remote sensing for agricultural applications: A meta-review,
M. Weiss, F. Jacob, and G. Duveiller, “Remote sensing for agricultural applications: A meta-review,”Remote sensing of environment, vol. 236, p. 111402, 2020
work page 2020
-
[6]
Remote sensing for natural disaster management,
C. Van Westen, “Remote sensing for natural disaster management,” International archives of photogrammetry and remote sensing, vol. 33, no. B7/4; PART 7, pp. 1609–1617, 2000
work page 2000
-
[7]
Sentinels optical communications payload (ocp) operations: From test to in-flight experience,
I. Shurmer, F. Marchese, J.-M. Morales-Santiago, and P. P. Emanuelli, “Sentinels optical communications payload (ocp) operations: From test to in-flight experience,” in2018 SpaceOps Conference, 2018, p. 2654
work page 2018
-
[8]
S. J. Goodman, “GOES-R series introduction,” inThe GOES-R Series. Elsevier, 2020, pp. 1–3
work page 2020
-
[9]
The curse(s) of dimensionality,
N. Altman and M. Krzywinski, “The curse(s) of dimensionality,” Nature Methods, vol. 15, no. 6, pp. 399–400, 2018
work page 2018
-
[10]
Analysis of a complex of statistical variables into principal components
H. Hotelling, “Analysis of a complex of statistical variables into principal components.”Journal of educational psychology, vol. 24, no. 6, p. 417, 1933
work page 1933
-
[11]
Passive remote sensing techniques for mapping water depth and bottom features,
D. R. Lyzenga, “Passive remote sensing techniques for mapping water depth and bottom features,”Applied optics, vol. 17, no. 3, pp. 379–383, 1978
work page 1978
-
[12]
Kernel principal com- ponent analysis,
B. Schölkopf, A. Smola, and K.-R. Müller, “Kernel principal com- ponent analysis,” inInternational conference on artificial neural net- works. Springer, 1997, pp. 583–588
work page 1997
-
[13]
G. Camps-Valls and L. Bruzzone,Kernel methods for remote sensing data analysis. John Wiley & Sons, 2009
work page 2009
-
[14]
Auto-Encoding Variational Bayes
D. P. Kingma and M. Welling, “Auto-encoding variational bayes,”arXiv preprint arXiv:1312.6114, 2013
work page internal anchor Pith review Pith/arXiv arXiv 2013
-
[15]
Deep learning in remote sensing: A comprehensive review and list of resources,
X. X. Zhu, D. Tuia, L. Mou, G.-S. Xia, L. Zhang, F. Xu, and F. Fraundorfer, “Deep learning in remote sensing: A comprehensive review and list of resources,”IEEE Geoscience and Remote Sensing Magazine, vol. 5, no. 4, pp. 8–36, 2017
work page 2017
-
[16]
Comprehensive review of hyperspectral image compression algorithms,
Y . Dua, V . Kumar, and R. S. Singh, “Comprehensive review of hyperspectral image compression algorithms,”Optical Engineering, vol. 59, no. 9, pp. 090 902–090 902, 2020
work page 2020
-
[17]
Image restoration for remote sensing: Overview and toolbox,
B. Rasti, Y . Chang, E. Dalsasso, L. Denis, and P. Ghamisi, “Image restoration for remote sensing: Overview and toolbox,”IEEE Geo- science and Remote Sensing Magazine, vol. 10, no. 2, pp. 201–230, 2021
work page 2021
-
[18]
Deep learning in multimodal remote sensing data fusion: A compre- hensive review,
J. Li, D. Hong, L. Gao, J. Yao, K. Zheng, B. Zhang, and J. Chanussot, “Deep learning in multimodal remote sensing data fusion: A compre- hensive review,”International Journal of Applied Earth Observation and Geoinformation, vol. 112, p. 102926, 2022
work page 2022
-
[19]
Big data for remote sensing: Visualization, analysis and interpretation,
N. Dey, C. Bhatt, and A. S. Ashour, “Big data for remote sensing: Visualization, analysis and interpretation,”Cham: Springer, vol. 104, 2018
work page 2018
-
[20]
Hyperspectral anomaly detection using deep learning: A review,
X. Hu, C. Xie, Z. Fan, Q. Duan, D. Zhang, L. Jiang, X. Wei, D. Hong, G. Li, X. Zenget al., “Hyperspectral anomaly detection using deep learning: A review,”Remote Sensing, vol. 14, no. 9, p. 1973, 2022
work page 1973
-
[21]
Implementation of machine-learning classification in remote sensing: An applied review,
A. E. Maxwell, T. A. Warner, and F. Fang, “Implementation of machine-learning classification in remote sensing: An applied review,” International journal of remote sensing, vol. 39, no. 9, pp. 2784–2817, 2018
work page 2018
-
[22]
B. Rasti, D. Hong, R. Hang, P. Ghamisi, X. Kang, J. Chanussot, and J. A. Benediktsson, “Feature extraction for hyperspectral imagery: The evolution from shallow to deep: Overview and toolbox,”IEEE Geoscience and Remote Sensing Magazine, vol. 8, no. 4, pp. 60–88, 2020
work page 2020
-
[23]
Low- rank and sparse representation for hyperspectral image processing: A review,
J. Peng, W. Sun, H.-C. Li, W. Li, X. Meng, C. Ge, and Q. Du, “Low- rank and sparse representation for hyperspectral image processing: A review,”IEEE Geoscience and Remote Sensing Magazine, vol. 10, no. 1, pp. 10–43, 2022
work page 2022
-
[24]
Tensor decompositions for hyperspectral data processing in remote sensing: A comprehensive review,
M. Wang, D. Hong, Z. Han, J. Li, J. Yao, L. Gao, B. Zhang, and J. Chanussot, “Tensor decompositions for hyperspectral data processing in remote sensing: A comprehensive review,”IEEE Geoscience and Remote Sensing Magazine, vol. 11, no. 1, pp. 26–72, 2023
work page 2023
-
[25]
Advanced feature extraction for Earth observation data processing,
E. Izquierdo-Verdiguier, V . Laparra, J. M. Marí, L. G. Chova, and G. Camps-Valls, “Advanced feature extraction for Earth observation data processing,” inComprehensive remote sensing, volume 2: data processing and analysis methodology. Elsevier, 2017, pp. 108–133
work page 2017
-
[26]
Dimensionality reduction: A comparative review,
L. Van Der Maaten, E. O. Postma, H. J. Van Den Heriket al., “Dimensionality reduction: A comparative review,”Journal of machine learning research, vol. 10, no. 66-71, p. 13, 2009
work page 2009
-
[27]
J. A. Lee and M. Verleysen,Nonlinear dimensionality reduction. Springer Science & Business Media, 2007
work page 2007
-
[28]
Review of dimension reduction methods,
S. Nanga, A. T. Bawah, B. A. Acquaye, M.-I. Billa, F. D. Baeta, N. A. Odai, S. K. Obeng, and A. D. Nsiah, “Review of dimension reduction methods,”Journal of Data Analysis and Information Processing, vol. 9, no. 3, pp. 189–231, 2021
work page 2021
-
[29]
A short survey of hyperspectral remote sensing applications in agri- culture,
M. Teke, H. S. Deveci, O. Halilo ˘glu, S. Z. Gürbüz, and U. Sakarya, “A short survey of hyperspectral remote sensing applications in agri- culture,” in2013 6th international conference on recent advances in space technologies (RAST). IEEE, 2013, pp. 171–176
work page 2013
-
[30]
D. Bank, N. Koenigstein, and R. Giryes, “Autoencoders,”Machine Learning for Data Science Handbook: Data Mining and Knowledge Discovery Handbook, pp. 353–374, 2023
work page 2023
-
[31]
A survey on canonical correlation analysis,
X. Yang, W. Liu, W. Liu, and D. Tao, “A survey on canonical correlation analysis,”IEEE Transactions on Knowledge and Data Engineering, vol. 33, no. 6, pp. 2349–2368, 2019
work page 2019
-
[32]
Learning transferable visual models from natural language supervision,
A. Radford, J. W. Kim, C. Hallacy, A. Ramesh, G. Goh, S. Agarwal, G. Sastry, A. Askell, P. Mishkin, J. Clarket al., “Learning transferable visual models from natural language supervision,” inInternational conference on machine learning. PMLR, 2021, pp. 8748–8763
work page 2021
-
[33]
E. J. Candes, D. L. Donohoet al.,Curvelets: A surprisingly effective nonadaptive representation for objects with edges. Department of Statistics, Stanford University Stanford, CA, USA, 1999
work page 1999
-
[34]
Fast Fourier transforms: A tutorial review and a state of the art,
P. Duhamel and M. Vetterli, “Fast Fourier transforms: A tutorial review and a state of the art,”Signal processing, vol. 19, no. 4, pp. 259–299, 1990
work page 1990
-
[35]
Dictionary learning algorithms for sparse representa- tion,
K. Kreutz-Delgado, J. F. Murray, B. D. Rao, K. Engan, T.-W. Lee, and T. J. Sejnowski, “Dictionary learning algorithms for sparse representa- tion,”Neural computation, vol. 15, no. 2, pp. 349–396, 2003
work page 2003
-
[36]
S. A. Broughton and K. Bryan,Discrete Fourier analysis and wavelets: applications to signal and image processing. John Wiley & Sons, 2018
work page 2018
-
[37]
Empirical Orthogo- nal Functions and related techniques in atmospheric science: A review,
A. Hannachi, I. T. Jolliffe, and D. B. Stephenson, “Empirical Orthogo- nal Functions and related techniques in atmospheric science: A review,” International Journal of Climatology, vol. 27, no. 9, pp. 1119–1152, 2007
work page 2007
-
[38]
Generalized discriminant analysis using a kernel approach,
G. Baudat and F. Anouar, “Generalized discriminant analysis using a kernel approach,”Neural computation, vol. 12, no. 10, pp. 2385–2404, 2000
work page 2000
-
[39]
Blind separation of sources, part i: An adap- tive algorithm based on neuromimetic architecture,
C. Jutten and J. Herault, “Blind separation of sources, part i: An adap- tive algorithm based on neuromimetic architecture,”Signal processing, vol. 24, no. 1, pp. 1–10, 1991
work page 1991
-
[40]
The isomap algorithm and topological stability,
M. Balasubramanian and E. L. Schwartz, “The isomap algorithm and topological stability,”Science, vol. 295, no. 5552, pp. 7–7, 2002
work page 2002
-
[41]
A kernel method for canonical correlation analysis
S. Akaho, “A kernel method for canonical correlation analysis,”arXiv preprint cs/0609071, 2006
work page internal anchor Pith review Pith/arXiv arXiv 2006
-
[42]
Kernel maximum autocorrelation factor and minimum noise fraction transformations,
A. A. Nielsen, “Kernel maximum autocorrelation factor and minimum noise fraction transformations,”IEEE Transactions on Image Process- ing, vol. 20, no. 3, pp. 612–624, 2010
work page 2010
-
[43]
Kernel partial least squares regression in reproducing kernel Hilbert space,
R. Rosipal and L. J. Trejo, “Kernel partial least squares regression in reproducing kernel Hilbert space,”Journal of Machine Learning Research, vol. 2, no. Dec, pp. 97–123, 2001
work page 2001
-
[44]
Classification of hyperspectral images with regularized linear discriminant analysis,
T. V . Bandos, L. Bruzzone, and G. Camps-Valls, “Classification of hyperspectral images with regularized linear discriminant analysis,” IEEE Transactions on Geoscience and Remote Sensing, vol. 47, no. 3, pp. 862–873, 2009
work page 2009
-
[45]
An introduction to locally linear embedding,
L. K. Saul and S. T. Roweis, “An introduction to locally linear embedding,”unpublished. Available at: http://www. cs. toronto. edu/˜ roweis/lle/publications. html, 2000
work page 2000
-
[46]
Semisupervised alignment of manifolds,
J. Ham, D. Lee, and L. Saul, “Semisupervised alignment of manifolds,” inInternational Workshop on Artificial Intelligence and Statistics. PMLR, 2005, pp. 120–127. 21
work page 2005
-
[47]
Prithvi-eo-2.0: A versatile multi-temporal foundation model for Earth observation applications,
D. Szwarcman, S. Roy, P. Fraccaro, Þ. E. Gíslason, B. Blumenstiel, R. Ghosal, P. H. de Oliveira, J. L. de Sousa Almeida, R. Sedona, Y . Kang, S. Chakraborty, S. Wang, C. Gomes, A. Kumar, M. Truong, D. Godwin, H. Lee, C.-Y . Hsu, A. A. Asanjan, B. Mujeci, D. Shidham, T. Keenan, P. Arevalo, W. Li, H. Alemohammad, P. Olofsson, C. Hain, R. Kennedy, B. Zadrozn...
-
[48]
Romain Thoreau, Laurent Risser, Véronique Achard, Béatrice Berthelot, and Xavier Briottet
[Online]. Available: https://arxiv.org/abs/2412.02732
-
[49]
A survey on multidimensional scaling,
N. Saeed, H. Nam, M. I. U. Haq, and D. B. Muhammad Saqib, “A survey on multidimensional scaling,”ACM Computing Surveys (CSUR), vol. 51, no. 3, pp. 1–25, 2018
work page 2018
-
[50]
Graph embedding and extensions: A general framework for dimensionality reduction,
S. Yan, D. Xu, B. Zhang, H.-J. Zhang, Q. Yang, and S. Lin, “Graph embedding and extensions: A general framework for dimensionality reduction,”IEEE Transactions on Pattern Analysis and Machine Intel- ligence, vol. 29, no. 1, pp. 40–51, 2006
work page 2006
-
[51]
A. A. Green, M. Berman, P. Switzer, and M. D. Craig, “A transfor- mation for ordering multispectral data in terms of image quality with implications for noise removal,”IEEE Transactions on Geoscience and Remote Sensing, vol. 26, no. 1, pp. 65–74, 1988
work page 1988
-
[52]
J. Kang, R. Fernandez-Beltran, P. Duan, S. Liu, and A. J. Plaza, “Deep unsupervised embedding for remotely sensed images based on spatially augmented momentum contrast,”IEEE Transactions on Geoscience and Remote Sensing, vol. 59, no. 3, pp. 2598–2610, 2021
work page 2021
-
[53]
Nonnegative matrix factorization: A comprehensive review,
Y .-X. Wang and Y .-J. Zhang, “Nonnegative matrix factorization: A comprehensive review,”IEEE Transactions on knowledge and data engineering, vol. 25, no. 6, pp. 1336–1353, 2012
work page 2012
-
[55]
A beginner’s guide to partial least squares analysis,
M. Haenlein and A. M. Kaplan, “A beginner’s guide to partial least squares analysis,”Understanding statistics, vol. 3, no. 4, pp. 283–297, 2004
work page 2004
-
[56]
An introduction to the proper orthogonal decomposi- tion,
A. Chatterjee, “An introduction to the proper orthogonal decomposi- tion,”Current science, pp. 808–817, 2000
work page 2000
-
[57]
T. Kohonen, “The self-organizing map,”Proceedings of the IEEE, vol. 78, no. 9, pp. 1464–1480, 1990
work page 1990
-
[58]
Singular spectrum analysis in nonlinear dynamics, with applications to paleoclimatic time series,
R. Vautard and M. Ghil, “Singular spectrum analysis in nonlinear dynamics, with applications to paleoclimatic time series,”Physica D: Nonlinear Phenomena, vol. 35, no. 3, pp. 395–424, 1989
work page 1989
-
[59]
L. Van der Maaten and G. Hinton, “Visualizing data using t-sne.” Journal of machine learning research, vol. 9, no. 11, 2008
work page 2008
-
[60]
Probabilistic principal component analysis,
M. E. Tipping and C. M. Bishop, “Probabilistic principal component analysis,”Journal of the Royal Statistical Society Series B: Statistical Methodology, vol. 61, no. 3, pp. 611–622, 1999
work page 1999
-
[61]
The varimax criterion for analytic rotation in factor analysis,
H. F. Kaiser, “The varimax criterion for analytic rotation in factor analysis,”Psychometrika, vol. 23, no. 3, p. 187–200, 1958
work page 1958
-
[62]
Dimensionality reduction of multimodal labeled data by local fisher discriminant analysis
M. Sugiyama, “Dimensionality reduction of multimodal labeled data by local fisher discriminant analysis.”Journal of Machine Learning Research, vol. 8, no. 5, 2007
work page 2007
-
[63]
Fast discrete curvelet transforms,
E. Candes, L. Demanet, D. Donoho, and L. Ying, “Fast discrete curvelet transforms,”multiscale modeling & simulation, vol. 5, no. 3, pp. 861– 899, 2006
work page 2006
-
[64]
G. Camps-Valls and L. Bruzzone, Eds.,Kernel methods for remote sensing data analysis. UK: Wiley & Sons, Dec 2009
work page 2009
-
[65]
C. A. Micchelli, Y . Xu, and H. Zhang, “Universal kernels.”Journal of Machine Learning Research, vol. 7, no. 12, 2006
work page 2006
-
[66]
Signal- to-noise ratio in reproducing kernel Hilbert spaces,
L. Gómez-Chova, R. Santos-Rodríguez, and G. Camps-Valls, “Signal- to-noise ratio in reproducing kernel Hilbert spaces,”Pattern Recogni- tion Letters, vol. 112, pp. 75–82, 2018
work page 2018
-
[67]
Learning repre- sentations by back-propagating errors,
D. E. Rumelhart, G. E. Hinton, and R. J. Williams, “Learning repre- sentations by back-propagating errors,”Nature, vol. 323, no. 6088, pp. 533–536, 1986
work page 1986
-
[68]
Deep representation learning: Fundamentals, technolo- gies, applications, and open challenges,
A. Payandeh, K. T. Baghaei, P. Fayyazsanavi, S. B. Ramezani, Z. Chen, and S. Rahimi, “Deep representation learning: Fundamentals, technolo- gies, applications, and open challenges,”IEEE Access, vol. 11, pp. 137 621–137 659, 2023
work page 2023
-
[69]
Self-supervised learning in remote sensing: A review,
Y . Wang, C. M. Albrecht, N. A. A. Braham, L. Mou, and X. X. Zhu, “Self-supervised learning in remote sensing: A review,”IEEE Geoscience and Remote Sensing Magazine, vol. 10, no. 4, pp. 213– 247, 2022
work page 2022
-
[70]
A simple frame- work for contrastive learning of visual representations,
T. Chen, S. Kornblith, M. Norouzi, and G. Hinton, “A simple frame- work for contrastive learning of visual representations,” inProceed- ings of the 37th International Conference on Machine Learning, ser. ICML’20. JMLR.org, 2020
work page 2020
-
[71]
SatCLIP: Global, general-purpose location embeddings with satellite imagery,
K. Klemmer, E. Rolf, C. Robinson, L. Mackey, and M. Rußwurm, “SatCLIP: Global, general-purpose location embeddings with satellite imagery,”arXiv preprint arXiv:2311.17179, 2023
-
[72]
A Survey of Large Language Models
W. X. Zhao, K. Zhou, J. Li, T. Tang, X. Wang, Y . Hou, Y . Min, B. Zhang, J. Zhang, Z. Dong, Y . Du, C. Yang, Y . Chen, Z. Chen, J. Jiang, R. Ren, Y . Li, X. Tang, Z. Liu, P. Liu, J.-Y . Nie, and J.-R. Wen, “A survey of large language models,” 2025. [Online]. Available: https://arxiv.org/abs/2303.18223
work page internal anchor Pith review Pith/arXiv arXiv 2025
-
[73]
Foundation models defining a new era in vision: A survey and outlook,
M. Awais, M. Naseer, S. Khan, R. M. Anwer, H. Cholakkal, M. Shah, M.-H. Yang, and F. S. Khan, “Foundation models defining a new era in vision: A survey and outlook,”IEEE Transactions on Pattern Analysis and Machine Intelligence, vol. 47, no. 4, pp. 2245–2264, 2025
work page 2025
-
[74]
CROMA: Remote sensing representations with contrastive radar-optical masked autoencoders,
A. Fuller, K. Millard, and J. R. Green, “CROMA: Remote sensing representations with contrastive radar-optical masked autoencoders,” inThirty-seventh Conference on Neural Information Processing Systems, 2023. [Online]. Available: https://openreview.net/forum?id= ezqI5WgGvY
work page 2023
-
[75]
Panopticon: Advancing any-sensor foundation models for Earth observation,
L. Waldmann, A. Shah, Y . Wang, N. Lehmann, A. J. Stewart, Z. Xiong, X. X. Zhu, S. Bauer, and J. Chuang, “Panopticon: Advancing any-sensor foundation models for Earth observation,”
- [76]
-
[77]
R. Balestriero and Y . LeCun, “Contrastive and non-contrastive self-supervised learning recover global and local spectral embedding methods,” inAdvances in Neural Information Processing Systems, A. H. Oh, A. Agarwal, D. Belgrave, and K. Cho, Eds., 2022. [Online]. Available: https://openreview.net/forum?id=jQgsZDspz5h
work page 2022
-
[78]
Compression of multispectral remote sensing images using clustering and spectral reduction,
A. Kaarna, P. Zemcik, H. Kalviainen, and J. Parkkinen, “Compression of multispectral remote sensing images using clustering and spectral reduction,”IEEE transactions on Geoscience and Remote Sensing, vol. 38, no. 2, pp. 1073–1082, 2000
work page 2000
-
[79]
Remote sensing image compression based on high-frequency and low-frequency components,
S. Xiang and Q. Liang, “Remote sensing image compression based on high-frequency and low-frequency components,”IEEE Transactions on Geoscience and Remote Sensing, 2024
work page 2024
-
[80]
The JPEG 2000 still image compression standard,
A. Skodras, C. Christopoulos, and T. Ebrahimi, “The JPEG 2000 still image compression standard,”IEEE Signal processing magazine, vol. 18, no. 5, pp. 36–58, 2001
work page 2000
-
[81]
Progressive 3-D coding of hyperspectral images based on JPEG2000,
B. Penna, T. Tillo, E. Magli, and G. Olmo, “Progressive 3-D coding of hyperspectral images based on JPEG2000,”IEEE Geoscience and Remote Sensing Letters, vol. 3, no. 1, pp. 125–129, 2006
work page 2006
discussion (0)
Sign in with ORCID, Apple, or X to comment. Anyone can read and Pith papers without signing in.