REVIEW 4 major objections 6 minor 35 references
Capturing Intransitive Dominance in Tennis Forecasting: A Graph Neural Network Approach
T0 review · 4 major / 6 minor · reviewed 2026-08-04 · deepseek-v4-flash
Pith's one-line read A graph neural network that explicitly models intransitive dominance between tennis players gains predictive and betting edges on exactly the matchups where rock-paper-scissors patterns occur, even though it does not beat strong ratings on
desk verdict GNN tennis forecasting with honest evaluation, but the intransitivity claim is confounded with head-to-head volume, and the arXiv abstract overstates what's in the paper. read the letter →
The pith
A machine-rendered reading of the paper's core claim, the machinery that carries it, and where it could break.
The reading
What carries the argument
The central object is MagNet, a spectral graph convolutional network for directed graphs whose key component is the magnetic Laplacian—a complex Hermitian matrix whose magnitude encodes whether two players have a head-to-head history and whose phase encodes who dominated; with q=0.25 the model maximally respects direction, and a two-layer, K=2 Chebyshev filter aggregates over an effective four-hop local neighbourhood, allowing it to detect directed cycles. The second mechanism is the evidence-weighted intransitivity measure I*(A_uv), defined as the Hodge-decomposition ratio of cyclic to transitive components of a common-opponent advantage matrix, scaled by the square root of accumulated head
What would settle it
Run the same betting strategy on a held-out period with the threshold γ=2.55 pre-committed and not re-tuned, or train the model on graphs where edge directions within each intransitive local neighbourhood are randomly shuffled while preserving the head-to-head evidence weight; if the 3.26% ROI persists after shuffling, the intransitivity mechanism is not the cause, and if the pre-committed threshold fails on fresh data, the claimed systematic inefficiency would be falsified.
Extended reading notes
Core claim
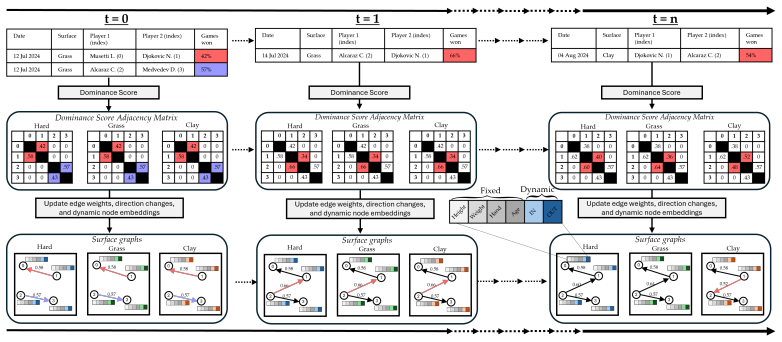
The authors build temporal directed surface graphs of tennis history, apply MagNet (a spectral GCN with a magnetic Laplacian that encodes head-to-head existence and direction), and achieve 65.7% accuracy, 0.215 Brier score—competitive with a strong Elo-style baseline (66.4%, 0.212) but behind Pinnacle Sports (69.0%, 0.196). A forecast-encompassing test shows they carry complementary information; combined forecasts significantly outperform the baseline. Using an evidence-weighted intransitivity measure, their Brier disadvantage to Pinnacle narrows from +0.023 (no prior meetings) to +0.007 in the most intransitive tertile (ρ=+0.049, p<0.001). A betting simulation targeting high-intransitivity
Load-bearing premise
The entire robustness and profitability result rests on the evidence-weighted intransitivity score I*, which is zero for every matchup with no prior head-to-head meetings, so the measured effect could be driven by the mere presence of historical edges the graph can read rather than by intransitive cycles; the authors never separate these two factors, and the betting threshold is also selected on the validation set.
Editorial extensions
If this is right
- Bookmakers (at least Pinnacle Sports) systematically misprice high-intransitivity tennis matchups, since a model using only public match history can profit after filtering on intransitivity.
- Transitive rating systems that assign each player a single scalar strength discard a real forecasting signal; blending such systems with cyclic-aware graph predictions improves accuracy.
- Women's tennis exhibits roughly 11.5% more measured intransitivity than men's, so the exploitable signal may be gender-dependent and could justify gendered modelling in practice.
- Betting-market efficiency is not uniform across matchup types: local neighbourhoods with high intransitive complexity appear less efficiently priced than the market average.
- Because the model is unprofitable when applied indiscriminately, the practical use is as a targeted overlay on high-intransitivity matches rather than a standalone predictor.
Reading between the lines
- The I* measure conflates intransitivity with the presence of head-to-head evidence: I*=0 whenever two players have never met, so the profitability threshold may be selecting matches where the graph has direct edges to read rather than cyclic structure per se; an ablation holding evidence weight fixed while permuting edge directions would separate these effects.
- The same cyclic-learning mechanism may transfer to other individual sports with strong stylistic matchups (e.g., mixed martial arts) or to any head-to-head prediction domain where preferences are non-transitive.
- The validation-selected threshold γ=2.55 should be evaluated on a fresh out-of-sample period without re-tuning; persistent profitability under those conditions would substantially strengthen the claim of a real market inefficiency.
- If the effect is real, a graph-observable intransitivity score could serve as a general diagnostic for conditional market inefficiency in other sports-betting markets, not just tennis.
Editorial analysis
A structured set of objections, weighed in public.
Referee Report
Summary. The paper proposes MagNet, a temporal directed graph neural network for tennis match forecasting. Historical matches are encoded as surface-specific edge weights (Eq. 3) with time decay, surface transferability, and tournament prestige; a magnetic-Laplacian spectral GCN predicts set and match win probabilities. In out-of-sample evaluation on 8,375 matches (2023-2025), the model achieves 65.7% accuracy / 0.215 Brier, slightly worse than Weighted Elo (66.4% / 0.212) and clearly worse than Pinnacle odds (69.0% / 0.196). The paper's central positive claims are: (i) MagNet's Brier disadvantage to Pinnacle narrows as an evidence-weighted intransitivity measure I* (Eq. 10) increases; and (ii) a Kelly strategy on matches with I* >= 2.55 yields 3.26% ROI over 1,903 out-of-sample bets, suggesting bookmakers misprice intransitive matchups. The abstract additionally claims a forecast-encompassing test and a combined-forecast improvement over Weighted Elo.
Significance. If the intransitivity attribution were established, this would be a useful contribution: it would provide one of the first GNN applications to pre-match tennis forecasting, a concrete mechanism (cyclical dominance) for a market inefficiency, and an out-of-sample betting result with a feasible threshold rule. The paper has real strengths: a carefully constructed temporal graph, walk-forward validation, comparisons against Elo, Weighted Elo, Bradley-Terry and Pinnacle odds, player-clustered bootstrap inference, and an explicit Hodge-decomposition-based intransitivity measure. However, the load-bearing inference from I* to intransitive structure is confounded by direct head-to-head evidence, and the abstract advertises a forecast-encompassing/combined-forecast result that does not appear in the full text. With the confound resolved or the claims appropriately narrowed, the paper could make a valuable contribution; in its current form the central conclusion is not yet supported.
major comments (4)
- [Abstract; Sections 5–7] The abstract states: 'a forecast-encompassing test shows that it carries complementary information. A combined forecast significantly outperforms Weighted Elo.' I could not find any forecast-encompassing test, any combined forecast, or any corresponding significance test anywhere in Sections 5–7 or the appendices. Unconditional accuracy and Brier are reported in Table 4, and binwise Brier gaps and betting returns are reported in Tables 5–6, but there is no encompassing regression, no forecast combination, and no test of whether a combined forecast beats WElo. This is a central advertised result. The authors should either add the missing analysis (e.g., a Clark-West or encompassing regression of outcomes on MagNet and WElo probabilities) or remove/replace the sentence in the abstract and temper the corresponding wording in the conclusion.
- [§6.1, Eq. (10); Table 5] The evidence-weighted measure I*(A_uv) = I(A_uv) * sqrt(sum_k alpha beta phi) multiplies the Hodge intransitivity measure by the accumulated head-to-head evidence. Since the evidence factor is zero exactly when u and v have no prior meetings, Bin 0 in Table 5 (I*=0, n=4,871) is a no-history bin, not simply a low-intransitivity bin. The narrowing Model-PS Brier gap across Bins 0–3 (+0.023 to +0.007) and the Spearman rho=+0.049 could therefore be driven by MagNet reading the direct dominance edge of Eq. (3) — a signal that Weighted Elo also uses — rather than by cyclic intransitivity. The manuscript nowhere conditions on the evidence sum while varying I(A_uv), and the fixed q=0.25 (§4.2) is never ablated to q=0 to remove directional/cyclic information. The paper's own text in §6.3 ('highlighting the importance of player interaction history') concedes this alternative explanation. This conf
- [§6.3, Table 6] The profitability claim is based on a validation-selected threshold: gamma = 2.55 was chosen by maximizing mean return on the validation set, and the reported p_bs values (0.005 for Kelly, 0.022 for unit) are computed for the single rule defined by this cutoff. The p-values do not account for the implicit search over gamma (Figure 8), over the two staking rules, or over the choice of the I* measure itself. The threshold also inherits the evidence confound of Eq. (10), since gamma filters on an evidence-weighted product. The out-of-sample evaluation is legitimate for the fixed rule, but the paper overstates the strength of the evidence for a systematic market inefficiency. I recommend reporting the distribution of out-of-sample ROI across a grid of gamma values, with a multiple-testing adjustment, or justifying a pre-registered threshold.
- [Section 7 (Conclusion)] The concluding sentence, 'preserving and learning from intransitive player relationships provides advantages to tasks like forecasting tennis match outcomes,' overstates the evidence. Table 4 shows MagNet does not improve on Weighted Elo or Pinnacle in unconditional forecasting; the only suggested advantage appears under the I* >= 2.55 filter, which is confounded as described above. The conclusion should be narrowed to the betting/robustness result (or the confound must be removed) so that the claims match what the data actually show.
minor comments (6)
- [Abstract vs. Table 4] The arXiv abstract reports a Brier score of 0.214, while the full-text abstract and Table 4 report 0.215. Please reconcile.
- [Abstract] The phrase 'Pinnacle Sports poorly handles matches with high intransitive complexity' is stronger than Table 5, where PS retains the best absolute Brier score in every bin. Consider saying 'relatively worse' or 'less robust' rather than 'poorly handles.'
- [Table 5 note] The note says 'Overall validation Brier scores: Model = 0.215, PS = 0.196, WElo = 0.212,' but these numbers match the out-of-sample test scores in Table 4. Label them as test-set scores to avoid confusion.
- [Eq. (11)] The Kelly formula uses decimal odds o, but o is not explicitly defined in that equation. Please define it as decimal odds for clarity.
- [Figure 8] The caption could be clearer: the numbers above the curve are bet counts, not ROI values. State this explicitly in the caption or legend.
- [Appendix B] There is a typo in the text: 'the results from the original out-of-sample test set are shown are shown' should read 'are shown.'
Circularity Check
No significant circularity: the central results are empirical out-of-sample evaluations; the I* evidence-weighting confound is a validity concern, not a circular reduction.
full rationale
The claimed derivation chain is empirical rather than definitional. Graph edge weights (Eq. 3) are built from historical outcomes with tuned decay/surface/prestige parameters; MagNet is then trained in a walk-forward scheme and evaluated on a held-out test window (Sections 4.3, 5). The intransitivity measure I*(A_uv) (Eq. 10) is used to condition or bin predictions, not to construct them, and the reported Brier gaps and Kelly ROI are computed on out-of-sample matches (Tables 5, 6). The betting threshold gamma=2.55 is selected on the validation set and then applied to the test set; this is conventional model selection and does not make the test ROI a fitted prediction. The paper's self-citations (Clegg & Cartlidge 2025a,b) appear in a novelty footnote, the Appendix B comparison, and a data-quality caveat; they are not the load-bearing justification for MagNet's behaviour, and no uniqueness theorem is imported from the authors' own work. A genuine methodological confound exists: because I* multiplies Hodge intransitivity by the accumulated head-to-head weight, I*=0 coincides exactly with no prior meetings (Eq. 10 and Table 5's Bin 0), and Figure 8 itself notes 'the importance of player interaction history'; moreover the fixed q=0.25 with no q=0 ablation leaves the intransitivity-specific mechanism unisolated. However, this is an identification/validity problem, not a case where a claimed prediction is equivalent to its inputs by construction. The abstract's forecast-encompassing claim is not substantiated in the full text, but missing support is not circularity. No circular step is established.
Assumptions & free parameters
free parameters (6)
- Time decay λ =
0.38
- Surface transferability α values (6) =
α_h,g=0.37, α_h,c=0.01, α_c,g=0.09, α_c,h=0.07, α_g,c=0.05, α_g,h=0.45
- Tournament prestige β values =
β_1000=0.85, β_Finals=0.94, β_500=0.69
- Label smoothing =
0.19
- Betting intransitivity threshold γ =
2.55
- Model architecture hyperparameters =
K=2, L=2, hidden=64, no activation, q=0.25 fixed
assumptions (6)
- standard math MagNet's magnetic Laplacian spectral filters (K=2, L=2) propagate directional and cyclic information through the graph as described in Appendix A.
- standard math Hodge decomposition of the logit advantage matrix A_uv into gradient and cyclic components correctly quantifies intransitivity in the common-opponent subgraph.
- domain assumption Set-win probabilities generated by MagNet are independent and identically distributed within a match, so match-win probabilities are computed by binomial expansion (Eq. 4).
- domain assumption Pinnacle Sports closing odds, after Shin (1993) margin adjustment, are unbiased estimates of true match probabilities.
- domain assumption The evidence-weighted intransitivity measure I*(A_uv) (Eq. 10) measures intransitive dominance rather than merely the volume of head-to-head evidence.
- domain assumption Historical match data from tennis-data.co.uk and player characteristics from tennisexplorer.com are accurate and complete; missing player characteristics are representatively imputed by gender-specific median/mode.
Cite this review
Pith. "Pith review of Capturing Intransitive Dominance in Tennis Forecasting: A Graph Neural Network Approach." pith.science (2026). https://pith.science/paper/FFSSZ7FU
@misc{pith2026251020454,
  author       = {Pith},
  title        = {Pith review of: Capturing Intransitive Dominance in Tennis Forecasting: A Graph Neural Network Approach},
  year         = {2026},
  howpublished = {\url{https://pith.science/paper/FFSSZ7FU}},
  note         = {Machine review of arXiv:2510.20454}
}
read the original abstract
Intransitive player dominance, where player A beats B, B beats C, but C beats A, is common in competitive tennis. Yet, there are few known attempts to incorporate it within forecasting methods. We address this problem with a graph neural network approach that explicitly models these intransitive relationships through temporal directed graphs, with players as nodes and their historical match outcomes as directed edges. Our model (65.7% accuracy, 0.214 Brier score) forecasts competitively with established rating systems such as Weighted Elo. Although it does not improve on the baseline in unconditional accuracy, a forecast-encompassing test shows that it carries complementary information. A combined forecast significantly outperforms Weighted Elo, and there is some indication that the gain grows more strongly on the intransitive matchups our model targets. A graph-based representation of player interactions thus captures a forecasting signal that transitive rating systems discard, even between players who share no common opponents.
Figures


Figures from the paper (5 more)


Reference graph
Works this paper leans on
-
[1]
Appendix B. Extended Initial Model In earlier work (Clegg and Cartlidge, 2025b) we proposed an unoptimised temporal graph model with a less sophisticated graph structure for the same task of tennis forecasting. To evaluate the robustness of this unoptimised approach, we increased the out-of-sample dataset to cover the period 31 October 2023 to 8 June
2023
-
[7]
European Journal of Operational Research 248, 211–218
An application of incomplete pairwise comparison matrices for ranking top tennis players. European Journal of Operational Research 248, 211–218. doi:10.1016/j.ejor.2015.06.069. Bradley, R.A., Terry, M.E.,
-
[12]
International Journal of Photoenergy 2022, 1898132
Forecasting tennis match results using the Bradley-Terry model. International Journal of Photoenergy 2022, 1898132. doi:10.1155/2022/ 1898132. Garnica-Caparrós, M., Memmert, D., Wunderlich, F.,
doi:10.1155/2022/ 2022
-
[13]
Information Systems and e-Business Management 20, 551–580
Artificial data in sports forecasting: A simulation framework for analysing predictive models in sports. Information Systems and e-Business Management 20, 551–580. doi:10.1007/s10257-022-00560-9. Hamilton, A.H., Roughan, M., Kalenkova, A.,
-
[18]
Journal of Quantitative Analysis in Sports 12, 127–138
Searching for the GOAT of tennis win prediction. Journal of Quantitative Analysis in Sports 12, 127–138. doi:10.1515/ jqas-2015-0059. Leitner, C., Zeileis, A., Hornik, K.,
2015
-
[21]
Master’s thesis
Sports match outcome prediction with graph rep- resentation learning. Master’s thesis. School of Computing Science, 32 Simon Fraser University, CA, USA. URL:https://summit.sfu.ca/ _flysystem/fedora/2022-08/input_data/22492/etd21919.pdf. Morris, B., Bialik, C.,
2022
-
[23]
Competitive balance in team sports games, in: IEEE Confer- ence on Games (CoG), IEEE. pp. 526–533. doi:10.1109/CoG47356.2020. 9231859. O’Malley, A.J.,
arXiv 2020
-
[25]
Non-transitive patterns in sports match outcomes: A profitable anomaly. Empirical Economics 69(4). doi:https://doi.org/ 10.1007/s00181-025-02838-6. Radicchi, F.,
Show all 35 references
-
[27]
Central European Journal of Operations Research 27, 533–549
An interactive approach to determine the elements of a pairwise comparison matrix. Central European Journal of Operations Research 27, 533–549. doi:10.1007/s10100-018-0539-6. Tukey, J.W.,
-
[28]
doi:10.1016/j.ijforecast.2019.08.009
Are betting returns a useful measure of accuracy in (sports) forecasting? International Journal of Forecasting 36, 713–722. doi:10.1016/j.ijforecast.2019.08.009. Wunderlich, F., Memmert, D.,
2019 doi
-
[29]
European Journal of Sport Science 21(7), 944–957
Forecasting the outcomes of sports events: A review. European Journal of Sport Science 21(7), 944–957. doi:10.1080/17461391.2020.1793002. Xenopoulos, P., Silva, C.,
2020
-
[30]
Graph neural networks to predict sports outcomes, in: 2021IEEEInternationalConferenceonBigData(BigData), IEEE. pp. 1757–1763. doi:10.1109/BigData52589.2021.9671833. Zhang, X., He, Y., Brugnone, N., Perlmutter, M., Hirn, M.,
2021
-
[31]
27003–27015
MagNet: A neural network for directed graphs, in: International Conference on Neural Information Processing Systems, pp. 27003–27015. URL:https: //dl.acm.org/doi/10.5555/3540261.3542329. 34 Appendix A. Mathematical Details of MagNet This appendix provides the complete mathemat...
2016
-
[33]
By incorporating 843 additional matches, the total out-of-sample test set increased in size to 1,918 professional matches across both the original period (31 October 2023 to 8 September
2023
-
[34]
The dataset differs from the one we use here in that it only considers men’s matches and excludes any 500-point matches other than the Halle Open and the Queen’s Club Championships
and the extended period (9 September 2024 to 8 June 2025). The dataset differs from the one we use here in that it only considers men’s matches and excludes any 500-point matches other than the Halle Open and the Queen’s Club Championships. The initial implementation of tempor...
2024
-
[35]
This extension provides further justification for the proper hyperparameter tuning and improved graph structure in this work
All metrics rounded to three decimal places. This extension provides further justification for the proper hyperparameter tuning and improved graph structure in this work. In Table B.7, the results from the original out-of-sample test set are shown are shown along with results ...
1918
-
[1950]
Monthly weather review 78, 1–3
Verification of forecasts expressed in terms of probability. Monthly weather review 78, 1–3. URL:https://doi.org/10.1175/1520- 0493(1950)078<0001:VOFEIT>2.0.CO;2. Brin, S., Page, L.,
1950 doi
-
[1956]
The Bell Sys- tem Technical Journal 35(4), 917–926
A new interpretation of information rate. The Bell Sys- tem Technical Journal 35(4), 917–926. doi:10.1002/j.1538-7305.1956. tb03809.x. Klaassen, F.J., Magnus, J.R.,
1956
-
[1993]
The Economic Journal 103(420), 1141–1153
Measuring the incidence of insider trading in a market for state-contingent claims. The Economic Journal 103(420), 1141–1153. doi:10.2307/2234240. Temesi, J.,
-
[1997]
JournaloftheRoyalStatistical Society: Series C (Applied Statistics) 46, 265–280
Modelling association football scores and inefficienciesinthefootballbettingmarket. JournaloftheRoyalStatistical Society: Series C (Applied Statistics) 46, 265–280. doi:10.1111/1467- 9876.00065. Elo, A.E., Sloan, S.,
-
[2000]
International Transactions in Operational Research 7, 585–594
Using official ratings to simulate major ten- nis tournaments. International Transactions in Operational Research 7, 585–594. doi:10.1111/j.1475-3995.2000.tb00218.x. Clegg, L., Cartlidge, J., 2025a. Not feeling the buzz: Correction study of mispricing and inefficiency in onlin...
-
[2008]
Journal of Quantitative Analysis in Sports 4(2)
Probability formulas and statistical analysis in tennis. Journal of Quantitative Analysis in Sports 4(2). doi:10.2202/1559-0410
- [2009]
-
[2011]
International Journal of Forecasting 27(2), 619–630
A Bradley-Terry type model for forecasting tennis match results. International Journal of Forecasting 27(2), 619–630. doi:10.1016/j.ijforecast.2010.04.004. Mirzaei, A.,
2010 doi
-
[2013]
(Eds.), Com- puter Performance Engineering, Springer, Berlin, Heidelberg
On the (page) ranking of professional tennis players, in: Tribastone, M., Gilmore, S. (Eds.), Com- puter Performance Engineering, Springer, Berlin, Heidelberg. p. 237–247. doi:10.1007/978-3-642-36781-6_17. Dixon, M.J., Coles, S.G.,
-
[2015]
FiveThirtyEight
Serena Williams and the difference be- tween all-time great and greatest of all time. FiveThirtyEight. URL: http://fivethirtyeight.com/features/serena-williams-and-the- difference-between-all-time-great-and-greatest-of-all-time. accessed: 2025-04-03. Nikolakaki, S.M., Dibie, O...
2025
-
[2016]
(Eds.), Complex Networks VII
A subgraph-based ranking system for professional tennis players, in: Cherifi, H., Gonçalves, B., Menezes, R., Sinatra, R. (Eds.), Complex Networks VII. Springer International Pub- lishing, Cham. volume 644 ofStudies in Computational Intelligence, p. 159–171. doi:10.1007/978-3-...
-
[2017]
International Journal of Forecasting 33(2), 458–466
A bivariate Weibull count model for forecasting association football scores. International Journal of Forecasting 33(2), 458–466. doi:10.1016/j.ijforecast.2016.11.006. Bozóki, S., Csató, L., Temesi, J.,
2016 doi
-
[2019]
2623–2631
Optuna: A next-generation hyperparameter optimization framework, in: Proceedings of the 25th ACM SIGKDD International Conference on Knowledge Dis- covery & Data Mining, pp. 2623–2631. doi:10.1145/3292500.3330701. Angelini, G., Candila, V., De Angelis, L.,
-
[2020]
International Journal of Forecasting 36(4), 1329–1341
Extension of the Elo rating system to margin of victory. International Journal of Forecasting 36(4), 1329–1341. doi:10.1016/j. ijforecast.2020.01.006. Kovalchik, S.A.,
2020 doi
-
[2021]
(Eds.), SOFSEM 2021: Theory and Practice of Computer Science, Springer International Publishing, Cham
Predicting tennis match out- comes with network analysis and machine learning, in: Bureš, T., Dondi, R., Gamper, J., Guerrini, G., Jurdziński, T., Pahl, C., Sikora, F., Wong, P.W. (Eds.), SOFSEM 2021: Theory and Practice of Computer Science, Springer International Publishing, ...
2021 doi
-
[2022]
European Journal of Operational Research 297, 120–132
Weighted Elo rating for tennis match predictions. European Journal of Operational Research 297, 120–132. doi:10.1016/j.ejor.2021.04.011. Aparício, D., Ribeiro, P., Silva, F.,
2021 doi
-
[2023]
Annals of Operations Research 325, 615–632
A new model for predicting the winner in tennis based on the eigenvector centrality. Annals of Operations Research 325, 615–632. doi:10.1007/s10479-022-04594-7. Bayram, F., Garbarino, D., Barla, A.,
- [2024]
-
[2025]
International Journal of Forecasting 41(2), 803–820
Forecasting soccer matches with betting odds: A tale of two markets. International Journal of Forecasting 41(2), 803–820. doi:10.1016/j.ijforecast.2024.06.013. Kelly, J.L.,
2024 doi
Reviewed August 4, 2026 · model on record in the stance chip above.
Discussion (0). Continue with ORCID to comment.