REVIEW 2 major objections 4 minor 3 cited by
Not all protoclusters quench their galaxies: JWST grism data at z=7.66 show resident galaxies forming stars as vigorously as field galaxies, placing the onset of environmental effects around halo masses of 10^11.5 solar masses.
Reviewed by Pith at T0; open to challenge. T0 means a machine referee read the full paper against a public rubric. the ladder, T0–T4 →
T0 review · deepseek-v4-flash
2026-08-03 23:28 UTC pith:QXFEHAGN
load-bearing objection A well-executed new protocluster dataset, but the headline halo-mass threshold at ~11.5 is not robust to plausible incompleteness and systematics. the 2 major comments →
Not all protoclusters host evolved galaxies: Evidence for reduced environmental effects in a lower halo mass protocluster at z = 7.66
The pith
A machine-rendered reading of the paper's core claim, the machinery that carries it, and where it could break.
Core claim
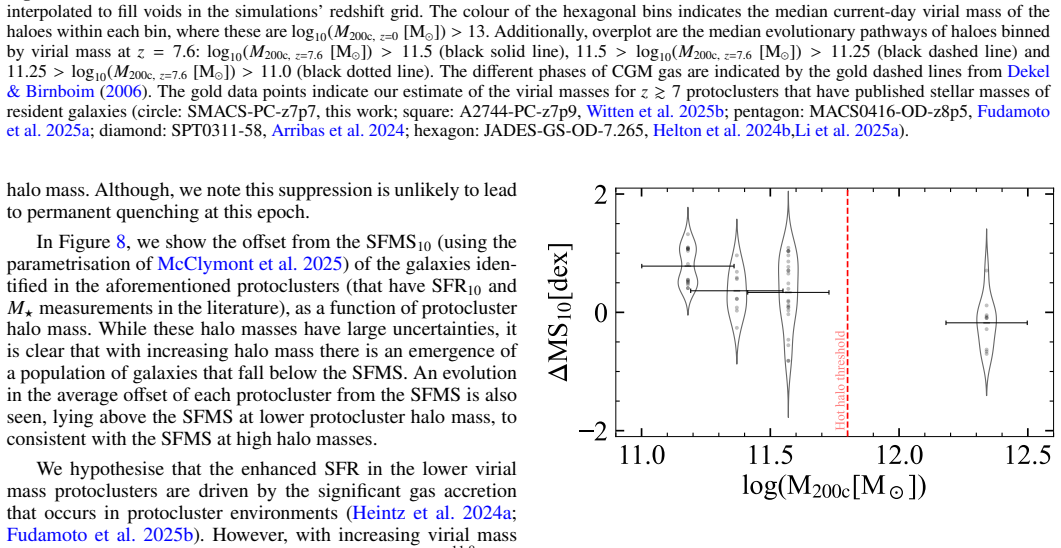
The central claim is that environmental effects only become significant once a protocluster's dark matter halo exceeds roughly 10^11.5 solar masses. In SMACS-PC-z7p7, a ~10^11.4 M200c halo at z=7.66, every spectroscopically confirmed galaxy has a rising star-formation history (SFR10/SFR100 > 1), lies on or above the field star-forming main sequence, and shows a low neutral-hydrogen column density (NHI < 10^21.5 cm^-2 for all but one galaxy). This contrasts with A2744-PC-z7p9, a 0.2 dex more massive system where most galaxies show high neutral-hydrogen columns, old stellar populations, and substantial dust. The paper presents SMACS-PC-z7p7 as an early stage of protocluster assembly in which t
What carries the argument
The argument rests on an adapted stellar-to-halo mass relation built from the simulations used in this paper: the total stellar mass of all galaxies within the virial radius (R < R200c) of the most massive central galaxy is fit linearly against halo mass (log10 M200c = a log10 Mstar + b, with a = 0.49, b = 6.86, and 0.13 dex scatter). This converts the summed stellar masses of the 11 observed galaxies into a halo mass estimate, and the paper combines it with the offset of resident galaxies from the star-forming main sequence (DeltaMS10) to map how environmental suppression grows with halo mass.
Load-bearing premise
The inferred halo mass assumes the 11 detected galaxies essentially contain all the stellar mass within the virial radius, so unseen faint members contribute negligibly; if that assumption fails, SMACS-PC-z7p7 could sit above the proposed threshold.
What would settle it
Measure the dynamical mass of SMACS-PC-z7p7 from the line-of-sight velocity dispersion of the six [O III] emitters (using the grism spectra already in hand): a dispersion implying M200c >~ 10^11.5 Msun would directly contradict the low-halo-mass interpretation. Alternatively, deeper NIRCam imaging that finds the enclosed stellar mass is about 0.3 dex higher would shift the inferred halo mass across the threshold.
If this is right
- If the threshold is correct, deep surveys should find many z>7 protoclusters whose galaxies are indistinguishable from field galaxies; only systems above ~10^11.5 Msun should show the evolved, quenched populations reported elsewhere.
- SMACS-PC-z7p7 will typically evolve into a present-day Fornax-like cluster (~10^13.7 Msun at z=0), directly connecting this early star-forming phase to low-mass clusters today.
- Overdensity alone is not a proxy for quenching: a delta ~ 200 environment at this halo mass appears to enhance rather than suppress star formation.
- The data place SMACS-PC-z7p7 as an early-stage protocluster in which gas accretion still dominates over feedback, encouraging a homogeneous, simulation-calibrated selection of protoclusters for future study.
Where Pith is reading between the lines
- A direct dynamical check would strengthen or falsify the low-mass interpretation: measuring the line-of-sight velocity dispersion of the six confirmed emitters could yield an independent halo mass, and a dynamical mass above ~10^11.5 Msun would push the system across the proposed threshold.
- The halo mass estimate assumes the observed galaxies dominate the stellar mass within the virial radius; deeper imaging that resolves fainter members could raise the enclosed mass by roughly 0.3 dex, moving SMACS-PC-z7p7 across the threshold. This is a testable prediction of the paper's method.
- If the threshold is real, wide-area surveys (e.g., Euclid, Roman) should find a population of low-mass overdensities whose galaxies look like the field, while the fraction of 'evolved' protoclusters rises steeply above the threshold.
- The comparison would be sharper if applied separately to core and satellite galaxies; A2744-PC-z7p9 shows that position within the protocluster matters, so the threshold may depend on both halo mass and location within the halo.
Editorial analysis
A structured set of objections, weighed in public.
Referee Report
Summary. This paper presents JWST/NIRCam grism and imaging observations of the candidate protocluster SMACS-PC-z7p7 at z=7.66 in the SMACS J0723.3-7327 field. The authors identify six [O III] emitters and five additional photometric candidates in a ~0.3 arcmin^2 core, measure an overdensity delta~200, and use Prospector fits to infer stellar masses, SFRs, UV slopes and N_HI column densities. They find that all galaxies in the core have rising star-formation histories and lie on or above the field star-forming main sequence, in contrast to the more evolved population in the z=7.88 A2744 protocluster. Using a TNG300/TNG-Cluster relation between the stellar mass within R200c and halo mass, they infer log10 M200c = 11.4 +/- 0.2 and a present-day Fornax-like descendant, and conclude that environmental suppression of star formation becomes significant only above log10 M200c ~ 11.5.
Significance. If correct, this is a valuable addition to the small sample of spectroscopically confirmed z > 7 protoclusters. The paper's strengths are the very deep grism data, the explicit overdensity measurement, the careful handling of the LRD candidate PW3, and the use of TNG-Cluster/TNG300 to frame halo-mass evolution in a consistent simulation. The central conclusion, however, rests on the halo-mass estimate and on a comparison of only a handful of protoclusters, with the A2744 comparison anchored mainly in the same group's previous work. The result is plausible and important, but the halo-mass systematics need to be addressed before the threshold claim can be considered established.
major comments (2)
- [§5, Fig. 6] The halo-mass estimate log10 M200c = 11.4 +/- 0.2 is the load-bearing step: the title, abstract and §7 rely on SMACS-PC-z7p7 being lower-mass than A2744-PC-z7p9. The quoted uncertainty includes only stellar-mass errors and the 0.13 dex scatter of the TNG fit, not the dominant systematics. The statement that an underlying population is 'unlikely to contribute significantly' to the stellar mass within R200c is unsupported; the selection is biased toward star-forming galaxies, and a missing factor of ~2 in enclosed M* is plausible. With a=0.49, +0.3 dex in M* shifts log M200c by ~0.15 dex, crossing the 11.5 threshold. The text also cites Kannan et al. (2023) for up to 0.3 dex TNG stellar-mass underestimates at z~10 but does not propagate this system. Since the quoted separation from A2744-PC-z7p9 is only 0.2 dex, the differentiation is not robust. A quantitative completeness correction and
- [§6, Fig. 8] The threshold claim (log10 M200c ~ 11.5) is inferred from only four protoclusters, each with heterogeneous SFR and M* measurements and large halo-mass uncertainties. The figure shows a declining average offset with mass, but no threshold model is fitted and no significance is given; a continuous trend is equally consistent with the plotted points. The conclusion that environmental effects 'only become significant' above 11.5 is stronger than the data support. The text should either test a threshold explicitly or present the result as a tentative trend to be confirmed with a larger sample.
minor comments (4)
- [Abstract vs §5.1] The front-matter abstract gives log10(M200c,z=0) = 14.3 +/- 0.6 for SMACS-PC-z7p7, while §5.1 and the abstract in the full text give 13.7 +/- 0.6; 14.3 is the value quoted for A2744-PC-z7p9. Please correct the inconsistency.
- [§3.1] The overdensity parameter is reported as delta ~ 200, while the UVLF is described as ~300 times the nominal one. Please define whether delta = n/nbar - 1 or n/nbar, so the two statements are internally consistent.
- [Table 1] PW12 and PW13 are listed as lower-confidence photometric candidates with photometric redshifts of 8.1(+0.2/-0.4) and 7.4(+0.3/-0.1). These are only marginally consistent with z=7.66. Please label these as z_phot, and state explicitly whether they are included in the halo-mass sum.
- [§5, Fig. 6] The sentence 'haloes at z~7.6, with stellar masses greater than M* > 10^8.2 M_sun' is ambiguous: does the M* cut apply to the haloes or to the galaxies whose stellar masses are summed? Please clarify the selection used to define the fitted relation.
Circularity Check
No significant circularity: the halo-mass diagnostic is calibrated on external TNG simulations and the A2744 comparison, though self-cited, rests on independent JWST data.
full rationale
The paper's central derivation is not circular by construction. The halo mass of SMACS-PC-z7p7, log10(M200c[M_sun]) = 11.4±0.2, is obtained by summing observed galaxy stellar masses and applying a stellar-mass-to-halo-mass relation fitted to TNG300 and TNG-Cluster haloes at z~7.6 (Sec. 5: 'We fit the haloes at z∼7.6, with stellar masses greater than M* > 10^8.2 M_sun, with a linear fit (log10 M200c = a × log10 M* + b; a=0.49, b=6.86)'). The target protocluster enters only as the argument of an externally calibrated relation; the inferred mass is not defined in terms of the quenching claim it supports. The comparison with A2744-PC-z7p9 relies on Witten et al. (2025b), a self-citation, but that work is a separate JWST dataset whose stellar masses, SFHs, and N_HI estimates are externally falsifiable, and the present paper re-derives A2744's halo mass from those reported stellar masses using the same TNG-calibrated relation rather than importing the conclusion. The threshold log10(M200c) ≳ 11.5 is explicitly a hypothesis ('We hypothesise that this emerging suppression of star formation is driven by multiple feedback processes...') supported by Figure 8 and the independent hot-halo threshold of Dekel & Birnboim (2006), not a parameter fitted to the data it is used to explain. The paper also acknowledges its main limitations — 'an underlying galaxy population below the depth of current imaging is likely' and simulation-resolution offsets 'up to 0.3 dex at z∼10' — which affect robustness but do not amount to a circular reduction. Accordingly, no step in the derivation chain is equivalent to its inputs by construction; the modest score reflects the minor self-citation in the A2744 comparison rather than any definitional circularity.
Axiom & Free-Parameter Ledger
free parameters (3)
- TNG SHMR slope a =
0.49
- TNG SHMR intercept b =
6.86
- Environmental threshold log10 M200c =
~11.5 (M_sun)
axioms (4)
- domain assumption TNG300 and TNG-Cluster simulations correctly reproduce the stellar–halo mass relation inside the virial radius at z~7.6
- domain assumption The observed galaxies dominate the stellar mass within the protocluster's virial radius
- domain assumption Damping of the F115W flux relative to the Prospector model is entirely due to a Voigt-profile DLA, after applying a maximally neutral IGM (Mason & Gronke 2020)
- domain assumption The hot-halo threshold mass at which environmental quenching begins is set by Dekel & Birnboim (2006) shock heating around log M ~ 11.8 (used as ~11.5 here)
Cite this review
Pith. "Pith review of Not all protoclusters host evolved galaxies: Evidence for reduced environmental effects in a lower halo mass protocluster at $z = 7.66$." pith.science (2026). https://pith.science/paper/QXFEHAGN
@misc{pith2026251105647,
  author       = {Pith},
  title        = {Pith review of: Not all protoclusters host evolved galaxies: Evidence for reduced environmental effects in a lower halo mass protocluster at $z = 7.66$},
  year         = {2026},
  howpublished = {\url{https://pith.science/paper/QXFEHAGN}},
  note         = {Machine review of arXiv:2511.05647}
}
read the original abstract
The progenitors of present-day galaxy clusters offer crucial insight into how galaxies and large-scale structure co-evolve in the early Universe. We present JWST/NIRCam grism spectroscopy of the photometrically identified $z=7.66$ protocluster core in the SMACS J0723.3-7327 lensing field, SMACS-PC-z7p7. We find six [O III]-emitters and five additional photometric candidates within a 0.3 arcmin$^2$ ($1.5\ {\rm cMpc}^2$) region, corresponding to an overdensity of $\delta \sim 200$. Despite the extreme overdensity, the resident galaxies exhibit star formation histories, UV slopes, and neutral hydrogen column densities that are consistent with those of field galaxies at similar redshifts. This is in stark contrast to the consistently high neutral hydrogen column densities, old stellar populations, and large dust masses of galaxies within a $z=7.88$ protocluster in the Abell 2744 field. Comparison with the TNG-Cluster and TNG300 simulations indicates a halo mass of ${\rm log_{10}}(M_{200{\rm c}}[{\rm M_{\odot}}]) = 11.4\pm0.2$ and implies that, on average, SMACS-PC-z7p7 will evolve into a present-day Fornax-like cluster (${\rm log_{10}}(M_{200{\rm c},\ z=0}[{\rm M_{\odot}}]) = 14.3\pm0.6$). The uniformly young, highly star-forming nature of the galaxy population of SMACS-PC-z7p7 suggests that environmental effects only become significant above halo masses of ${\rm log_{10}}(M_{200{\rm c}}[{\rm M_{\odot}}]) \gtrsim 11.5$. Comparison with other $z\gtrsim7$ protoclusters reveals that vigorous star formation persists in lower-mass protoclusters, whereas accelerated evolution and suppression of star formation emerge in more massive haloes. SMACS-PC-z7p7 therefore represents an early stage of protocluster assembly, in which residence within an overdense environment still enhances star formation and feedback processes have yet to exert a significant influence.
Figures


Forward citations
Cited by 3 Pith papers
-
A Cosmic Archipelago of lensed metal-poor galaxies at $z\sim6$
Discovery of an overdense 'Cosmic Archipelago' of young metal-poor star-forming galaxies at z~6.14 with one detailed example showing high Lyman-continuum escape fraction suggesting significant contribution to cosmic r...
-
All the Massive Galaxy Overdensities during Reionization: JWST Rest-Frame Optical Selection Reveals Young, Chemically Evolved Galaxies Embedded in Dense, Neutral Gas at z > 5
A rest-frame optical JWST survey finds five robust galaxy overdensities at z≈5.7-6.8 whose members are younger, less massive, and sometimes embedded in denser neutral hydrogen than field galaxies.
-
The birth of the intracluster medium: the evolution of multiphase gas and Lyman-$\alpha$ haloes in a simulated $z\sim3$ protocluster
Between z≈4.4 and 2.7, a simulated protocluster's cold circumgalactic gas is destroyed from the inside out by a merger and AGN feedback, while its Lyman-alpha halo shifts from filamentary to spherical.
Reference graph
Works this paper leans on
-
[1]
Adams, N. J., Conselice, C. J., Ferreira, L., et al. 2023, Monthly Notices of the Royal Astronomical Society, V olume 518, Issue 3, pp.4755-4766, 518, 4755 Akins, H., Casey, C., Lambrides, E., et al. 2024, 243, 149.07, conference Name: American Astronomical Society Meeting Abstracts ADS Bibcode: 2024AAS...24314907A Arrabal Haro, P., Dickinson, M., Finkels...
Pith/arXiv arXiv 2023
-
[3]
The best-fit stellar mass is log10(M⋆[M⊙])=10±0.1, with a V-band dust attenuation of AV =2.0 +0.4 −0.2
This fitting yields a SFH that is domi- nated by a recent burst, over the previous∼20 Myrs, with a peak star-formation rate of∼1,000M ⊙/yr. The best-fit stellar mass is log10(M⋆[M⊙])=10±0.1, with a V-band dust attenuation of AV =2.0 +0.4 −0.2. Before discussing the failure of ourPROSPECTORmodel to reproduce the extremely red rest-optical continuum of PW3,...
2024
-
[5]
It is clear that when modelled with purely stellar populations, the LRDs (red data points) have significantly higher stellar mass surface densities than the sample ofz>5 galaxies
and SMACS-PW3 (red square; this work). It is clear that when modelled with purely stellar populations, the LRDs (red data points) have significantly higher stellar mass surface densities than the sample ofz>5 galaxies. Moreover, PW3 has a higher stellar mass surface density than even one of the most extreme density objects RUBIES- UDS-QG-z7. Article numbe...
2023
-
[2024]
and one of the most mas- sive, compact, non-LRD objects (grey data points) at high-redshift (grey rotated square; Weibel et al. 2025). In red we indicate a sample of pho- tometrically identified LRDs from (Akins et al
2025
-
[2025]
has a significantly smaller effective radius constraint thanks to lensing magnification, and as noted by Ma et al. (2024), this results in a stellar mass surface density in PW3 that is in excess of the maximum density observed in the local Universe and low-redshift galaxies (log 10(Σ∗,<Re[M⊙/kpc2])∼11; Hop- kins et al. 2010). Moreover, the lower bound of ...
2024
discussion (0)
Sign in with ORCID, Apple, or X to comment. Anyone can read and Pith papers without signing in.