REVIEW 3 major objections 5 minor 2 cited by
A combination of sparse spectroscopic redshifts and dense photometric samples maps two z=3.1 protocluster complexes in three dimensions, confirming COSMOS-z3.1-A as a proto-supercluster of ten density peaks destined to become a Coma-scale s
Reviewed by Pith at T0; open to challenge. T0 means a machine referee read the full paper against a public rubric. the ladder, T0–T4 →
T0 review · deepseek-v4-flash
2026-08-03 22:08 UTC pith:QCTYYWQN
load-bearing objection A useful 3D characterization of two z=3.1 protocluster complexes with a solid mock-based method, but the proto-supercluster and mass claims rest on an unverified spec-z representativeness assumption and a small LAB sample. the 3 major comments →
ODIN: Characterizing the Three-dimensional Structure of Two Protocluster Complexes at z = 3.1
The pith
A machine-rendered reading of the paper's core claim, the machinery that carries it, and where it could break.
Core claim
The central claim is that COSMOS-z3.1-A is a confirmed proto-supercluster at z=3.1, analogous to the only previously known high-redshift proto-supercluster at z≈2.4 but observed at an earlier epoch. The paper argues that reconstructing the three-dimensional galaxy distribution from a hybrid sample—spectroscopically confirmed galaxies providing a redshift prior per sightline, photometrically selected galaxies filling in the density field—yields ten density peaks in COSMOS-z3.1-A and four in COSMOS-z3.1-C. Each peak is interpreted as a protocluster core; summing their volumes and applying a bias-corrected density-to-mass relation gives descendant masses above 10^15.3 solar masses, exceeding th
What carries the argument
The load-bearing device is a sightline-specific redshift prior: within each small three-dimensional cell (2 cMpc bins, smoothed with a Gaussian), the redshift distribution of spectroscopically confirmed Lyα emitters is taken to represent the true redshift distribution of all photometrically selected emitters in that cell. Each unconfirmed galaxy is assigned a redshift drawn from its cell's prior, repeated 500 times, and the averaged realizations define the 3D density field. Density peaks are then defined as contiguous regions above the top 3% density threshold with volume at least 500 cMpc^3, stable across 95% of realizations. The paper validates this machinery by constructing mock observati
Load-bearing premise
The reconstruction stands or falls on the assumption that the redshift distribution of the spectroscopically confirmed galaxies in each small sightline cell is the same as the true redshift distribution of all photometrically selected galaxies in that cell, which requires random, unbiased spectroscopic targeting and very low contamination of the photometric sample.
What would settle it
Look inside one reconstructed density peak with complete, blind spectroscopy of every LAE in that volume, or with a redshift indicator independent of Lyα such as rest-frame optical emission lines. If the confirmed galaxies do not cluster at the reconstructed peak's redshift, or if the peak disperses when Lyα velocity offsets are removed, the reconstruction would be shown to manufacture structure rather than recover it.
If this is right
- If the reconstruction is faithful, COSMOS-z3.1-A will evolve into an ultra-massive structure with descendant mass log(M/M⊙) ≈ 15.5 within its peaks and ≈ 16.0 over the full supercluster volume, about twice Coma's mass.
- Both complexes are confirmed as multiple distinct protocluster cores, implying that a single 2D overdensity can hide several independent halos along the line of sight.
- The validation implies that a spectroscopic fraction as low as 20% is sufficient to recover large-scale structure when combined with a dense photometric LAE sample, at least for the most massive systems.
- Descendant mass estimates from 3D reconstruction carry 0.2–0.3 dex scatter, roughly half that of purely 2D estimates.
- Lyα blobs near the complexes sit about 17 cMpc from peak centers, suggesting they trace the outskirts and infalling material rather than the dense cores.
Where Pith is reading between the lines
- The sightline-dependence result implies that narrowband surveys may systematically miss proto-superclusters whose longest axis lies along the line of sight; counting such structures requires either multiple filters or spectroscopic coverage spanning the full filter depth.
- If LAB outskirts are confirmed with larger samples, it would favor models in which cold accretion or proto-group gas powers the blobs near the edges of overdense regions, and would sharpen LABs as tracers of filaments rather than cores.
- A direct test would be to apply the same reconstruction in a field with independent spectroscopic redshifts from a different emission line and check whether the peaks survive; agreement would confirm the method, while disagreement would isolate Lyα velocity-offset bias.
- The volume-density bound of roughly 5×10^-8 cMpc^-3 implies that finding analogs will require simulations with gigaparsec-scale boxes, so similar analyses on such simulations could predict how many of these systems the full survey footprint should contain.
Editorial analysis
A structured set of objections, weighed in public.
Referee Report
Summary. The paper presents a probabilistic 3D reconstruction of two z=3.1 LAE overdensities in COSMOS, COSMOS-z3.1-A and COSMOS-z3.1-C, combining narrowband photometry from ODIN with Keck/DEIMOS, Gemini/GMOS, and DESI spectroscopy. Spectroscopic redshifts are used to build sightline-specific redshift priors; these priors are then used to assign redshifts to all photometric LAE candidates over 500 realizations. The method is validated against IllustrisTNG300 mocks, showing lower total variation distance relative to the dark matter distribution than spec-z-only reconstructions. The resulting maps show elongated, multi-peak structure; the authors identify ten density peaks in COSMOS-z3.1-A and four in COSMOS-z3.1-C, estimate descendant masses of log(M/Msun) ~ 14-15 per peak, and argue that COSMOS-z3.1-A is a proto-supercluster comparable to Hyperion at z=2.4, but at an earlier epoch. They also report that Ly-alpha blobs preferentially avoid the density-peak cores and provide simulation-based guidance on spectroscopic sampling strategies.
Significance. If the central claim holds, this is an important result: COSMOS-z3.1-A would be the earliest known proto-supercluster, with a total enclosed mass of log(M/Msun) ~ 16.0 and a volume of ~10^5 cMpc^3 at z=3.1, and its ten peaks would be individually destined to become Coma-scale clusters. The paper's strengths are substantial: the reconstruction is tested on TNG300, the validation metric (DTV) is clearly defined and shows a consistent improvement over spec-z-only maps, the robustness to binning/smoothing is examined in Appendix A, and the effect of redshift-space distortions and Ly-alpha velocity offsets is quantified in Appendix B. The data products and interactive visualizations are made publicly available. However, the two main scientific conclusions—the multi-peak morphology and the descendant masses—both depend on the redshift-prior assumption in Section 3.1 and on a simulation-based mass calibration that is partially extrapolated beyond the regime in which it is tested.
major comments (3)
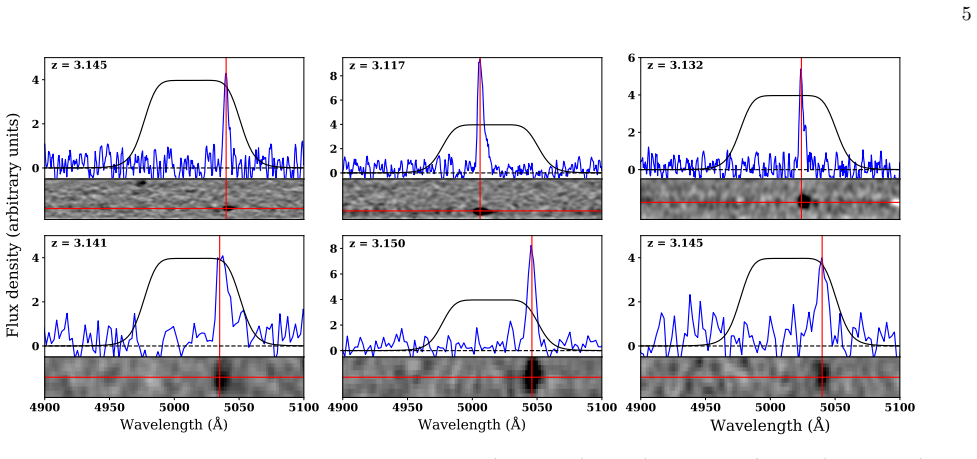
- [Section 3.1] The central assumption is N(z,S_i) = N_spec(z,S_i): the redshift distribution of spectroscopically confirmed LAEs in a 2x2x2 cMpc sightline cell equals the true distribution of all photometric LAEs in that cell. This is load-bearing for the number of peaks, their morphology, and their masses. The paper argues that targets are selected randomly within masks and that sample purity is >=95%, but the masks are placed on 2D overdensities (Fig. 3), and many cells are populated by sources from a single mask. If a mask preferentially covers a sub-structure at a particular redshift, or if Ly-alpha detection efficiency varies with line flux/wavelength within the N501 band, the prior will imprint that redshift structure onto all photometric LAEs, artificially creating and stabilizing peaks. The TNG300 validation does not retire this risk: mock spec-z sources are assigned only in top-25% surface-den
- [Section 5.2 / Section 6.2] The descendant-mass calibration is applied to a regime where it is not directly tested. Equation (3) uses a bias b_g=1.8 and a factor-of-two correction calibrated on TNG300 structures with z=0 masses log(M200/Msun) ~ 14.6-15.2 (Table 2). The individual peaks in Table 3 fall mostly in this range, but the paper's headline claim for COSMOS-z3.1-A is the total enclosed mass log(M/Msun) ~ 16.0 within the 92%-threshold volume, and Section 5.2 states explicitly that 'there are no directly comparable structures to COSMOS-z3.1-A in TNG300.' The extrapolation from the calibrated range to the total proto-supercluster mass is therefore not protected by the mock validation, and the quoted 0.2-0.3 dex uncertainty does not include this extrapolation error. The comparison to Hyperion's total mass of log(M/Msun) ~ 15.7 rests on this extrapolation. I recommend either calibrating on larger-volume simulatio
- [Section 5.1] The line-of-sight extent of COSMOS-z3.1-A is set by the N501 filter transmission (about 60 cMpc), and the paper notes that the bulk of the structure lies outside the central 2 deg^2 of COSMOS, where the richest ancillary data exist. The reported total volume of ~9.8x10^4 cMpc^3 above the 92% threshold is therefore a filter-limited quantity, not the intrinsic extent of the structure. The comparison with Hyperion, whose line-of-sight extent (~150 cMpc) is much larger than the ODIN filter depth, is informative but should be framed as a comparison of observed volumes rather than intrinsic volumes. This is a caveat to the 'similar volume' statement in Section 7 and should be made explicit in the abstract-level conclusion.
minor comments (5)
- [Section 4.2] Typo: 'log(M/M_sun),≈15.3' should read 'log(M/M_sun) ≈ 15.3'.
- [Appendix A / Figure 14] Figure 14 caption lists smoothing scales (sigma = 5, 3, 2, 1) that are not described in the text, which says a 3D Gaussian kernel with standard deviation 2-3 cMpc was adopted. Please clarify the relation between the caption values and the adopted scales.
- [Section 6.1] The fitting function D_TV = (Sigma_LAE/0.0115)^-0.674 + 0.103 is stated without an uncertainty on the fitted parameters or a goodness-of-fit measure. Please provide at least the fit uncertainties.
- [Table 3] The column header 'N_spec' is clear in context but the table lacks a footnote defining whether this is the number of confirmed LAEs within the peak voxels or within the projected peak region. Please define.
- [General] The paper would benefit from a short explicit statement in Section 3.1 about the number of spec-z sources per sightline cell, since the cells are only 2x2x2 cMpc; this is relevant to the reader's ability to assess when the prior is locally dominated by a single mask.
Circularity Check
No significant circularity; the reconstruction is validated against an external simulation and does not reduce to its inputs by construction.
full rationale
The central derivation is the probabilistic 3D reconstruction of Section 3.1, which explicitly assumes N(z,S_i) ≈ N_spec(z,S_i) and then assigns redshifts to photometric LAEs from that sightline-specific prior. This is a stated modeling assumption, not a hidden self-definition: the output 3D map is a kernel-smoothed combination of confirmed spec-z positions and photo-z angular positions, and the paper's claims about peaks, elongations, LAB locations, and descendant masses are outputs of that reconstruction rather than inputs. The method is tested against IllustrisTNG300-1, an external cosmological hydrodynamical simulation, by comparing reconstructed galaxy distributions to the underlying dark matter distribution via D_TV; this provides independent benchmark support. The descendant mass calibration (factor-of-two correction and 0.2–0.3 dex scatter) is derived from simulated TNG300 structures with known z=0 masses, then applied to the data — a standard simulation-based calibration, not a fit to the target result. The paper's numerous self-citations (Ramakrishnan et al. 2023, 2024, 2025; Lee et al. 2024) are used for data provenance — ODIN survey definitions, the initial 2D protocluster candidates, and LAB catalogs — and are not invoked as uniqueness theorems or as substitutes for the present analysis. No load-bearing reduction to a fitted parameter or to a self-citation chain is present. Therefore no circular step is identified.
Axiom & Free-Parameter Ledger
free parameters (7)
- Peculiar-motion mass correction factor =
~2 (multiplicative overestimation)
- Density threshold for peak identification =
top 3% of voxel density
- Minimum peak volume =
500 cMpc^3
- Voxel stability threshold =
95% of 100 reconstructions
- Gaussian smoothing scale =
2–3 cMpc (3D)
- Redshift-prior probability floor =
1% of maximum probability
- Galaxy bias b_g =
1.8
axioms (6)
- domain assumption In each sightline, the spec-z redshift distribution equals the true photo-z LAE redshift distribution (N(z,S_i) ≈ N_spec(z,S_i))
- domain assumption Galaxy overdensity is related linearly to matter overdensity: δ_g = b_g δ_m
- domain assumption TNG300 mocks faithfully represent the clustering and structure of real z≈3 LAEs/protoclusters
- standard math Steidel et al. (1998, 2000) estimator M = (1+δ_g)/b_g ρ0 V_PC
- standard math Concordance ΛCDM cosmology (h=0.7, Ω_m=0.27, Ω_Λ=0.73)
- domain assumption N501 filter selection defines the redshift slice for LAEs (z=3.093–3.155)
read the original abstract
We present a detailed study of the 3D morphology of two extended associations of multiple protoclusters at $z=3.1$. These protocluster 'complexes', designated COSMOS-z3.1-A and COSMOS-z3.1-C, are the most prominent overdensities of $z=3.1$ Ly$\alpha$ emitters (LAEs) identified in the COSMOS field by the One-hundred-deg$^2$ DECam Imaging in Narrowbands (ODIN) survey. These protocluster complexes have been followed up with extensive spectroscopy from Keck, Gemini, and DESI. Using a probabilistic method that combines photometrically selected and spectroscopically confirmed LAEs, we reconstruct the 3D structure of these complexes on scales of $\approx$50 cMpc. We validate our reconstruction method using the IllustrisTNG300-1 cosmological hydrodynamical simulation and show that it consistently outperforms approaches relying solely on spectroscopic data. The resulting 3D maps reveal that both complexes are irregular and elongated along a single axis, emphasizing the impact of sightline on our perception of structure morphology. The complexes consist of multiple density peaks, ten in COSMOS-z3.1-A and four in COSMOS-z3.1-C. The former is confirmed to be a proto-supercluster, similar to {\it Hyperion} at $z=2.4$ but observed at an even earlier epoch. Multiple `tails' connected to the cores of the density peaks are seen, likely representing cosmic filaments feeding into these extremely overdense regions. The 3D reconstructions further provide strong evidence that Ly$\alpha$ blobs preferentially reside in the outskirts of the highest density regions. Descendant mass estimates of the density peaks suggest that COSMOS-z3.1-A and COSMOS-z3.1-C will evolve to become ultra-massive structures by $z=0$, with total masses $\log(M/M_\odot) \gtrsim 15.3$, exceeding that of Coma.
Figures


Forward citations
Cited by 2 Pith papers
-
ODIN: A New Lyman Alpha Blob Selection Method, Sample, and Statistical Analysis at $z\sim3.1$
A forced-photometry subtraction pipeline that removes continuum galaxies from narrowband imaging recovers 23 diffuse Lyman-alpha blobs missed by standard LAE-based selection, yielding 112 LABs at z≈3.1 whose number de...
-
ODIN: Clustering Properties of Ly$\alpha$ Blobs at $z$ $\sim$ 2.4 and 3.1
Lyα blobs at z≈2.4 and 3.1 cluster with bias b≈4, implying host dark matter halos of ~10^12 M⊙, though a cross-correlation check gives lower values.
Reference graph
Works this paper leans on
-
[1]
2025, PhRvD, 112, 083515, doi: 10.1103/tr6y-kpc6 Adame, A
Abdul Karim, M., Aguilar, J., Ahlen, S., et al. 2025, PhRvD, 112, 083515, doi: 10.1103/tr6y-kpc6 Adame, A. G., Aguilar, J., Ahlen, S., et al. 2025, JCAP, 2025, 028, doi: 10.1088/1475-7516/2025/07/028 Aihara, H., Arimoto, N., Armstrong, R., et al. 2018a, PASJ, 70, S4, doi: 10.1093/pasj/psx066 Aihara, H., Armstrong, R., Bickerton, S., et al. 2018b, PASJ, 70...
-
[3]
the ‘Lyα’ redshift, which is further redshifted from the observed value as discussed in the following paragraph. By comparing the 3D reconstructions using these three redshift values for the same galaxies, we can assess the effect of these uncertainties in the measured redshift on our 3D reconstruction. To determine the additional velocity offset used to ...
2020
-
[1972]
in observations of galaxy clusters. At high redshift, in the vicinity of overdense but unvirialized protoclusters, the redshift space distortion is instead expected to result in the opposite effect (the Kaiser effect, Kaiser 1987), wherein the overdensity is enhanced and appears more compact along the line-of-sight due to the infalling motion of the galax...
1987
discussion (0)
Sign in with ORCID, Apple, or X to comment. Anyone can read and Pith papers without signing in.