REVIEW 4 major objections 4 minor 1 cited by
A galaxy's rotation map can pin down the lensing critical curve to sub-arcsecond precision.
Reviewed by Pith at T0; open to challenge. T0 means a machine referee read the full paper against a public rubric. the ladder, T0–T4 →
T0 review · deepseek-v4-flash
2026-08-03 20:42 UTC pith:C66ETMOP
load-bearing objection A genuinely new kinematic method for locating critical curves, but the 0.23" precision on the real Dragon Arc likely understates systematic errors from unmodeled source-plane kinematics. the 4 major comments →
Kinematic Mapping of Giant Arcs: A New Method to Locate Lensing Critical Curves
The pith
A machine-rendered reading of the paper's core claim, the machinery that carries it, and where it could break.
Core claim
The central claim is that a velocity map of a caustic-crossing giant arc can serve as a precision probe of the local lens mapping, replacing reliance on global cluster mass models. Under the assumption that the source galaxy is a rotating disk with constant circular velocity, the fold-symmetric velocity pattern observed across the arc determines where the Jacobian of the lens map becomes degenerate—i.e., where the critical curve lies. Applied to the Dragon Arc, the method recovers the critical curve to 0.23″ (1σ) from archival MUSE data, a band whose orientation is steeper than two published macro models and whose location places about two-thirds of the recently discovered microlensed stars
What carries the argument
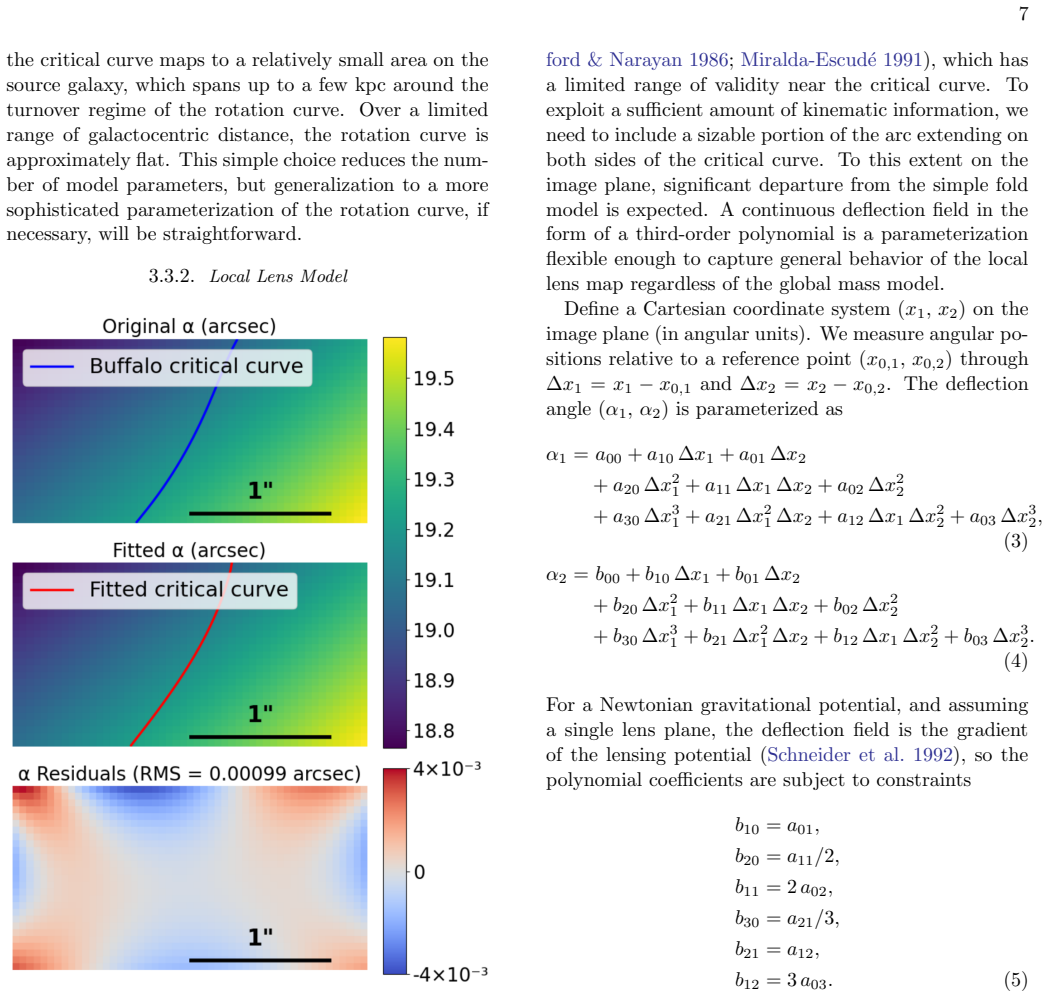
The central machinery is the coupled pair of a source-plane disk rotation model and a local lens model. The disk model has five parameters—kinematic center, inclination, position angle, and a constant circular velocity v_rot—giving the intrinsic line-of-sight velocity at any source point. The lens model is a third-order polynomial deflection field (20 coefficients reduced to 12 by requiring it derive from a lensing potential), which maps source-plane velocity onto the image plane through the ray equation. The critical curve is the zero-contour of the Jacobian determinant of the resulting lens map; the fold symmetry of the mapped velocity field supplies the constraint. Wiener deconvolution of
Load-bearing premise
The method assumes the source-plane velocity field in the fitted region is a single rotating disk with constant circular velocity and negligible random or turbulent motion, so that any real clumpiness or warps are not confused with the lens mapping.
What would settle it
A high-SNR JWST/NIRSpec IFU observation of the same Dragon Arc region that recovers a critical curve differing from the MUSE-based 0.23″ band by more than the combined uncertainties—or a recovered curve inconsistent with the surface-brightness fold symmetry—would falsify the kinematic method's core assumption.
If this is right
- Giant arcs with IFU coverage of a nebular line can now have their critical curves located to ~0.2″ from ground-based data, without input from any global mass model.
- A JWST/NIRSpec IFU observation of the same Dragon Arc region, with ~8–29 hr exposure, should improve the constraint to 0.08–0.12″, a regime where small-scale wiggles from dark-matter substructure become detectable.
- The derived critical curve places the recently discovered microlensed stars preferentially on the negative-parity side, supporting the intracluster-microlensing interpretation and distinguishing it from a diffuse-substructure origin.
- The method is general: any galaxy with measurable rotational kinematics, including quiescent galaxies via absorption lines or dusty galaxies via molecular lines, can be used as a kinematic probe of the caustic.
Where Pith is reading between the lines
- The correlated ~10 km/s residuals shown in the paper's residual map hint that the flat-rotation plus polynomial model does not fully capture the source-plane velocity field; if this systematic is absorbed by the lens parameters, the quoted 0.23″ band may understate the true uncertainty.
- A natural test is to apply the same fitting procedure to two independent emission lines (e.g., Hβ and [O III]) and require consistency of the recovered critical curve; disagreement would flag source-plane kinematic complexity.
- If a future NIRSpec observation at 0.08″ precision finds a critical curve that shifts relative to the MUSE-derived one, that shift would itself be a signal of sub-arcsecond lensing perturbations, turning a current systematic into a science measurement.
Editorial analysis
A structured set of objections, weighed in public.
Referee Report
Summary. The paper introduces a kinematic method to locate the lensing critical curve crossing a giant arc. The model combines a flat-rotation disk on the source plane (Eq. 2) with a third-order polynomial deflection field for the local lens map (Eqs. 3–4, with potential constraints in Eq. 5) and an ad hoc Gaussian smoothing scale. The method is validated on mocks built by taking MUSE Hα data of M74, imposing a constant v_rot = 200 km/s inclined disk, lensing with the BUFFALO cluster model, and simulating VLT/MUSE and JWST/NIRSpec observations (§4). Applying the method to archival VLT/MUSE Hβ data of the Dragon Arc in Abell 370 yields a 1σ half-width of 0.23″ for the critical curve (§5.1, Fig. 10). The paper also reports that the inferred critical curve places about two-thirds of the microlensed star candidates on the negative-parity side, consistent with intracluster microlensing expectations, and forecasts NIRSpec precision of 0.08–0.12″ (§5.2).
Significance. If the quoted 0.23″ uncertainty is reliable, this is a novel and valuable empirical constraint on critical-curve location that is substantially independent of global cluster lens models. The mock-generation procedure, use of real M74 data, explicit Bayesian inference with a high-dimensional lens model, and the demonstration that PSF deconvolution is critical are useful contributions. The negative-parity asymmetry test adds an independent application. However, the central claim rises and falls on whether the source-plane kinematic model is adequate for the real Dragon Arc and whether the quoted uncertainty includes correlated systematics; those points are not currently established.
major comments (4)
- [§4.2 / Eq. (9)] The mock validation is a self-consistency check, not a test of the source kinematic model. The mock source is assigned a constant v_rot=200 km/s rotator with no random component (§4.2), which is exactly the model in Eq. (2) that the likelihood in Eq. (9) fits. Unbiased recovery in Figs. 9 and 11 therefore demonstrates that the inference machinery works when the data are generated from the assumed family, but says little about the real Dragon Arc if its kinematics include warps, radial flows, clumpy/turbulent motions, or a non-flat rotation curve. This matters because the local polynomial deflection field has 12 free parameters (§3.3.2) and can partially absorb source-plane kinematic misspecification. The real-data residual map (Fig. 10) shows correlated ~10 km/s residuals on 0.5–1″ scales, which the paper attributes to possible disk-model deficiency, unrecognized lens-map distortions, or
- [§5.1 / Fig. 10] The likelihood treats individual pixels as independent with variances σ_obs,i (Eq. 9). Wiener deconvolution and the Moffat PSF introduce spatially correlated errors in the measured velocity map, and the best-fit residuals in Fig. 10 are visibly correlated on 0.5–1″ scales. Under correlated noise, the effective number of independent constraints is reduced, so the posterior width of 0.23″ is likely an underestimate of the true statistical uncertainty. The paper should either include a noise covariance matrix in the likelihood, or re-fit mock realizations with correlated noise to quantify the effect. At minimum, report the critical-curve band after inflating σ_obs by the residual correlation structure.
- [§3.3.2 / §5.1] The quoted 0.23″ result uses the imposed prior that the degenerate direction of the local lens map lies in [0°, 15°] relative to the arc elongation. The paper states that relaxing this constraint inflates the 1σ half-width to 0.30″ (§5.1). Because this constraint is derived from the observed morphology rather than from the kinematic data themselves, its uncertainty should be mapped. If the true degenerate direction lies outside the assumed range, the critical curve could be biased, not merely broadened. I ask for a sensitivity test over a wider range of this prior or a data-driven determination of the elongation angle with uncertainty.
- [§5.1 / App. A] The inferred v_rot = 304 km/s (267–329) is far above the independent Vmax = 207±7 km/s from Patrício et al. (2018), and the authors note the posterior piles up near the high end of the prior. Appendix A shows that a narrow prior v_rot = 195–205 km/s gives a similar critical-curve band, which is reassuring. However, this test only varies the value of a constant rotation velocity; it does not address the more dangerous degeneracy between the shape of the source-plane velocity field and the polynomial lens coefficients. A model with, e.g., a linearly rising rotation curve or an extra velocity-dispersion term could trade against the 12 deflection coefficients and shift the critical curve. I request a broader source-model family in the mock tests to quantify this degeneracy.
minor comments (4)
- [§3.3.1] “the line of slight passing any point” appears to be a typo for “line of sight”.
- [Eq. (1) / §3.3.2] The symbol α is used both for the Moffat scale radius in Eq. (1) and for the deflection-angle vector in Eqs. (3)–(4) and Fig. 5. These are different quantities and the notation should be disambiguated.
- [§2 / §3.2] The observing mode is called “WFM-NOAO-N” in §2 but “NFM-NOAO” in §3.2; the manuscript should use a consistent name.
- [§4.3] “Webbpsftool” should be written as “WebbPSF” for the package name, with consistent capitalization.
Circularity Check
No significant circularity: the critical-curve constraint is an empirical fit to an independent velocity map; the mock test is a conditional self-consistency check, not a circular derivation.
full rationale
The central result is an empirical Bayesian fit of a disk-rotation model plus a local polynomial deflection field to archival MUSE velocity measurements (Eq. 9, Fig. 10). The critical curve is then derived from the fitted deflection field via det A = 0 (Eq. 7), not from any prior critical-curve input. The only externally imposed lens constraint is the arc-elongation direction (§3.3.2), which is an independent morphological observable, not the target location. The mock validation (§4.2–4.4) does use the same flat-rotation source model in both data generation and inference: the mock's Doppler shifts are 'computed assuming a constant rotation curve of v_rot = 200 km/s', and the model uses Eq. (2) with constant v_rot. This makes the mock a self-consistency test of the inference pipeline and PSF treatment, not an independent certification of the source-velocity model. That is a real limitation and a systematic-risk caveat, but it is not a circular derivation: the mock recovery is not an input to the real-data result, and the real-data 0.23'' band is not statistically forced by the mock construction. The authors explicitly acknowledge the source-model deficiency and possible residuals (§5.1: 'residuals of ~10 km/s and correlated on ~0.5–1 arcsec scales', §6.2: 'Improved Disk Rotation Model'), and Appendix A shows the critical-curve result is robust to the v_rot prior. Self-citations such as Venumadhav et al. (2017), Fudamoto et al. (2025), and Diego et al. (2025a) are used for published theory, archival data, or model comparison, not as the load-bearing justification of the localization method. No equation reduces to its input by construction, and no fitted parameter is renamed as an independent prediction.
Axiom & Free-Parameter Ledger
free parameters (7)
- Disk rotation velocity v_rot =
posterior median 304 km/s; 68% CI 267-329 km/s (broad prior 150-350 km/s)
- Disk inclination i =
68% CI 57-78 deg
- Disk position angle phi =
68% CI -43 to -32 deg
- Kinematic center (RA0, DEC0) =
posterior not tabulated
- Local polynomial deflection coefficients (12) =
posterior not tabulated
- Ad hoc Gaussian smoothing width sigma =
not tabulated
- Moffat PSF parameters alpha, beta =
alpha ~ 0.5 arcsec, beta ~ 1.4
axioms (7)
- domain assumption Static gravitational lens does not change photon wavelength, producing mirror-symmetric velocity patterns across the critical curve.
- domain assumption The deflection field is the gradient of a lensing potential, imposing coefficient constraints (Eq. 5).
- ad hoc to paper A third-order polynomial deflection field adequately describes the local lens map in the ROI.
- ad hoc to paper The source galaxy's kinematics are described by a constant flat rotation curve with no random velocity component.
- domain assumption The Dragon Arc is a rotating disk with inclination 45-60 deg and H-beta traces its kinematics.
- ad hoc to paper The arc elongation direction constrains the degenerate direction of the local lens map to [0,15] deg.
- ad hoc to paper No significant dark-matter subhalo perturbations are present inside the fitted ROI.
Cite this review
Pith. "Pith review of Kinematic Mapping of Giant Arcs: A New Method to Locate Lensing Critical Curves." pith.science (2026). https://pith.science/paper/C66ETMOP
@misc{pith2026251118479,
  author       = {Pith},
  title        = {Pith review of: Kinematic Mapping of Giant Arcs: A New Method to Locate Lensing Critical Curves},
  year         = {2026},
  howpublished = {\url{https://pith.science/paper/C66ETMOP}},
  note         = {Machine review of arXiv:2511.18479}
}
read the original abstract
The vicinity of lensing critical curves features highly magnified portions of lensed galaxies. Accurate knowledge of the location and shape of the critical curve will be useful for understanding the nature of highly magnified stellar sources near critical curves and for revealing sub-galactic dark matter structures within the lens. In galaxy-cluster lenses, however, prediction of critical curves can be uncertain due to complexity in global mass modeling. We explore and validate a kinematics-based method for locating the critical curve. This method leverages the continuous line-of-sight velocity profile of the lensed galaxy mapped through integral field spectroscopy of emission lines, and combines an agnostic local lens model and a disk rotation model. Applying our method to a highly magnified region of the Dragon Arc in the Abell 370 cluster lensing field using archival VLT/MUSE IFU mapping of the H$\beta$ line, we constrain the critical curve to an uncertainty band with a half-width of 0.23" ($1\sigma$). This result reveals locations of recently detected extremely magnified stars biased toward the negative-parity side of the critical curve, as predicted for intracluster microlensing. With future JWST/NIRSpec IFU mapping of the H$\alpha$ line at SNR $\simeq$ 10 (20), uncertainty could improve to 0.12" (0.08"). A measurement of this type with sufficiently small uncertainty may reveal small-scale wiggles in the shape of the critical curve, which can arise from the lensing perturbation of sub-galactic dark matter substructure. Our approach is generally applicable to caustic-crossing giant arcs and can be incorporated into global lens modeling.
Figures




Forward citations
Cited by 1 Pith paper
-
First Statistical Study of Over 100 Magnified Stellar Events at Redshift $z \approx 0.725$ with JWST
Over 100 caustic-crossing stellar events identified in the Dragon galaxy at z≈0.725 with JWST data yield a stellar luminosity function slope β=2.18 and confirm parity asymmetry.
Reference graph
Works this paper leans on
-
[1]
Adamo, A., Bradley, L. D., Vanzella, E., et al. 2024, Nature, 632, 513, doi: 10.1038/s41586-024-07703-7
-
[2]
1986, ApJ, 310, 568, doi: 10.1086/164709
Blandford, R., & Narayan, R. 1986, ApJ, 310, 568, doi: 10.1086/164709
doi:10.1086/164709 1986
-
[3]
Broadhurst, T., Li, S. K., Alfred, A., et al. 2025, ApJL, 978, L5, doi: 10.3847/2041-8213/ad9aa8
-
[4]
Chen, W., Kelly, P. L., Diego, J. M., et al. 2019, ApJ, 881, 8, doi: 10.3847/1538-4357/ab297d 16 Figure 13.Critical curve constraints derived using a narrow prior on the rotation velocity (v rot = 195–205 km s−1). The resulting confidence band is nearly identical to that obtained with a broad prior (see Figure 10), demonstrating the robustness of the crit...
-
[5]
Choe, S., Rivera-Thorsen, T. E., Dahle, H., et al. 2024, arXiv e-prints, arXiv:2405.06953, doi: 10.48550/arXiv.2405.06953
-
[6]
2020, AJ, 159, 49, doi: 10.3847/1538-3881/ab5e83
Dai, L., & Miralda-Escud´ e, J. 2020, AJ, 159, 49, doi: 10.3847/1538-3881/ab5e83
-
[7]
Dai, L., Venumadhav, T., Kaurov, A. A., & Miralda-Escud, J. 2018, ApJ, 867, 24, doi: 10.3847/1538-4357/aae478
-
[8]
Dai, L., Kaurov, A. A., Sharon, K., et al. 2020, MNRAS, 495, 3192, doi: 10.1093/mnras/staa1355 de Blok, W. J. G., Walter, F., Brinks, E., et al. 2008, AJ, 136, 2648, doi: 10.1088/0004-6256/136/6/2648 Di Teodoro, E. M., Grillo, C., Fraternali, F., et al. 2018, MNRAS, 476, 804, doi: 10.1093/mnras/sty175
-
[9]
Diego, J. M. 2019, A&A, 625, A84, doi: 10.1051/0004-6361/201833670 17
-
[10]
Diego, J. M., Pascale, M., Kavanagh, B. J., et al. 2022, A&A, 665, A134, doi: 10.1051/0004-6361/202243605
-
[11]
M., Kaiser, N., Broadhurst, T., et al
Diego, J. M., Kaiser, N., Broadhurst, T., et al. 2018, ApJ, 857, 25, doi: 10.3847/1538-4357/aab617
-
[12]
Diego, J. M., Meena, A. K., Adams, N. J., et al. 2023a, A&A, 672, A3, doi: 10.1051/0004-6361/202245238
-
[13]
Diego, J. M., Sun, B., Yan, H., et al. 2023b, A&A, 679, A31, doi: 10.1051/0004-6361/202347556
-
[14]
Diego, J. M., Li, S. K., Meena, A. K., et al. 2024a, A&A, 681, A124, doi: 10.1051/0004-6361/202346761
-
[15]
Diego, J. M., Li, S. K., Amruth, A., et al. 2024b, A&A, 689, A167, doi: 10.1051/0004-6361/202450474
-
[16]
Diego, J. M., Sun, F., Palencia, J. M., et al. 2025a, arXiv e-prints, arXiv:2506.11207, doi: 10.48550/arXiv.2506.11207 —. 2025b, arXiv e-prints, arXiv:2506.11207, doi: 10.48550/arXiv.2506.11207
-
[17]
2025a, arXiv e-prints, arXiv:2511.11952, doi: 10.48550/arXiv.2511.11952
Eid, L., & Keeton, C. 2025a, arXiv e-prints, arXiv:2511.11952, doi: 10.48550/arXiv.2511.11952
-
[18]
Eid, L., & Keeton, C. R. 2025b, ApJ, 990, 196, doi: 10.3847/1538-4357/adf4cb
-
[19]
2022, A&A, 659, A191, doi: 10.1051/0004-6361/202141727
Emsellem, E., Schinnerer, E., Santoro, F., et al. 2022, A&A, 659, A191, doi: 10.1051/0004-6361/202141727
-
[20]
Foreman-Mackey, D., Hogg, D. W., Lang, D., & Goodman, J. 2013, Publications of the Astronomical Society of the Pacific, 125, 306–312, doi: 10.1086/670067
doi:10.1086/670067 2013
-
[21]
L., Pascale, M., Pierel, J., et al
Frye, B. L., Pascale, M., Pierel, J., et al. 2024, ApJ, 961, 171, doi: 10.3847/1538-4357/ad1034
-
[22]
Fudamoto, Y., Sun, F., Diego, J. M., et al. 2025, Nature Astronomy, 9, 428, doi: 10.1038/s41550-024-02432-3
-
[23]
Furtak, L. J., Meena, A. K., Zackrisson, E., et al. 2024, MNRAS, 527, L7, doi: 10.1093/mnrasl/slad135
-
[24]
2019, A&A, 631, A91, doi: 10.1051/0004-6361/201935896
Girard, M., Dessauges-Zavadsky, M., Combes, F., et al. 2019, A&A, 631, A91, doi: 10.1051/0004-6361/201935896
-
[25]
2024, ApJ, 973, 77, doi: 10.3847/1538-4357/ad684a
Gledhill, R., Strait, V., Desprez, G., et al. 2024, ApJ, 973, 77, doi: 10.3847/1538-4357/ad684a
-
[26]
E., Rudisel, M., Wagner, J., et al
Griffiths, R. E., Rudisel, M., Wagner, J., et al. 2021, MNRAS, 506, 1595, doi: 10.1093/mnras/stab1375
-
[27]
2024, ApJ, 964, 160, doi: 10.3847/1538-4357/ad2b6a
Han, X., & Dai, L. 2024, ApJ, 964, 160, doi: 10.3847/1538-4357/ad2b6a
-
[28]
2025, ApJ, 980, 190, doi: 10.3847/1538-4357/ada76a
Ji, L., & Dai, L. 2025, ApJ, 980, 190, doi: 10.3847/1538-4357/ada76a
-
[29]
A., Dai, L., Venumadhav, T., Miralda-Escud´ e, J., & Frye, B
Kaurov, A. A., Dai, L., Venumadhav, T., Miralda-Escud´ e, J., & Frye, B. 2019, ApJ, 880, 58, doi: 10.3847/1538-4357/ab2888
-
[30]
Kelly, P. L., Diego, J. M., Rodney, S., et al. 2018, Nature Astronomy, 2, 334, doi: 10.1038/s41550-018-0430-3
-
[31]
L., Chen, W., Alfred, A., et al
Kelly, P. L., Chen, W., Alfred, A., et al. 2022, arXiv e-prints, arXiv:2211.02670, doi: 10.48550/arXiv.2211.02670
-
[32]
J., Richard, J., Cl´ ement, B., et al
Lagattuta, D. J., Richard, J., Cl´ ement, B., et al. 2017, MNRAS, 469, 3946, doi: 10.1093/mnras/stx1079
-
[33]
Lelli, F., McGaugh, S. S., & Schombert, J. M. 2016, AJ, 152, 157, doi: 10.3847/0004-6256/152/6/157
-
[34]
Li, S. K., Diego, J. M., Meena, A. K., et al. 2025a, ApJ, 988, 178, doi: 10.3847/1538-4357/ade4bd
-
[35]
Li, S. K., Palencia, J. M., Diego, J. M., et al. 2025b, arXiv e-prints, arXiv:2506.17565, doi: 10.48550/arXiv.2506.17565
-
[36]
Lundqvist, E., Zackrisson, E., Hawcroft, C., Amarsi, A. M., & Welch, B. 2024, A&A, 690, A291, doi: 10.1051/0004-6361/202450403 Miralda-Escud´ e, J. 1991, ApJ, 379, 94, doi: 10.1086/170486 M¨ uller, C. V., & Miralda-Escud´ e, J. 2025, MNRAS, 536, 1579, doi: 10.1093/mnras/stae2652
-
[37]
Navarro, J. F., Frenk, C. S., & White, S. D. M. 1996, ApJ, 462, 563, doi: 10.1086/177173
doi:10.1086/177173 1996
-
[38]
2023, MNRAS, 524, 2883, doi: 10.1093/mnras/stad1999
Niemiec, A., Jauzac, M., Eckert, D., et al. 2023, MNRAS, 524, 2883, doi: 10.1093/mnras/stad1999
-
[39]
2018, PhRvD, 97, 023518, doi: 10.1103/PhysRevD.97.023518
Broadhurst, T. 2018, PhRvD, 97, 023518, doi: 10.1103/PhysRevD.97.023518
-
[40]
2010, Journal of the Optical Society of America
Orieux, F., Giovannelli, J.-F., & Rodet, T. 2010, Journal of the Optical Society of America. A Optics, Image Science, and Vision, 1593, doi: 10.1364/JOSAA.27.001593
-
[41]
Palencia, J. M., Diego, J. M., Kavanagh, B. J., & Mart ´ ınez-Arrizabalaga, J. 2024, A&A, 687, A81, doi: 10.1051/0004-6361/202347492
-
[42]
Palencia, J. M., Diego, J. M., Dai, L., et al. 2025, A&A, 699, A295, doi: 10.1051/0004-6361/202555447
-
[43]
2024, ApJ, 976, 166, doi: 10.3847/1538-4357/ad7732
Pascale, M., & Dai, L. 2024, ApJ, 976, 166, doi: 10.3847/1538-4357/ad7732
-
[44]
Pascale, M., Dai, L., Frye, B. L., & Beverage, A. G. 2025a, ApJL, 988, L76, doi: 10.3847/2041-8213/aded93
-
[45]
Pascale, M., Dai, L., McKee, C. F., & Tsang, B. T. H. 2023, ApJ, 957, 77, doi: 10.3847/1538-4357/acf75c
-
[46]
Pascale, M., Frye, B. L., Pierel, J. D. R., et al. 2025b, ApJ, 979, 13, doi: 10.3847/1538-4357/ad9928 Patr ´ ıcio, V., Richard, J., Carton, D., et al. 2018, MNRAS, 477, 18, doi: 10.1093/mnras/sty555
-
[47]
Perera, D., Gilman, D., Williams, L. L. R., et al. 2025, arXiv e-prints, arXiv:2511.04748. https://arxiv.org/abs/2511.04748
arXiv 2025
-
[48]
D., Sivaramakrishnan, A., Lajoie, C.-P., et al
Perrin, M. D., Sivaramakrishnan, A., Lajoie, C.-P., et al. 2014, in Society of Photo-Optical Instrumentation Engineers (SPIE) Conference Series, Vol. 9143, Space Telescopes and Instrumentation 2014: Optical, Infrared, and Millimeter Wave, ed. J. M. Oschmann, Jr., M. Clampin, G. G. Fazio, & H. A. MacEwen, 91433X, doi: 10.1117/12.2056689 18
-
[49]
Pierel, J. D. R., Newman, A. B., Dhawan, S., et al. 2024, ApJL, 967, L37, doi: 10.3847/2041-8213/ad4648
-
[50]
V., Bergamini, P., Meneghetti, M., et al
Pignataro, G. V., Bergamini, P., Meneghetti, M., et al. 2021, arXiv e-prints, arXiv:2106.10286. https://arxiv.org/abs/2106.10286
Pith/arXiv arXiv 2021
-
[51]
Pontoppidan, K. M., Pickering, T. E., Laidler, V. G., et al. 2016, Observatory Operations: Strategies, Processes, and Systems VI, 9910, 991016, doi: 10.1117/12.2231768
-
[52]
P., Limousin, M., Edge, A., & Jullo, E
Richard, J., Kneib, J. P., Limousin, M., Edge, A., & Jullo, E. 2010, MNRAS, 402, L44, doi: 10.1111/j.1745-3933.2009.00796.x
arXiv 2010
-
[53]
A., Balestra, I., Bradac, M., et al
Rodney, S. A., Balestra, I., Bradac, M., et al. 2018, Nature Astronomy, 2, 324, doi: 10.1038/s41550-018-0405-4
-
[54]
Schneider, P., Ehlers, J., & Falco, E. E. 1992, Gravitational Lenses, doi: 10.1007/978-3-662-03758-4
-
[55]
2016, MNRAS, 461, 2126, doi: 10.1093/mnras/stw1433
Liesenborgs, J. 2016, MNRAS, 461, 2126, doi: 10.1093/mnras/stw1433
-
[56]
Sharon, K., Mahler, G., Rivera-Thorsen, T. E., et al. 2022, arXiv e-prints, arXiv:2209.03417. https://arxiv.org/abs/2209.03417
Pith/arXiv arXiv 2022
-
[57]
2001, ARA&A, 39, 137, doi: 10.1146/annurev.astro.39.1.137
Sofue, Y., & Rubin, V. 2001, ARA&A, 39, 137, doi: 10.1146/annurev.astro.39.1.137
-
[58]
H., Acebron, A., Grillo, C., et al
Suyu, S. H., Acebron, A., Grillo, C., et al. 2025, arXiv e-prints, arXiv:2509.12319, doi: 10.48550/arXiv.2509.12319
-
[59]
Trujillo, I., Aguerri, J. A. L., Cepa, J., & Guti´ errez, C. M. 2001, MNRAS, 328, 977, doi: 10.1046/j.1365-8711.2001.04937.x
arXiv 2001
-
[60]
2020, MNRAS, 499, L67, doi: 10.1093/mnrasl/slaa163
Vanzella, E., Meneghetti, M., Pastorello, A., et al. 2020, MNRAS, 499, L67, doi: 10.1093/mnrasl/slaa163
-
[61]
2023, ApJ, 945, 53, doi: 10.3847/1538-4357/acb59a
Vanzella, E., Claeyssens, A., Welch, B., et al. 2023, ApJ, 945, 53, doi: 10.3847/1538-4357/acb59a
-
[62]
2017, ApJ, 850, 49, doi: 10.3847/1538-4357/aa9575
Venumadhav, T., Dai, L., & Miralda-Escud´ e, J. 2017, ApJ, 850, 49, doi: 10.3847/1538-4357/aa9575
-
[63]
2017, A&A, 601, A131, doi: 10.1051/0004-6361/201630200
Wagner, J. 2017, A&A, 601, A131, doi: 10.1051/0004-6361/201630200
-
[64]
2019, Universe, 5, 177, doi: 10.3390/universe5070177 —
Wagner, J. 2019, Universe, 5, 177, doi: 10.3390/universe5070177 —. 2022, Astron. Astrophys., 663, A157, doi: 10.1051/0004-6361/202243562
-
[65]
2024, arXiv e-prints, arXiv:2404.08094, doi: 10.48550/arXiv.2404.08094
Weisenbach, L., Anguita, T., Miralda-Escud´ e, J., et al. 2024, arXiv e-prints, arXiv:2404.08094, doi: 10.48550/arXiv.2404.08094
-
[66]
Welch, B., Coe, D., Diego, J. M., et al. 2022, Nature, 603, 815, doi: 10.1038/s41586-022-04449-y
-
[67]
Wiener, N. 1949, Extrapolation, Interpolation, and Smoothing of Stationary Time Series: With Engineering Applications (The MIT Press), doi: 10.7551/mitpress/2946.001.0001
-
[68]
Williams, L. L. R., Kelly, P. L., Treu, T., et al. 2023, arXiv e-prints, arXiv:2304.06064, doi: 10.48550/arXiv.2304.06064
work page internal anchor Pith review Pith/arXiv arXiv doi:10.48550/arxiv.2304.06064 2023
-
[69]
Windhorst, R. A., Timmes, F. X., Wyithe, J. S. B., et al. 2018, ApJS, 234, 41, doi: 10.3847/1538-4365/aaa760
-
[70]
2023, ApJS, 269, 43, doi: 10.3847/1538-4365/ad0298
Yan, H., Ma, Z., Sun, B., et al. 2023, ApJS, 269, 43, doi: 10.3847/1538-4365/ad0298
-
[71]
Young, A. J., Keeton, C. R., & Baker, A. J. 2022, ApJ, 929, 6, doi: 10.3847/1538-4357/ac59af
-
[72]
2025, ApJ, 987, 94, doi: 10.3847/1538-4357/add72a
Zheng, W., Fu, X., Chen, Y., et al. 2025, ApJ, 987, 94, doi: 10.3847/1538-4357/add72a
-
[73]
2009, MNRAS, 396, 1985, doi: 10.1111/j.1365-2966.2009.14899.x
Zitrin, A., Broadhurst, T., Umetsu, K., et al. 2009, MNRAS, 396, 1985, doi: 10.1111/j.1365-2966.2009.14899.x
arXiv 2009
-
[74]
2013, ApJL, 762, L30, doi: 10.1088/2041-8205/762/2/L30
Zitrin, A., Meneghetti, M., Umetsu, K., et al. 2013, ApJL, 762, L30, doi: 10.1088/2041-8205/762/2/L30
discussion (0)
Sign in with ORCID, Apple, or X to comment. Anyone can read and Pith papers without signing in.