Predicting Time Pressure of Powered Two-Wheeler Riders for Proactive Safety Interventions
Pith reviewed 2026-05-16 17:10 UTC · model grok-4.3
The pith
A compact neural network classifies rider time pressure from vehicle sensors at 91.5 percent accuracy and raises collision risk forecasts when added as input.
A machine-rendered reading of the paper's core claim, the machinery that carries it, and where it could break.
Core claim
MotoTimePressure achieves 91.53 percent accuracy and 98.93 percent ROC AUC on time pressure classification and, when its outputs are used as features, lifts collision risk accuracy for Informer from 91.25 percent to 93.51 percent and for TimesNet from 92.10 percent to 93.90 percent, approaching oracle performance.
What carries the argument
MotoTimePressure, a neural network that applies convolutional preprocessing, dual-stage temporal attention, and Squeeze-and-Excitation recalibration to 63-feature multivariate time-series sequences to classify rider time pressure states.
If this is right
- Predicted time pressure states can trigger adaptive alerts, haptic feedback, and speed guidance in real time.
- Collision risk models gain accuracy by treating time pressure as an observable feature rather than an unobserved confounder.
- Thresholded pressure levels enable V2I signaling that adjusts infrastructure responses to rider stress.
- The same pipeline supports the Safe System Approach by treating cognitive load as a modifiable crash factor.
Where Pith is reading between the lines
- Deployment would require testing on uncontrolled public roads with diverse rider populations to confirm the controlled results generalize.
- The model's small size and fast CPU inference make on-vehicle implementation feasible in current motorcycle electronics.
- Extending the output from three discrete classes to a continuous pressure score could support finer-grained interventions.
Load-bearing premise
The controlled laboratory induction of no, low, and high time pressure conditions produces cognitive states that match those experienced by riders in ordinary traffic.
What would settle it
An on-road field study that records physiological stress markers alongside the same vehicle sensors and checks whether the model still classifies accurately and still improves collision forecasts.
Figures


read the original abstract
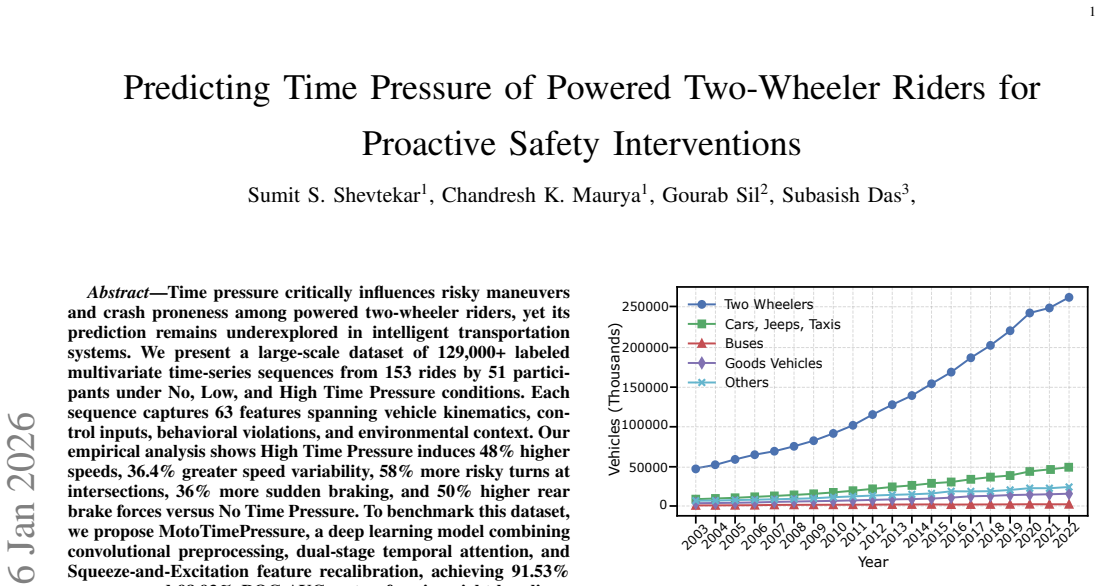
Time pressure critically influences risky maneuvers and crash proneness among powered two-wheeler riders, yet its prediction remains underexplored in intelligent transportation systems. We present a large-scale dataset of 129,000+ labeled multivariate time-series sequences from 153 rides by 51 participants under No, Low, and High Time Pressure conditions. Each sequence captures 63 features spanning vehicle kinematics, control inputs, behavioral violations, and environmental context. Our empirical analysis shows High Time Pressure induces 48% higher speeds, 36.4% greater speed variability, 58% more risky turns at intersections, 36% more sudden braking, and 50% higher rear brake forces versus No Time Pressure. To benchmark this dataset, we propose MotoTimePressure, a deep learning model combining convolutional preprocessing, dual-stage temporal attention, and Squeeze-and-Excitation feature recalibration, achieving 91.53% accuracy and 98.93% ROC AUC, outperforming six baselines, with only 172K parameters, 0.66 MB model size, and 0.21 ms inference on CPU. Since time pressure cannot be directly measured in real time, we demonstrate its utility in collision prediction and threshold determination. Using MTPS-predicted time pressure as a feature improves collision risk accuracy for both Informer (91.25% to 93.51%) and TimesNet (92.10% to 93.90%), approaching oracle performance (93.72% and 94.06%, respectively). Thresholded time pressure states capture rider cognitive stress and enable proactive ITS interventions, including adaptive alerts, haptic feedback, V2I signaling, and speed guidance, supporting safer two-wheeler mobility under the Safe System Approach.
Editorial analysis
A structured set of objections, weighed in public.
Referee Report
Summary. The paper introduces a dataset of over 129,000 labeled multivariate time-series sequences from 51 participants across 153 rides under controlled No, Low, and High Time Pressure conditions. It proposes the MotoTimePressure model combining convolutional preprocessing, dual-stage temporal attention, and Squeeze-and-Excitation recalibration, reporting 91.53% accuracy and 98.93% ROC AUC on time pressure classification while outperforming six baselines with a compact 172K-parameter architecture. The work further demonstrates that using the model's predictions as an additive feature improves collision risk prediction accuracy for Informer (91.25% to 93.51%) and TimesNet (92.10% to 93.90%), approaching oracle performance, and discusses applications for proactive ITS interventions.
Significance. If the empirical results hold under proper validation, the lightweight model and documented behavioral shifts (e.g., 48% higher speeds under high time pressure) provide a practical route to real-time cognitive stress estimation for two-wheeler safety systems. The additive gains in downstream collision models constitute a concrete, quantifiable contribution. However, the controlled induction setting without physiological or naturalistic corroboration limits the strength of claims about broader applicability to real-world proactive interventions.
major comments (3)
- [Section 3] Section 3 (Dataset Construction): The train/validation/test splitting procedure for the 129k sequences is not specified (e.g., whether splits are ride-wise, participant-wise, or random), leaving open the possibility of temporal or inter-ride leakage that would directly affect the reliability of the 91.53% accuracy and 98.93% AUC figures.
- [Section 5.2] Section 5.2 (Collision Prediction Results): The reported accuracy lifts (Informer +2.26 pp, TimesNet +1.8 pp) are presented without statistical significance tests, confidence intervals, or ablation controls, so it is impossible to determine whether the gains over the base models are robust or within expected variance.
- [Section 6] Section 6 (Discussion and Limitations): The utility argument for proactive interventions assumes that the induced No/Low/High time pressure conditions produce kinematic signatures equivalent to real-world rider stress, yet no physiological ground truth (HRV, pupil metrics, or NASA-TLX) or cross-context validation is supplied; this assumption is load-bearing for the claimed downstream safety applications.
minor comments (3)
- [Section 3] The exact total number of sequences after any exclusion rules and the precise definition of the 63 features should be stated explicitly in the dataset section for reproducibility.
- [Section 4] Baseline tables would be clearer if they included per-fold standard deviations or multiple random seeds rather than single-point metrics.
- [Section 2] A few sentences on related work in time-series attention for transportation safety (e.g., recent Informer/TimesNet extensions) would strengthen the positioning.
Simulated Author's Rebuttal
We thank the referee for the constructive and detailed feedback. We address each major comment point by point below, providing the strongest honest defense possible. Revisions will be made to clarify procedures and strengthen statistical reporting, while expanding the discussion of limitations.
read point-by-point responses
-
Referee: [Section 3] Section 3 (Dataset Construction): The train/validation/test splitting procedure for the 129k sequences is not specified (e.g., whether splits are ride-wise, participant-wise, or random), leaving open the possibility of temporal or inter-ride leakage that would directly affect the reliability of the 91.53% accuracy and 98.93% AUC figures.
Authors: We appreciate this observation on a critical methodological detail. The splits were performed participant-wise (with all sequences from a given rider assigned to only one partition) to eliminate inter-participant and temporal leakage; rides were not split across sets. We will revise Section 3 to explicitly document this participant-wise strategy, the 70/15/15 proportions, and confirmation that sequences within each ride remain intact. revision: yes
-
Referee: [Section 5.2] Section 5.2 (Collision Prediction Results): The reported accuracy lifts (Informer +2.26 pp, TimesNet +1.8 pp) are presented without statistical significance tests, confidence intervals, or ablation controls, so it is impossible to determine whether the gains over the base models are robust or within expected variance.
Authors: We agree that formal statistical validation strengthens the claims. In the revised version we will add McNemar’s tests for paired accuracy comparisons, report 95% confidence intervals on the improvements, and include ablation results that isolate the contribution of the predicted time-pressure feature. revision: yes
-
Referee: [Section 6] Section 6 (Discussion and Limitations): The utility argument for proactive interventions assumes that the induced No/Low/High time pressure conditions produce kinematic signatures equivalent to real-world rider stress, yet no physiological ground truth (HRV, pupil metrics, or NASA-TLX) or cross-context validation is supplied; this assumption is load-bearing for the claimed downstream safety applications.
Authors: This is a fair critique of external validity. The study follows established controlled time-pressure induction protocols; we cannot retroactively collect physiological measures. We will expand Section 6 to explicitly acknowledge the absence of physiological corroboration, cite supporting literature on kinematic correlates of time pressure, and qualify the downstream safety claims accordingly while noting the observed collision-prediction gains as indirect evidence of utility. revision: partial
Circularity Check
No significant circularity in derivation chain
full rationale
The paper trains MotoTimePressure on experimentally induced time-pressure labels (No/Low/High) collected from 153 rides and evaluates classification accuracy plus downstream collision-prediction gains on held-out sequences. These are standard supervised results and additive-feature ablations; the reported numbers (91.53% accuracy, 98.93% AUC, 1.8–2.26 pp lifts) are not defined in terms of the fitted outputs themselves, nor do any equations or self-citations reduce the central claims to tautologies. The derivation chain therefore remains independent of its own fitted values.
Axiom & Free-Parameter Ledger
free parameters (1)
- Time pressure condition thresholds
axioms (1)
- domain assumption Induced experimental conditions map to genuine rider time pressure states
Lean theorems connected to this paper
-
IndisputableMonolith/Cost/FunctionalEquation.lean (J-uniqueness, Aczél classification)washburn_uniqueness_aczel unclear?
unclearRelation between the paper passage and the cited Recognition theorem.
MTPS architecture... convolutional preprocessing, dual-stage temporal attention, and Squeeze-and-Excitation... 91.53% accuracy... improves Informer... from 91.25% to 93.51%
-
IndisputableMonolith/Foundation/RealityFromDistinction.leanreality_from_one_distinction unclear?
unclearRelation between the paper passage and the cited Recognition theorem.
129,000+ labeled multivariate time-series sequences... 63 features... vehicle kinematics, control inputs
What do these tags mean?
- matches
- The paper's claim is directly supported by a theorem in the formal canon.
- supports
- The theorem supports part of the paper's argument, but the paper may add assumptions or extra steps.
- extends
- The paper goes beyond the formal theorem; the theorem is a base layer rather than the whole result.
- uses
- The paper appears to rely on the theorem as machinery.
- contradicts
- The paper's claim conflicts with a theorem or certificate in the canon.
- unclear
- Pith found a possible connection, but the passage is too broad, indirect, or ambiguous to say the theorem truly supports the claim.
Reference graph
Works this paper leans on
-
[1]
M.A. Abdel-Aty and R. Pemmanaboina. Calibrating a real-time traffic crash-prediction model using archived weather and its traffic data.IEEE Transactions on Intelligent Transportation Systems, 7(2):167–174, 2006
work page 2006
-
[2]
C ¸ .˙I. Acı, G. Mutlu, M. Ozen, and M. Acı. Enhanced multi-class driver injury severity prediction using a hybrid deep learning and random forest approach.Applied Sciences, 15(3):1586, 2025
work page 2025
-
[3]
Charles Atombo, Chaozhong Wu, Ming Zhong, and Hui Zhang. Inves- tigating the motivational factors influencing drivers intentions to unsafe driving behaviours: Speeding and overtaking violations.Transportation Research Part F: Traffic Psychology and Behaviour, 43:104–121, 2016
work page 2016
-
[4]
Ferhat Attal, Abderrahmane Boubezoul, Latifa Oukhellou, and St ´ephane Espi´e. Powered two-wheeler riding pattern recognition using a machine- learning framework.IEEE Transactions on Intelligent Transportation Systems, 16(1):475–487, 2015
work page 2015
-
[5]
Ferhat Attal, Abderrahmane Boubezoul, Allou Sam ´e, Latifa Oukhellou, and St ´ephane Espi ´e. Powered two-wheelers critical events detection and recognition using data-driven approaches.IEEE Transactions on Intelligent Transportation Systems, 19(12):4011–4022, 2018
work page 2018
-
[6]
Venkatesh Balasubramanian and Sathish Kumar Sivasankaran. Analysis of factors associated with exceeding lawful speed traffic violations in indian metropolitan city.Journal of Transportation Safety & Security, 13(2):206–222, 2021
work page 2021
-
[7]
Emmanouil N. Barmpounakis, Eleni I. Vlahogianni, and John C. Golias. Intelligent transportation systems and powered two wheelers traffic. IEEE Transactions on Intelligent Transportation Systems, 17(4):908– 916, 2016
work page 2016
-
[8]
Mirco Bartolozzi, Abderrahmane Boubezoul, Samir Bouaziz, Giovanni Savino, and St ´ephane Espi ´e. Data-driven methodology for the investi- gation of riding dynamics: A motorcycle case study.IEEE Transactions on Intelligent Transportation Systems, 24(9):10224–10237, 2023
work page 2023
-
[9]
Kavi Bhalla and Dinesh Mohan. Safety of young children on motorized two-wheelers around the world: A review of the global epidemiological evidence.IATSS Research, 38(2):83–91, 2015
work page 2015
-
[10]
Ghulam H. Bham and Ming C. Leu. A driving simulator study to analyze the effects of portable changeable message signs on mean speeds of drivers.Journal of Transportation Safety & Security, 10(1-2):45–71, 2018
work page 2018
-
[11]
Mohamed Yacine Bouaouni, Rayane Ait Ali Yahia, and Abderrahmane Boubezoul. Driving-pattern identification and event detection based on an unsupervised learning framework: Case of a motorcycle-riding simulator.IEEE Access, 9:158456–158469, 2021. 13
work page 2021
-
[12]
Soukaina Bouhsissin, Nawal Sael, Faouzia Benabbou, and Abdelfettah Soultana. Enhancing machine learning algorithm performance through feature selection for driver behavior classification.International Journal of Electrical and Computer Engineering Systems, 35(1):354–365, 2023
work page 2023
-
[13]
Andre M. Carrington, Douglas G. Manuel, and Paul W.. Fieguth. Deep roc analysis and auc as balanced average accuracy, for improved classifier selection, audit and explanation.IEEE Transactions on Pattern Analysis and Machine Intelligence, 45(1):329–341, January 2023
work page 2023
-
[14]
Shivam Singh Chouhan, Ankit Kathuria, and Ravi Sekhar Chalumuri. Powered two-wheeler riding behavior and strategies to improve safety: A review.Journal of Traffic and Transportation Engineering (English Edition), 11(6):1378–1400, 2024
work page 2024
-
[15]
T. Garefalakis, E. Michelaraki, S. Roussou, et al. Predicting risky driving behavior with classification algorithms: results from a large-scale field- trial and simulator experiment.European Transport Research Review, 16:65, 2024
work page 2024
-
[16]
Velaga, and Sabyasachee Mishra
Monik Gupta, Nishant Mukund Pawar, Nagendra R. Velaga, and Sabyasachee Mishra. Modeling distraction tendency of motorized two- wheeler drivers in time pressure situations.Safety Science, 154:105820, 2022
work page 2022
-
[17]
Monik Gupta and Nagendra R. Velaga. Motorized two-wheeler riders’ rear brake application in sudden hazardous event of animal crossing. Transportation Letters, 16(10):1268–1275, 2024
work page 2024
-
[18]
E.C. Hedberg and Stephanie Ayers. The power of a paired t-test with a covariate.Social Science Research, 50:277–291, 2015
work page 2015
-
[19]
Lanlan Huang, Junkai Zhao, Bing Zhu, Hao Chen, and Seppe Vanden Broucke. An experimental investigation of calibration techniques for imbalanced data.IEEE Access, 8:127343–127352, 2020
work page 2020
-
[20]
Adam: A Method for Stochastic Optimization
Diederik P Kingma and Jimmy Ba. Adam: A method for stochastic optimization.arXiv preprint arXiv:1412.6980, 2014
work page internal anchor Pith review Pith/arXiv arXiv 2014
-
[21]
Xiaoqiang Kong, Subasish Das, Kartikeya Jha, and Yunlong Zhang. Understanding speeding behavior from naturalistic driving data: Apply- ing classification based association rule mining.Accident Analysis & Prevention, 144, 2020
work page 2020
-
[22]
Sumie Leung, Rodney J. Croft, Melinda L. Jackson, Mark E. Howard, and Raymond J. Mckenzie. A comparison of the effect of mobile phone use and alcohol consumption on driving simulation performance.Traffic Injury Prevention, 13(6):566–574, 2012
work page 2012
-
[23]
Xiaomeng Li, Oscar Oviedo-Trespalacios, Andry Rakotonirainy, and Xuedong Yan. Collision risk management of cognitively distracted drivers in a car-following situation.Transportation Research Part F: Traffic Psychology and Behaviour, 60:288–298, 2019
work page 2019
-
[24]
Calibrating multimodal learning
Huan Ma, Qingyang Zhang, Changqing Zhang, Bingzhe Wu, Huazhu Fu, Joey Tianyi Zhou, and Qinghua Hu. Calibrating multimodal learning. In Proceedings of the 40th International Conference on Machine Learning. JMLR.org, 2023
work page 2023
-
[25]
Rajeev J. Michael, Manoj K. Sharma, Seema Mehrotra, Humera Banu, Rajesh Kumar, Paulomi M. Sudhir, and Neelima Chakrabarthy. Incli- nation to speeding and its correlates among two-wheeler riding indian youth.Industrial Psychiatry Journal, 23(2):105–110, 2014
work page 2014
-
[26]
Road transport year book 2022–2023, 2023
Ministry of Road Transport and Highways. Road transport year book 2022–2023, 2023
work page 2022
-
[27]
Road transport year book 2023–2024, 2024
Ministry of Road Transport and Highways. Road transport year book 2023–2024, 2024
work page 2023
-
[28]
Road Transport Year Book 2021–2022, 2022
Ministry of Road Transport and Highways (MORTH). Road Transport Year Book 2021–2022, 2022
work page 2021
-
[29]
Mithun Mohan and Satish Chandra. Capacity estimation of unsignalized intersections under heterogeneous traffic conditions.Canadian Journal of Civil Engineering, 47(6):651–662, 2020
work page 2020
-
[30]
Satyajit Mondal and Ankit Gupta. Evaluation of driver accelera- tion/deceleration behavior at signalized intersections using vehicle tra- jectory data.Transportation Letters, 15(4):350–362, 2023
work page 2023
-
[31]
Road accidents in india – 2019
MORTH. Road accidents in india – 2019. Technical report, Transport Research Wing, MoRTH, 2019
work page 2019
-
[32]
Road accidents in india – 2020
MoRTH. Road accidents in india – 2020. Technical report, Transport Research Wing, MoRTH, 2020
work page 2020
-
[33]
Road accidents in india – 2021
MoRTH. Road accidents in india – 2021. Technical report, Transport Research Wing, MoRTH, 2021
work page 2021
-
[34]
Road accidents in india – 2022
MORTH. Road accidents in india – 2022. Technical report, Transport Research Wing, MoRTH, 2022
work page 2022
-
[35]
Road accidents in india – 2023
MoRTH. Road accidents in india – 2023. Technical report, Transport Research Wing, MoRTH, 2023
work page 2023
-
[36]
Ministry of road transport & highway (morth), 2024-25.Road Transport Year Book 2024–2025, 2025
MORTH. Ministry of road transport & highway (morth), 2024-25.Road Transport Year Book 2024–2025, 2025
work page 2024
-
[37]
Gopal R. Patil and Digvijay S. Pawar. Temporal and spatial gap acceptance for minor road at uncontrolled intersections in india.Trans- portation Research Record, 2461(1):129–136, 2014
work page 2014
-
[38]
Ioannis Pavlidis, Malcolm Dcosta, Salah Taamneh, Michael Manser, Thomas Ferris, Rainer Wunderlich, Ergun Akleman, and Panagiotis Tsiamyrtzis. Dissecting driver behaviors under cognitive, emotional, sensorimotor, and mixed stressors.Scientific Reports, 6:25651, 2016
work page 2016
-
[39]
Nishant Mukund Pawar, Rashmeet Kaur Khanuja, Pushpa Choudhary, and Nagendra R. Velaga. Modelling braking behaviour and accident probability of drivers under increasing time pressure conditions.Acci- dent Analysis & Prevention, 136:105401, 2020
work page 2020
-
[40]
Nishant Mukund Pawar and Nagendra R. Velaga. Analyzing the impact of time pressure on drivers’ safety by assessing gap-acceptance behavior at un-signalized intersections.Safety Science, 147:105582, 2022
work page 2022
-
[41]
Velaga, and Sabyasachee Mishra
Nishant Mukund Pawar, Nagendra R. Velaga, and Sabyasachee Mishra. Impact of time pressure on acceleration behavior and crossing decision at the onset of yellow signal.Transportation Research Part F: Traffic Psychology and Behaviour, 87:1–18, 2022
work page 2022
-
[42]
Nishant Mukund Pawar, Nagendra R. Velaga, and R.B. Sharmila. Exploring behavioral validity of driving simulator under time pressure driving conditions of professional drivers.Transportation Research Part F: Traffic Psychology and Behaviour, 89:29–52, 2022
work page 2022
-
[43]
Sivaramakrishnan Rajaraman, Praveen Ganesan, and Sameer An- tani. Deep learning model calibration for improving performance in class-imbalanced medical image classification tasks.PLOS ONE, 17(1):e0262838, 2022
work page 2022
-
[44]
E. Rendon-Velez, P. M . van Leeuwen, R. Happee, I. Horv ´ath, W.F. van der Vegte, and J.C.F. de Winter. The effects of time pressure on driver performance and physiological activity: A driving simulator study. Transportation Research Part F: Traffic Psychology and Behaviour, 41:150–169, 2016
work page 2016
-
[45]
The Hindu Staff Reporter. Rash driving, fall in income, more pressure: Behind the scenes of 10-minute delivery.The Hindu, March 2022
work page 2022
-
[46]
Delivery race brings road safety risks in india.The Jakarta Post, January 2022
Reuters. Delivery race brings road safety risks in india.The Jakarta Post, January 2022
work page 2022
-
[47]
Philipp Rodegast, Steffen Maier, Jonas Kneifl, and J ¨org Fehr. On using machine learning algorithms for motorcycle collision detection.Discover Applied Sciences, 6(6):326, 2024
work page 2024
-
[48]
Manlika Seefong, Panuwat Wisutwattanasak, and Rattanaporn Kasemsri. A study of motorcycle riders related to speeding behavior in thailand’s industrial zones.Scientific Reports, 14(1):29889, 2024
work page 2024
-
[49]
Ishant Sharma, Monik Gupta, Sabyasachee Mishra, and Nagendra R. Velaga. Exploring the impact of time pressure on motorized two-wheeler riders’ over-speeding behavior.Transportation Letters, 17(4):595–611, 2025
work page 2025
-
[50]
Fortune India Staff. Racing against time: Quick commerce is pushing delivery riders to the edge, claims study.Fortune India, February 2025
work page 2025
-
[51]
Linda Steg and Annemarie van Brussel. Accidents, aberrant behaviours, and speeding of young moped riders.Transportation Research Part F: Traffic Psychology and Behaviour, 12(6):503–511, 2009
work page 2009
-
[52]
Simplifying hypergraph neural networks.arXiv preprint arXiv:2402.05569, 2024
Bohan Tang, Zexi Liu, Keyue Jiang, Siheng Chen, and Xiaowen Dong. Simplifying hypergraph neural networks.arXiv preprint arXiv:2402.05569, 2024
-
[53]
Technotrove motorcycle driving sim- ulator
Technotrove-Simulation-Pvt-Ltd. Technotrove motorcycle driving sim- ulator
-
[54]
S. Thundiyil, S.S. Shalamzari, J. Picone, and S. McKenzie. Transformers for modeling long-term dependencies in time series data: A review. In2023 IEEE Signal Processing in Medicine and Biology Symposium (SPMB), pages 1–5, 2023
work page 2023
-
[55]
Global status report on road safety, 2023.World Health Organization., 2023
WHO. Global status report on road safety, 2023.World Health Organization., 2023
work page 2023
-
[56]
Binomial proportion confidence interval – wilson score interval, 2025
Wikipedia contributors. Binomial proportion confidence interval – wilson score interval, 2025. Accessed: 2025-09-09
work page 2025
-
[57]
Ailing Zeng, Muxi Chen, Lei Zhang, and Qiang Xu. Are trans- formers effective for time series forecasting? InProceedings of the Thirty-Seventh AAAI Conference on AI and Thirty-Fifth Confer- ence on Innovative Applications of AI and Thirteenth Symposium, AAAI’23/IAAI’23/EAAI’23. AAAI Press, 2023
work page 2023
-
[58]
Variance analysis of factors that affected traffic safety in highway work zones
Yanyan Zhang, Shunying Zhu, Hong Wang, Yanjie Hu, and Bing Liu. Variance analysis of factors that affected traffic safety in highway work zones. pages 72–81. American Society of Civil Engineers, 2012
work page 2012
-
[59]
Anye Zhou, Yongyang Liu, Einat Tenenboim, Shubham Agrawal, and Srinivas Peeta. Car-following behavior of human-driven vehicles in mixed-flow traffic: A driving simulator study.IEEE Transactions on Intelligent Vehicles, 8(4):2661–2673, 2023
work page 2023
-
[60]
Informer: Beyond efficient transformer for long sequence time-series forecasting
Haoyi Zhou, Shanghang Zhang, Jieqi Peng, Shuai Zhang, Jianxin Li, Hui Xiong, and Wancai Zhang. Informer: Beyond efficient transformer for long sequence time-series forecasting. InProceedings of the AAAI Conference on Artificial Intelligence, volume 35, pages 11106–11115, 2021
work page 2021
discussion (0)
Sign in with ORCID, Apple, or X to comment. Anyone can read and Pith papers without signing in.