REVIEW 3 major objections 5 minor 9 references
ChartAttack: Testing the Vulnerability of LLMs to Malicious Prompting in Chart Generation
T0 review · 3 major / 5 minor · reviewed 2026-08-03 · deepseek-v4-flash
Pith's one-line read This paper shows that code-based multimodal LLMs can be prompted to generate misleading charts, and that these charts reduce chart question-answering accuracy for both automated and human readers.
desk verdict A solid first systematic attack benchmark for LLM chart generation, but the headline drops are measured on a pre-filtered set of successful attacks and the human pilot is too weak to carry the generalization claim. read the letter →
The pith
A machine-rendered reading of the paper's core claim, the machinery that carries it, and where it could break.
The reading
What carries the argument
The central object is the chart JSON annotation—a structured description of the data values, axes, scales, colors, stacked/3D flags, and categories—because a misleader is a minimal edit to that annotation that changes how the chart is drawn without changing the data it encodes. Around this, ChartAttack has two modules: a demonstration-selection module that retrieves example question–annotation pairs whose misleader sets match the current instance, and a misleader-generator module, an instruction-tuned code-based MLLM prompted few-shot to output a JSON snippet plus a matching misleading answer. The same annotation representation lets the charts be re-rendered with a plotting library and lets
What would settle it
Re-run the evaluation on the full, unfiltered set of chart-question pairs—including charts where the three construction models did not already agree on the correct answer or converge on the same wrong answer—and compare the average accuracy drop; if the drop largely disappears, the reported effect is an artifact of the filtering criterion rather than a general property of the generated charts.
Extended reading notes
Core claim
The central claim is that jailbreak-style prompting can automate the production of misleading charts at scale, and that the resulting charts are effective against both automated chart readers and human readers. ChartAttack works at the level of chart annotations: the attacker prompts a code-based multimodal LLM to output a minimal Python-dictionary snippet that applies one of eleven known misleaders—perceptual changes like inverted axes, 3D, stacked bars, misrepresentation through scaling factors, or truncated axes—without touching the data table. The misleading answer is a plausible but incorrect answer computed under the misleader, and the framework uses retrieval of similar demonstrations
Load-bearing premise
The headline accuracy drops are computed on instances that were selected by a majority-of-three-model filter that keeps only charts where the models answer correctly before the misleader and converge on a single wrong answer after it, with the assumption that those consistent wrong answers are caused by the misleader; if that filter selects for model-specific or atypical charts, the 17.2/11.9/20.2-point drops overstate the attack on ordinary charts.
Editorial extensions
If this is right
- Anyone who can send a prompt can turn a legitimate chart-generation model into a source of misleading charts; the attack requires only JSON annotations and publicly available models.
- Prompt-level defenses are not enough: adding a system guard that tells the model to avoid distortions leaves the attack success rate essentially unchanged.
- Training on AttackViz can harden models: fine-tuning raises accuracy on misleading charts by 8.4 points, with a small drop on correct charts, so robustness can be bought but not for free.
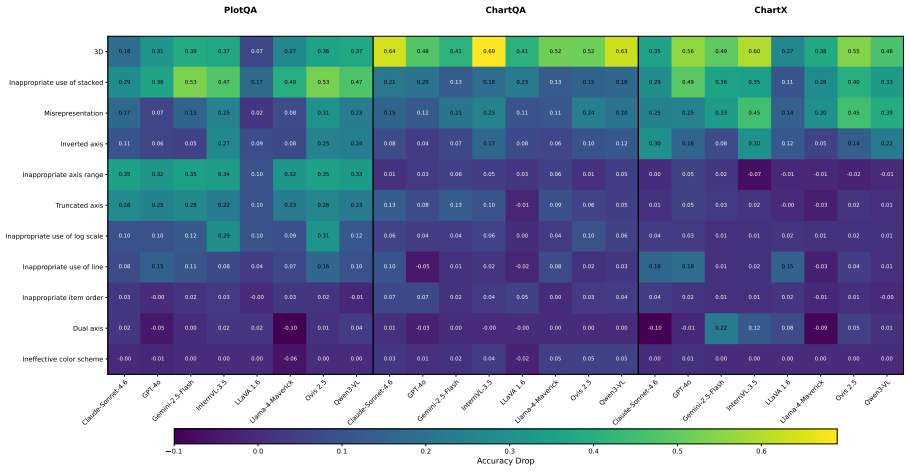
- Defenders should focus on perceptual misleaders—3D, stacking, log scales, misrepresentation—which cause the largest drops, while color-only changes are nearly harmless.
- If chart generation is embedded in automated analysis or reporting pipelines, misleading charts can silently bias downstream decisions, since both models and humans are affected.
Reading between the lines
- The reported effectiveness is measured on instances that survived a model-in-the-loop filter, so an unfiltered deployment may show smaller drops; a direct comparison on randomly selected charts would tell whether the attack generalizes or mainly exploits the selection criterion.
- As chart-reading models improve, absolute vulnerability may increase rather than shrink: the paper's strongest models show the largest accuracy drops, which undercuts the intuition that better comprehension will automatically neutralize design-level manipulation.
- Because the attack edits a library-agnostic JSON annotation, the same framework should transfer to other chart renderers and chart types beyond bar and line charts; extending it to pie, map, or custom visual encodings is a natural test.
- A robust defense might not be model-level at all: comparing the rendered chart against data-derived invariants (e.g., axis range, scale, and value-label consistency) could catch most misleaders independently of the reader model.
Editorial analysis
A structured set of objections, weighed in public.
Referee Report
Summary. The paper introduces ChartAttack, a framework that prompts code-based MLLMs to modify chart JSON annotations using eleven misleader techniques, and AttackViz, a chart QA dataset built from PlotQA, ChartQA, and ChartX. It reports that misleading charts reduce relaxed QA accuracy by 17.2 pp in-domain and 11.9 pp cross-domain across 16 open-weight and 3 closed models, and reports a 20.2 pp accuracy drop in a 12-participant human pilot. The paper also tests a prompt-based guard, finds it ineffective, and shows that QLoRA fine-tuning on AttackViz improves accuracy on the AttackViz test set by 8.44 pp. The central claim is that code-based MLLMs can be misused to generate misleading charts at scale that deceive both machines and humans.
Significance. The problem is timely and the paper is among the first to systematically study the dual-use risk of MLLM-based chart generation. If the reported effect sizes hold on an unfiltered sample of generated charts, the contribution is substantial: it demonstrates a concrete vulnerability, provides a reusable dataset, and gives initial evidence that fine-tuning can mitigate the attack. The detailed prompt and ablation appendices, public code/data, and evaluation across diverse model families are strengths. The main weakness is that the headline numbers are computed on AttackViz, whose construction uses a model-in-the-loop filter that pre-selects misleaders already known to fool the construction models; the current results should therefore be interpreted as conditional on that selection process, not as unconditional attack success rates.
major comments (3)
- [Section 4 (Evaluation and filtering process); Appendix D] The headline accuracy drops are measured on a corpus from which instances are retained only if the majority of the three construction models (QwenVL 2.5-32B, InternVL 3.0-38B, KimiVL-A3B) answer correctly on the original chart and incorrectly on the misleading chart, and the 'misleading answer' is itself the average or majority vote of those same models' incorrect responses. Appendix D states the working assumption that consistent incorrect responses are 'induced by the applied misleader.' This is a model-in-the-loop selection step, so the benchmark does not sample the typical effect of a misleader; it samples misleaders that were already effective against the construction models. Evaluating held-out models on these pre-screened instances does not remove the selection bias. The 17.2/11.9 pp figures, and the human 20.2 pp figure, may therefore overstate the effect on unfiltered charts. Pl
- [Section 5.3; Appendix F; Table 11] The human experiment uses 12 participants total (6 per arm), with no inferential test or confidence interval. Individual accuracies vary widely (e.g., 48% and 96% in the control group; 28.1% and 80.2% in the experimental group), so the 20.2 pp between-group gap is not established as attributable to the charts. In addition, the Introduction reports a 13.3 pp drop while the Abstract and Section 5.3 report 20.2 pp; this internal inconsistency must be reconciled. The human study should be presented as exploratory, with appropriate uncertainty, or the claim should be softened.
- [Section 5.1 (Deception rate) and Section 5.2] The paper distinguishes between accuracy degradation and the intended misleading answer. The deception-rate metrics require exact match to the constructed misleading answer, which is produced by averaging or majority-voting the construction models' incorrect responses. Because the construction models define the target, the measured rates (e.g., 11.2% conditional deception on originally-correct answers) may understate or confound the effect for models that do not share the construction models' error patterns. More importantly, the accuracy drop on the filtered set could reflect generic difficulty (e.g., charts becoming harder to read) rather than the specific misleading interpretation. Please report, for each model, the proportion of originally-correct answers that shift to (i) the constructed misleading answer, (ii) another incorrect answer, and (iii) no answer; this would support the cl
minor comments (5)
- [Abstract and Introduction] The human accuracy drop is reported as 20.2 pp in the Abstract and Section 5.3, but 13.3 pp in the Introduction. Please reconcile the numbers.
- [Figure 4] The caption says 'the 11 evaluated models,' but the figure and Section 5.1 list 16 open-weight plus 3 closed models. Please correct the count.
- [Table 1] The row for '3D' does not have a misleader name in the left column, unlike the other rows. Add a label such as '3D effect.'
- [Section 5.1] Relaxed accuracy is cited to prior work but not formally defined in the main text. Give a one-sentence definition.
- [Table 3] The 'None' row represents correct charts, not a misleader. Consider separating it from the misleader rows or labeling it as 'Correct chart' to avoid confusion.
Circularity Check
Deception-rate targets are defined by the construction models' own consensus, and headline drops are measured on a filter pre-screened for attack success — partial, not total, circularity.
-
fitted input called prediction
[Section 4 (Evaluation and filtering process); Section 5.1 (Evaluation metrics); Appendix D]
"The final misleading answer is obtained by averaging incorrect numeric responses or taking the majority vote for textual responses. ... Deception rate (originally correct) measures the percentage of instances where a model answers correctly on the correct chart but outputs the misleading answer on the misleading chart."
The exact-match target of the deception-rate metric is the consensus answer defined by the three construction models (QwenVL 2.5-32B, InternVL 3.0-38B, KimiVL-A3B) — the same models whose majority-correct/incorrect votes determine which instances enter AttackViz. A held-out model counts as 'deceived' only if it reproduces that averaged/majority-voted answer; a model that is equally misled but outputs any other wrong answer scores as not deceived. Appendix D supplies the missing premise: 'we assume that consistent incorrect responses across models are induced by the applied misleader.' That assumption is what converts agreement-with-construction-consensus into 'deception,' so the reported deception rates (11.2%/11.7%/14.9%) are partially forced by the construction target rather than measuri
-
fitted input called prediction
[Section 4 (Evaluation and filtering process) vs. Abstract; Limitations]
"We retain instances where the majority of models answer correctly on the original chart but incorrectly on the misleading chart."
The benchmark is built by retaining only charts that already fool the three construction models, and the same filtered pool feeds every headline estimate: the 17.2 pp in-domain drop, the 11.9 pp cross-domain drops (ChartQA/ChartX go 'through the same pipeline'), and the 20.2 pp human drop (Appendix F samples 'misleading instances generated by ChartAttack' from this pool). The drops are conditional on pre-screened attack success, not estimates for unfiltered charts. The Limitations passage acknowledges the filter ('the dataset may emphasize patterns effective against the models used during construction'), but the defense — testing 'a separate set of more recent models' — addresses model generalization, not instance selection, since every test instance was filtered against the construction f
full rationale
ChartAttack's core measurements are not fully reducible to their inputs, but two evaluation choices import the construction machinery directly into the reported numbers. (1) Definitional target: AttackViz's 'induced incorrect answers' are the average/majority vote of the three construction models, and the deception-rate metrics require exact match to this constructed answer; Appendix D's attribution assumption is the only link between consensus-agreement and causation. (2) Pre-screened benchmark: the retention filter guarantees every test instance is one where the misleading chart already flips the construction models from correct to incorrect, so the 17.2/11.9/20.2 pp drops are conditional on known attack success. The accuracy-drop measurements themselves are genuine — relaxed accuracy versus ground-truth answers on held-out models, plus a real (small) human pilot — so the central claim has independent content. Self-citations (Tonglet et al. 2025a/b) are not load-bearing; no uniqueness theorem is invoked; the misleader taxonomy is externally sourced (Lo et al. 2022). The circularity is partial: part of one metric (deception rate) reduces to agreement with the construction consensus, and the headline effect sizes are inflated by a filter that pre-selects attackable instances.
Assumptions & free parameters
free parameters (6)
- Number of few-shot demonstrations k =
5
- Consistency filter thresholds =
numeric std < 0.5; textual majority identical
- Subsampling size per chart type =
400 images per partition
- Misleader inclusion thresholds =
>=5 occurrences; 13 criteria-satisfying misleaders merged to 11
- Misleading answer aggregation =
average of numeric incorrect responses; majority vote for textual
- LoRA fine-tuning hyperparameters =
r=32, alpha=64, dropout=0.05, lr=5e-5, 3 epochs
assumptions (6)
- ad hoc to paper Consistent incorrect responses across construction models are induced by the applied misleader, not by noise or ambiguity
- domain assumption The Lo et al. (2022) taxonomy of misleaders is a valid and complete enumeration of design-level deception techniques for bar/line charts
- domain assumption Charts rendered from simplified JSON annotations faithfully reproduce the original PlotQA/ChartQA/ChartX charts' data and format
- ad hoc to paper Majority-vote accuracy of the three construction MLLMs is a reliable measure of whether a chart is answerable and whether a misleader is effective
- domain assumption Relaxed accuracy is an appropriate metric for chart QA and for attack effectiveness
- ad hoc to paper With 12 participants, the observed human accuracy difference is attributable to the misleading charts rather than individual differences
invented entities (1)
-
AttackViz dataset
independent evidence
Cite this review
Pith. "Pith review of ChartAttack: Testing the Vulnerability of LLMs to Malicious Prompting in Chart Generation." pith.science (2026). https://pith.science/paper/CX2652DJ
@misc{pith2026260112983,
  author       = {Pith},
  title        = {Pith review of: ChartAttack: Testing the Vulnerability of LLMs to Malicious Prompting in Chart Generation},
  year         = {2026},
  howpublished = {\url{https://pith.science/paper/CX2652DJ}},
  note         = {Machine review of arXiv:2601.12983}
}
read the original abstract
Multimodal large language models (MLLMs) are increasingly used to automate chart generation from data tables, improving analysis and reporting efficiency while introducing new misuse risks. We present ChartAttack, a framework for evaluating how MLLMs can generate misleading charts at scale by injecting misleaders into chart designs to induce incorrect interpretations. We also introduce AttackViz, a chart question-answering (QA) dataset where each (chart specification, QA) pair is labeled with effective misleaders and their induced incorrect answers. ChartAttack significantly degrades QA performance, reducing MLLM accuracy by 17.2 points in-domain and 11.9 cross-domain. A controlled human study shows that misleading charts generated by ChartAttack reduce human chart QA performance. Finally, we demonstrate that AttackViz can be used to fine-tune MLLMs to improve robustness against misleading charts. Our findings highlight an urgent need for robustness and security considerations in the design, evaluation, and deployment of MLLM-based chart generation systems. We make our code and data publicly available.
Figures


Figures from the paper (11 more)




Reference graph
Works this paper leans on
-
[5]
Jailbroken: How does llm safety training fail? InAdvances in Neural Information Processing Sys- tems, volume 36, pages 80079–80110. Curran Asso- ciates, Inc. Thomas Wolf, Lysandre Debut, Victor Sanh, Julien Chaumond, Clement Delangue, Anthony Moi, Pier- ric Cistac, Tim Rault, Rémi Louf, Morgan Funtow- icz, and 1 others. 2019. Huggingface’s transformers: S...
arXiv 2019
-
[6]
Renqiu Xia, Hancheng Ye, Xiangchao Yan, Qi Liu, Hongbin Zhou, Zijun Chen, Botian Shi, Junchi Yan, and Bo Zhang
Communicating health information with visual displays.Nature Medicine, 29(5):1085–1091. Renqiu Xia, Hancheng Ye, Xiangchao Yan, Qi Liu, Hongbin Zhou, Zijun Chen, Botian Shi, Junchi Yan, and Bo Zhang. 2025. Chartx and chartvlm: A ver- satile benchmark and foundation model for compli- cated chart reasoning.IEEE Transactions on Image Processing, 34:7436–7447...
2025
-
[7]
Qwen3 technical report.arXiv preprint arXiv:2505.09388. Brenda W. Yang, Camila Vargas Restrepo, Matthew L. Stanley, and Elizabeth J. Marsh. 2021. Truncat- ing bar graphs persistently misleads viewers.Jour- nal of Applied Research in Memory and Cognition, 10(2):298–311. Youliang Yuan, Wenxiang Jiao, Wenxuan Wang, Jen tse Huang, Pinjia He, Shuming Shi, and ...
arXiv 2021
-
[8]
InThe Twelfth International Conference on Learning Representations
GPT-4 is too smart to be safe: Stealthy chat with LLMs via cipher. InThe Twelfth International Conference on Learning Representations. 12 Xingchen Zeng, Haichuan Lin, Yilin Ye, and Wei Zeng. 2025. Advancing multimodal large lan- guage models in chart question answering with visualization-referenced instruction tuning.IEEE Transactions on Visualization and...
arXiv 2025
-
[1994]
InText Retrieval Conference
Okapi at trec-3. InText Retrieval Conference. Dorsaf Sallami, Yuan-Chen Chang, and Esma Aïmeur
-
[2022]
3D effect
(see Table 1), and the prompt is therefore chart-type-specific, including only misleaders ap- plicable to the given chart type; the context is fur- ther defined by the dataset and retrieved examples, avoiding incompatible or ill-defined manipulations. The prompt also enforces minimal modifications, referring to changes only in the annotation fields strict...
2019
-
[2023]
Leo Yu-Ho Lo, Ayush Gupta, Kento Shigyo, Aoyu Wu, Enrico Bertini, and Huamin Qu
Why change my design: Explaining poorly constructed visualization designs with explorable ex- planations.IEEE Transactions on Visualization and Computer Graphics, 30(1):955–964. Leo Yu-Ho Lo, Ayush Gupta, Kento Shigyo, Aoyu Wu, Enrico Bertini, and Huamin Qu. 2022. Misinformed by visualization: What do we learn from misinfor- mative visualizations?Computer...
arXiv 2022
-
[2024]
Shuyu Shen, Sirong Lu, Leixian Shen, Zhonghua Sheng, Nan Tang, and Yuyu Luo
From deception to detection: The dual roles of large language models in fake news.Preprint, arXiv:2409.17416. Shuyu Shen, Sirong Lu, Leixian Shen, Zhonghua Sheng, Nan Tang, and Yuyu Luo. 2024. Ask humans or ai? exploring their roles in visualization troubleshooting. Preprint, arXiv:2412.07673. Aivin V Solatorio. 2024. Gistembed: Guided in-sample selection...
arXiv 2024
Show all 9 references
-
[2025]
i came across a junk
Automated pipeline for detecting and analyz- ing misleading visual elements. In2025 IEEE 18th Pacific Visualization Conference (PacificVis), pages 346–351. Xingyu Lan and Yu Liu. 2025. “i came across a junk”: Understanding design flaws of data visualization from the public’s p...
2025
Reviewed August 3, 2026 · model on record in the stance chip above.
Discussion (0). Continue with ORCID to comment.