REVIEW 3 major objections 6 minor 1 cited by
Critical Evaluation of Studies Alleging Evidence for Technosignatures in the POSS1-E Photographic Plates
T0 review · 3 major / 6 minor · reviewed 2026-08-03 · deepseek-v4-flash
Pith's one-line read This paper argues that the reported deficit of features inside Earth's shadow and the correlation with nuclear tests vanish when the most vetted public dataset is used and the survey's true observation days are counted.
desk verdict Solid critique of the Villarroel et al. shadow/technosignature claims, with a few inferential steps resting on the unpublished V dataset. read the letter →
The pith
A machine-rendered reading of the paper's core claim, the machinery that carries it, and where it could break.
The reading
What carries the argument
The load-bearing tool is the 'remainder' set R, the most aggressively filtered public subset of the larger feature catalog, built by removing features near catalog stars, asteroids, variables, objects seen in only one scan, and other artifacts. Because R and the unpublished dataset share the same ~1.4% southern-hemisphere fraction, the authors use R as a stand-in for the unpublished data. Against R they run three quantitative tests: a cell-based shadow simulation comparing in-shadow fractions, a Clark-Evans nearest-neighbor ratio to measure clustering against complete spatial randomness, and radial density profiles to show edge and corner excesses. The temporal test uses the plate metadata t
What would settle it
A direct re-release of the exact unpublished dataset V with plate IDs and timestamps would settle the question: if, after matching to plates, feature days appear on substantially fewer than ~290 of the 312 northern observation days, or if the in-shadow fraction in V falls below the 1.36% seen in R, the artifact explanation would need revision. Conversely, microscopic inspection of a random sample of V features showing star-like 3-D silver-grain structure and no catalog counterpart could revive the transient interpretation.
Extended reading notes
Core claim
Working from the most heavily filtered public subset of the POSS1-E feature catalog (set R, N=5,399), the authors find 66 of the 4,866 unambiguously plate-assigned features inside the simulated geosynchronous shadow — 1.36%, versus 0.82% expected from the shadowed fraction of the survey area — so the reported 30-75% deficit is absent. After matching features to plates and normalizing by the 312 nights on which the survey actually exposed northern-sky plates (not the 2,718 calendar days of the study window), the feature/nuclear-test correlation drops to p≈0.1 with a relative risk of 1.07; 96% of the overlap between feature days and test windows is just the observing schedule. The paper also s
Load-bearing premise
The analysis assumes the unpublished dataset V, on which the original claims were based, has the same sampling properties as the public R and W sets — particularly that southern-hemisphere plates were skipped and that the 312 northern observation days define the relevant exposure window; if the original authors sampled V differently, the normalization that erases the nuclear-test correlation would be weakened.
Editorial extensions
If this is right
- The reported 30-75% deficit of features inside Earth's shadow, cited as evidence for geosynchronous glinting objects, is not reproduced with the vetted remainder set; the in-shadow fraction (1.36%) actually exceeds the expected 0.82%.
- The claimed feature/nuclear-test correlation (χ²=6.94, p=0.008 in the original study) becomes p≈0.1 with relative risk 1.07 when normalized by the 312 true northern-sky observation days.
- Because features appear on 93-99% of actual observation days, their occurrence is almost completely determined by when the survey observed the sky, not by nuclear testing.
- A third of the candidate aligned-cluster features match catalog stars within 2 arcseconds, so they were not confidently distinguished from known objects.
- The spatial patterns — edge/corner excess, right-ascension stripes, and plate-boundary-related clusters — indicate plate and digitization artifacts rather than sky sources.
Reading between the lines
- Beyond the paper's own claims, the results imply that any future archival-plate search for artificial satellites should require independent per-object validation (e.g., microscopic inspection of the emulsion) rather than relying on statistical correlations over unvalidated catalogs.
- The conspicuous deficit band in right ascension (roughly 87°-107°) that survives aggressive filtering suggests a systematic pipeline effect; identifying its cause would provide a corrected background model for any reanalysis of these plates.
- A testable extension would compare feature detection days against other weather-dependent activities, such as aerial surveys or artillery tests, to see whether the apparent seasonal coupling with nuclear tests is generic rather than specific.
- Since even the vetted R set still contains 4-5% clear stars and artifacts, the cleanest available catalog needs per-object morphology screening before any single candidate can be used as evidence of a real optical transient.
Editorial analysis
A structured set of objections, weighed in public.
Referee Report
Summary. This paper re-examines claims by Villarroel et al. (2025c) and Bruehl & Villarroel (2025) that unidentified features in POSS1-E plates show an Earth-shadow deficit, linear clusters, and correlations with nuclear tests. Using two public datasets, R (N=5,399, the most aggressively filtered set) and W (N=171,753), plus the MAPS celestial-object set M, the authors argue that the assumed uniform-random background is false: SPF density rises toward plate edges, and large-scale stripes and voids appear in W and R. They report no shadow deficit in R (f_obs=1.36% vs f_exp=0.82%), and find that the nuclear-test correlation becomes insignificant (p≈0.1) when normalized by 312 actual POSS1 observation days rather than 2,718 calendar days; they further show that 54 of the 56 days overlapping nuclear-test windows are pure schedule overlap. They also document inconsistent definitions of the unpublished dataset V and identify a circular argument in the target papers.
Significance. If the quantitative claims hold, the paper materially weakens the technosignature interpretation of the POSS1-E feature sets and provides a useful cautionary case study for archival-plate searches. Its strengths are the use of public datasets, the careful documentation of dataset inconsistencies in Appendix A, and the transparent schedule-overlap argument, which is simple and robust. The historical GRB-plate review is also well placed and supports the demand for independent validation. However, the strongest quantitative refutations—the p=0.1 nuclear-test result and the shadow comparison—are computed on the public dataset R, not on the unpublished target dataset V, and rely on inferred sampling properties of V. The paper would be more convincing with a direct test on V or a thorough sensitivity analysis; as written, the normalization claims are conditional on an unverified assumption.
major comments (3)
- [§6.2, Table 3] The 'loses significance' claim (p=0.1) is computed with the public dataset R, while the target correlation is for the unpublished V. The 312-day denominator is inferred from the 1.4% southern-hemisphere fraction in R and W (§3.2) and then used to remove 56 southern-only observation days. Appendix A shows that V's construction is inconsistently defined (five different statements), so its effective observation window is not known. If V sampled southern-only plates, or excluded some northern plates, the denominator and p-value could change. The statement in §3.1 that access to V is 'not necessary' is therefore too strong: it is sufficient for exposing dataset inconsistencies, but not for the quantitative normalization claim. Please obtain V (one author had a copy) or provide a sensitivity analysis over plausible V constructions and denominators.
- [§5] The in-shadow test is reported as f_obs=66/4866=1.36% versus f_exp=0.82%, with no uncertainty, confidence interval, or significance test. The expected fraction depends on simulation choices (30×30 cell grid, 8.5° in-shadow radius, plate-assignment radius) that are not varied. Although f_obs exceeds f_exp, the paper's claim that the reported deficit is 'not present' needs a formal test (e.g., Poisson with plate-level overdispersion) to be comparable to the 2.5–22σ claims in the target study. Moreover, the calculation is on R, not V; because V is unpublished and ambiguously defined, it cannot exclude a V-specific deficit if V's plate selection differs from R's. Please add a significance/sensitivity analysis and limit the scope of the conclusion to R (or V once obtained).
- [§4.2–4.4] The argument that the uniform-random null is false relies heavily on set W, which is a subset of S selected by proximity to NeoWISE objects. The paper calls W 'a dense, uniform-random sampling of S' without demonstrating that the NeoWISE positions used for matching are spatially uniform. Clustering in W could in principle reflect structure in the infrared catalog or in the matching procedure. The MAPS set M is a useful control for celestial sources but is not matched to NeoWISE. Please verify the uniformity of the sampling positions (e.g., compare W to a random subset of NeoWISE positions) or re-derive the nonuniformity conclusion directly from R's intra-plate density profiles (which are shown but not formally tested). This matters because the invalidation of the Poisson null is load-bearing for rejecting the target's shadow significance.
minor comments (6)
- [§3.2, 'SetV' paragraph] V is given as N=107,185, whereas Table 1 and §6 use N=107,875. Please correct the typo.
- [§5] 'solid angle (in degrees)' should read 'square degrees'.
- [§4.2 and §5] Plate 090R has 2,149 SPFs with an average of 257.5 per plate (§4.1); it is therefore ~8.3 times the average, not 'nearly 20 times the average'.
- [§8, item 5] The statement 'SPFs are found on 310 of the 312 observations days' conflicts with §6.2, where R has 289 unique days and W has 307; state that this refers to V and reconcile the numbers.
- [§6.1, Table 3] Specify which statistical test produced p=0.1 (Fisher exact, chi-square with/without Yates) and report the test statistic; the text mentions Chi-Square=6.94 for the original but not for the recalculation.
- [§4.1 and §6.1] Consider releasing the plate-assignment and shadow-simulation code to make the analysis fully reproducible; the current text lists parameters but not the algorithms.
Circularity Check
No circularity found: the paper's re-analysis is self-contained and tests public datasets against external plate metadata; the V-proxy inference is an extrapolation, not a circular reduction.
full rationale
This paper is a critical re-analysis, not a derivation that assumes its conclusion. Its central quantitative claims are direct empirical tests on publicly available datasets R and W, combined with external POSS1 plate metadata and nuclear-test date sources. The shadow comparison (f_obs = 66/4,866 = 1.36% vs f_exp = 0.82%) is computed from R and a geometric simulation; it has no fitted parameters and does not presuppose the absence of a deficit. The nuclear-test correlation is recomputed on R with the denominator replaced by the actual 312 northern-hemisphere observation days derived from the POSS1 plate list; Table 3 transparently states 'Dataset used R' rather than V, so this is not a prediction disguised as a fit. The only mild concern is the inference that unpublished dataset V shares R/W sampling properties (e.g., the ~1.4% southern-hemisphere fraction and the exclusion of southern-only observation days). That is an extrapolation from reported V sizes and public dataset statistics, and the paper explicitly reports the conservative 368-day alternative as well; it is not circular because the inference is not defined in terms of the conclusion it supports. Self-citations in the introduction (e.g., Watters et al. 2023, Knuth et al. 2025) are contextual and not load-bearing for any derivation. No circular step can be exhibited, so the appropriate score is 0.
Assumptions & free parameters
free parameters (3)
- plate_matching_radius =
3 deg in declination
- in_shadow_radius =
8.5 deg at GSO altitude
- shadow_cell_grid =
30x30 cells per plate
assumptions (5)
- domain assumption W is a dense, uniform-random sample of S
- domain assumption R is the appropriate proxy for testing the in-shadow deficit
- domain assumption Emulsion-defect rates from Greiner 1987 and Varady & Hudec 1992 apply to POSS1 103a-E copy negatives
- domain assumption M features are likely celestial objects
- domain assumption POSS1 plate metadata from STScI accurately represents observation days
Cite this review
Pith. "Pith review of Critical Evaluation of Studies Alleging Evidence for Technosignatures in the POSS1-E Photographic Plates." pith.science (2026). https://pith.science/paper/UWI3OMLM
@misc{pith2026260121946,
  author       = {Pith},
  title        = {Pith review of: Critical Evaluation of Studies Alleging Evidence for Technosignatures in the POSS1-E Photographic Plates},
  year         = {2026},
  howpublished = {\url{https://pith.science/paper/UWI3OMLM}},
  note         = {Machine review of arXiv:2601.21946}
}
read the original abstract
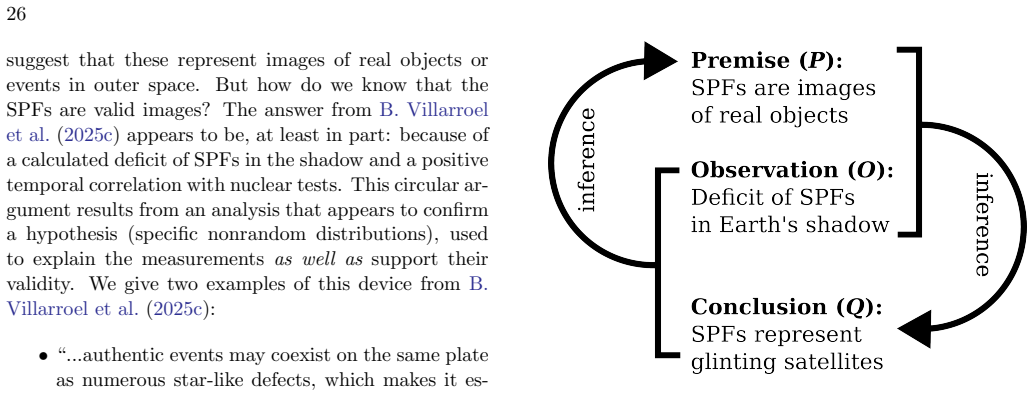
Recent studies by B. Villarroel et al. have assembled and analysed datasets of unidentified features measured from digital scans of pre-Sputnik photographic plates. We have examined the claims in these papers using two previously published datasets that are closely related to those used in the Villarroel et al. studies. For these datasets, the assumption of a spatially uniform-random background distribution of features, essential to the Earth shadow analysis, is shown to be false. After finding the null distribution of feature count deviations from the background, we find no statistically significant deficit in the shadow. We find that the reported correlation between the timing of feature observations and nuclear tests becomes insignificant after properly normalizing by the relevant number of observation days, and is almost completely determined by the observation schedule of the Palomar telescope. We uncover important inconsistencies in the definitions of the datasets used in these studies, as well as the use of unvalidated datasets containing catalogue stars, scan artefacts, and plate defects. We find an overall gradual increase in number density of features toward the corners and edges of plates, as well as examples of (i) empty north-south strips that span multiple plates; (ii) clusters and voids having geometric shapes; and (iii) amorphous clusters. We also highlight a circular argument used in these studies, that leverages the results of an inferential analysis to justify conclusions about the origin of the features as well as the validity of the measurements. Finally, we also review the literature concerning historical searches for optical transients in photographic plates corresponding to gamma ray bursts (GRBs); following decades of work, researchers were unable to make a confident identification of a GRB-associated optical transient.
Figures


Figures from the paper (9 more)



Forward citations
Cited by 1 Pith paper
-
Mysterious Transients in the Palomar Observatory Sky Survey (POSS-1) as profound manifestation of the Dark Matter physics
The paper identifies Palomar mysterious transients as flashes from spallation of axion quark nugget dark matter hitting the atmosphere, with rates and features claimed consistent with VASCO observations.
Reference graph
Works this paper leans on
-
[1]
, " * write output.state after.block = add.period write newline
ENTRY address archivePrefix author booktitle chapter doi edition editor eprint howpublished institution journal key month number organization pages publisher school series title misctitle type volume year version url label extra.label sort.label short.list INTEGERS output.state before.all mid.sentence after.sentence after.block FUNCTION init.state.consts ...
-
[2]
write newline
" write newline "" before.all 'output.state := FUNCTION format.url url empty "" new.block "" url * "" * if FUNCTION format.eprint eprint empty "" archivePrefix empty "" archivePrefix "arXiv" = new.block " " eprint * " " * new.block " " eprint * " " * if if if FUNCTION format.doi doi empty "" " " doi * " " * if FUNCTION format.pid doi empty eprint empty ur...
-
[3]
thebibliography [1] 20pt to REFERENCES 6pt =0pt \@twocolumntrue 12pt -12pt 10pt plus 3pt =0pt =0pt =1pt plus 1pt =0pt =0pt -12pt =13pt plus 1pt =20pt =13pt plus 1pt \@M =10000 =-1.0em =0pt =0pt 0pt =0pt =1.0em @enumiv\@empty 10000 10000 `\.\@m \@noitemerr \@latex@warning Empty `thebibliography' environment \@ifnextchar \@reference \@latexerr Missing key o...
arXiv 2017
Reviewed August 3, 2026 · model on record in the stance chip above.
Discussion (0). Continue with ORCID to comment.