DAVIS: OOD Detection via Dominant Activations and Variance for Increased Separation
Pith reviewed 2026-05-16 09:52 UTC · model grok-4.3
The pith
Adding channel-wise variance and dominant activations to features after global average pooling improves out-of-distribution detection.
A machine-rendered reading of the paper's core claim, the machinery that carries it, and where it could break.
Core claim
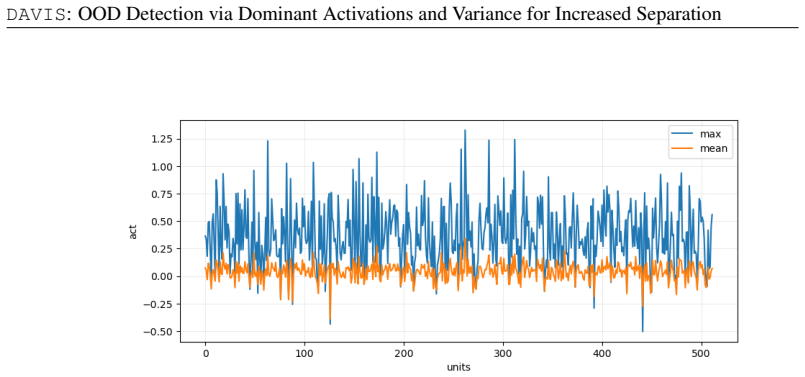
The paper claims that the channel-wise variance and the dominant (maximum) activation values present in activation maps before global average pooling are highly discriminative for OOD detection. Concatenating these two statistics to the standard GAP-derived feature vector enriches the representation, reduces information loss, and yields substantially better separation between in-distribution and out-of-distribution inputs when measured by FPR95 on CIFAR-10, CIFAR-100, and ImageNet-1k.
What carries the argument
DAVIS augmentation that appends per-channel variance and maximum activation values to the penultimate feature vector to restore statistics discarded by global average pooling.
If this is right
- FPR95 drops by 48% on CIFAR-10 with ResNet-18 and by 38% on CIFAR-100 with ResNet-34.
- A 27% reduction appears on ImageNet-1k with MobileNet-v2.
- The same enrichment works across ResNet, DenseNet, and EfficientNet without architecture-specific tuning.
- The improvement supplies a concrete reason to move beyond mean-only summaries in post-hoc OOD methods.
Where Pith is reading between the lines
- The same channel statistics might help other representation-based safety tasks such as domain-shift detection or adversarial-example flagging.
- Selecting or weighting only the most informative channels could further reduce the added dimensionality.
- If pooling loss is the root issue, then architectures that avoid global average pooling entirely may already enjoy some of the benefit DAVIS tries to restore.
Load-bearing premise
Channel-wise variance and dominant activations remain reliably discriminative for OOD inputs when simply concatenated to the GAP vector, without creating new failure modes or requiring any retraining.
What would settle it
Running the same OOD detectors on the same benchmarks with and without the added variance-plus-maximum features and finding no reduction, or an increase, in FPR95 would falsify the central claim.
Figures




read the original abstract
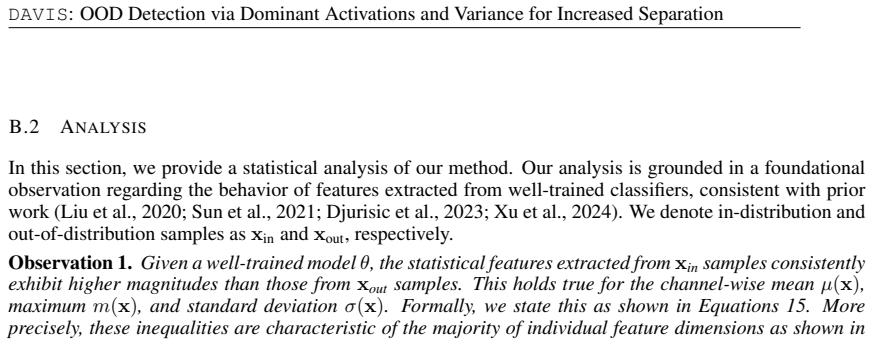
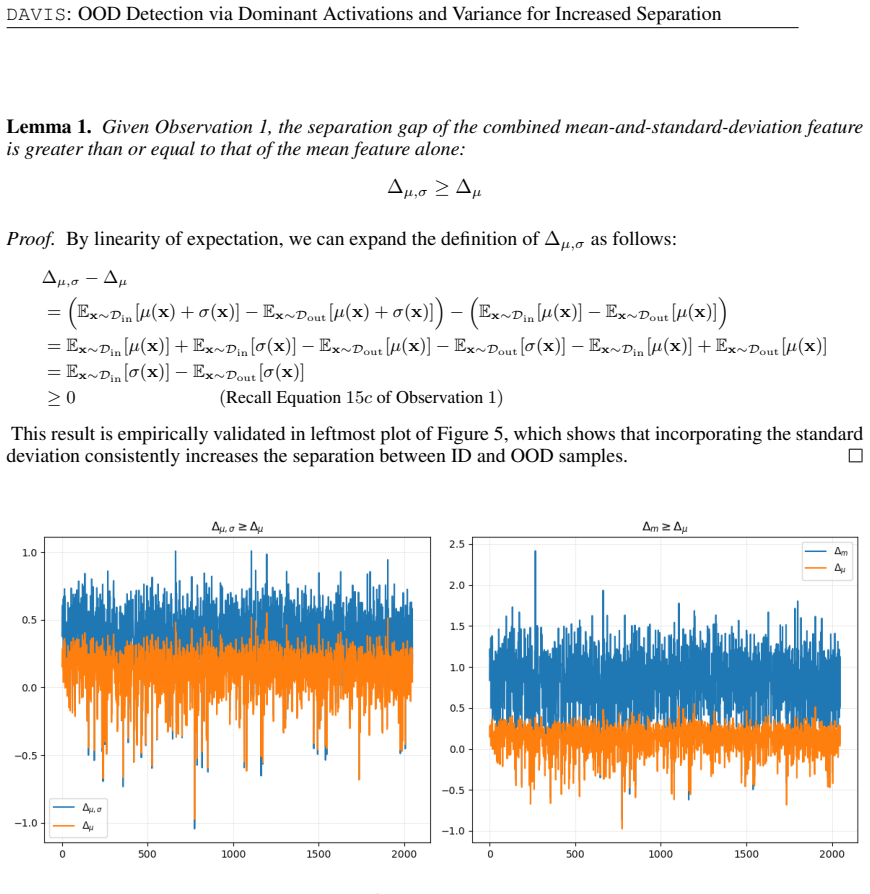
Detecting out-of-distribution (OOD) inputs is a critical safeguard for deploying machine learning models in the real world. However, most post-hoc detection methods operate on penultimate feature representations derived from global average pooling (GAP) -- a lossy operation that discards valuable distributional statistics from activation maps prior to global average pooling. We contend that these overlooked statistics, particularly channel-wise variance and dominant (maximum) activations, are highly discriminative for OOD detection. We introduce DAVIS, a simple and broadly applicable post-hoc technique that enriches feature vectors by incorporating these crucial statistics, directly addressing the information loss from GAP. Extensive evaluations show DAVIS sets a new benchmark across diverse architectures, including ResNet, DenseNet, and EfficientNet. It achieves significant reductions in the false positive rate (FPR95), with improvements of 48.26\% on CIFAR-10 using ResNet-18, 38.13\% on CIFAR-100 using ResNet-34, and 26.83\% on ImageNet-1k benchmarks using MobileNet-v2. Our analysis reveals the underlying mechanism for this improvement, providing a principled basis for moving beyond the mean in OOD detection.
Editorial analysis
A structured set of objections, weighed in public.
Referee Report
Summary. The paper introduces DAVIS, a post-hoc OOD detection method that augments standard GAP-derived feature vectors with channel-wise variance and dominant (maximum) activations extracted from pre-GAP activation maps. It claims this directly mitigates information loss from pooling and yields large empirical gains, including 48.26% FPR95 reduction on CIFAR-10 (ResNet-18), 38.13% on CIFAR-100 (ResNet-34), and 26.83% on ImageNet-1k (MobileNet-v2), establishing new benchmarks across ResNet, DenseNet, and EfficientNet families while providing an analysis of the underlying mechanism.
Significance. If the reported FPR95 gains prove robust under standard controls (error bars, ablations, and multiple seeds), DAVIS would offer a lightweight, architecture-agnostic improvement to existing post-hoc detectors. The emphasis on moving beyond the mean statistic could influence feature design in OOD and related tasks, provided the specific choice of variance-plus-max is shown to be load-bearing rather than incidental.
major comments (3)
- [Experiments] Experiments section (and abstract): the headline FPR95 reductions (48.26%, 38.13%, 26.83%) are stated without error bars, number of random seeds, or statistical significance tests. This omission makes it impossible to judge whether the improvements exceed typical run-to-run variance in OOD benchmarks.
- [Method] Method section: no ablation isolates the contribution of variance versus dominant activations versus simply increasing feature dimensionality; the paper therefore does not demonstrate that these two particular per-channel statistics are privileged over other descriptors (e.g., min, skewness, or even random projections).
- [Experiments] Experiments section, comparison tables: baseline results for recent post-hoc methods (e.g., current Mahalanobis variants, ReAct, or ASH) are not reported with the same protocol, so the claim of “setting a new benchmark” cannot be verified from the given numbers alone.
minor comments (1)
- [Abstract] The abstract states “our analysis reveals the underlying mechanism” but the provided text does not indicate whether this analysis includes quantitative diagnostics (e.g., distribution plots of variance/max on ID vs. OOD) or remains qualitative.
Simulated Author's Rebuttal
We thank the referee for the constructive feedback. We address each major comment point-by-point below and will revise the manuscript to incorporate the suggested improvements where they strengthen the work.
read point-by-point responses
-
Referee: Experiments section (and abstract): the headline FPR95 reductions (48.26%, 38.13%, 26.83%) are stated without error bars, number of random seeds, or statistical significance tests. This omission makes it impossible to judge whether the improvements exceed typical run-to-run variance in OOD benchmarks.
Authors: We agree that reporting variability is important for robustness claims. In the revised manuscript we will rerun all experiments over five random seeds, report mean FPR95 values with standard deviations and error bars in both tables and the abstract, and include paired statistical significance tests (e.g., Wilcoxon) against the strongest baseline to confirm the gains exceed run-to-run variance. revision: yes
-
Referee: Method section: no ablation isolates the contribution of variance versus dominant activations versus simply increasing feature dimensionality; the paper therefore does not demonstrate that these two particular per-channel statistics are privileged over other descriptors (e.g., min, skewness, or even random projections).
Authors: We will add a dedicated ablation subsection that (i) isolates variance alone, dominant activations alone, and their combination, (ii) compares against alternative per-channel descriptors (min, skewness, kurtosis) at identical dimensionality, and (iii) contrasts with random projections of the same added dimension. This will demonstrate whether the chosen statistics are load-bearing. revision: yes
-
Referee: Experiments section, comparison tables: baseline results for recent post-hoc methods (e.g., current Mahalanobis variants, ReAct, or ASH) are not reported with the same protocol, so the claim of “setting a new benchmark” cannot be verified from the given numbers alone.
Authors: We will re-evaluate all cited baselines (including updated Mahalanobis variants, ReAct, and ASH) under the identical protocol, data splits, preprocessing, and scoring used for DAVIS. Updated tables will report these re-computed numbers so that the benchmark claims can be directly verified. revision: yes
Circularity Check
No circularity; empirical proposal without derivation chain or self-referential fits
full rationale
The paper introduces DAVIS as a post-hoc method that concatenates channel-wise variance and dominant activations to GAP-derived features for OOD detection. No equations, derivations, or fitted parameters are described that reduce the claimed improvements to inputs by construction. Claims rest entirely on empirical benchmarks across ResNet, DenseNet, and EfficientNet, with no self-citation load-bearing the core mechanism or uniqueness theorem invoked. The skeptic concern targets the discriminative power of the chosen statistics, which is a correctness question rather than circularity. This matches the default expectation of no significant circularity for an empirical technique.
Axiom & Free-Parameter Ledger
Reference graph
Works this paper leans on
-
[3]
Set all values inh(x)less thantto zero
-
[4]
Lets 2 =P h(x), the sum after pruning
-
[5]
Scale all non-zero values inh(x)byexp(s 1/s2). The final model output becomes, which is then used to compute energy scoreSEnergy(x;f ASH)∈Rfor OOD detection : f ASH(x) =W ⊤hASH(x) +b SCALE(Xu et al., 2024) It is a post-hoc method designed to enhance out-of-distribution (OOD) detection by adaptively scaling the activation of the penultimate layerh(x)before...
work page 2024
-
[6]
Compute thep-th percentile thresholdtofh(x)
-
[7]
Lets 1 =P h(x), the sum of all activation values before pruning
-
[8]
Construct a binary mask1 {h(x)≥t} that keeps only the top-pactivations
-
[9]
Lets 2 =P h(x)·1 {h(x)≥t}, the sum of the top-pactivations
-
[10]
Compute the scaling ratior= s1 s2
-
[11]
Scale the original activations byexp(r): hSCALE(x) = exp(r)·h(x). The final model output is then computed with the scaled activations, and theenergy scoreis used for OOD detection: f SCALE(x) =W ⊤hSCALE(x) +b, S Energy(x;f SCALE)∈R. B STATISTICALANALYSIS In this section, we present a detailed statistical analysis of our method,DAVIS, demonstrating how it ...
-
[12]
This dimension was chosen to be comparable to other models in our evaluation, such as the ResNet variants (512) and DenseNet-101 (342). Following established protocols (Sun et al., 2021; Sun & Li, 2022; Djurisic et al., 2023), all models were trained from scratch for 100 epochs using SGD with a momentum of 0.9, a weight decay of 0.0001, and a batch size o...
work page 2021
-
[13]
to ensure our re-implementation was consistent with the authors’ reported optimal setting, providing a fair comparison. Computational Environment.All CIFAR model training and OOD detection experiments were conducted on an Apple M2 Max system with 96 GB of RAM. The experiments were implemented in Python using PyTorch (v2.1) and the Torchvision library. F A...
discussion (0)
Sign in with ORCID, Apple, or X to comment. Anyone can read and Pith papers without signing in.