REVIEW 5 major objections 7 minor 1 cited by
Quantile Transfer for Reliable Operating Point Selection in Visual Place Recognition
T0 review · 5 major / 7 minor · reviewed 2026-08-03 · deepseek-v4-flash
Pith's one-line read Quantile transfer sets VPR thresholds that hold 100% precision on unseen routes.
desk verdict Useful, honest empirical paper on VPR threshold transfer; the method works in most tested cells, but the headline 100% precision claim leans on an unproven quantile-invariance assumption and a chunk-filtering choice. read the letter →
The pith
A machine-rendered reading of the paper's core claim, the machinery that carries it, and where it could break.
The reading
What carries the argument
The load-bearing object is the quantile of the matching threshold, Q_k = Pr(C*_k <= MT_k), transferred to deployment via F^{-1}_{Sval}(Q_k). This converts a scale-dependent absolute similarity threshold into a relative position in the score distribution, exploiting the paper's claim that the rank ordering of similarities is more stable across environments than the raw scores. Adaptive calibration sampling (selecting the k most correlated calibration queries per deployment query) and the median of the resulting quantiles are the mechanisms that make the transfer per-query rather than global.
What would settle it
Take a dataset with ground-truth correspondences and a strong planned appearance shift, compute the oracle matching threshold for each deployment chunk, convert it to a quantile within that chunk's score distribution, and measure the spread of those quantiles across chunks. If the oracle threshold quantile varies substantially between chunks (for instance, more than a few percent), the quantile-invariance premise is false and the transferred threshold will fail to hold 100% precision on at least some chunks.
Extended reading notes
Core claim
The central claim is that threshold transfer should be done in quantile space, not score space. For each deployment query, the method finds calibration queries whose ranked similarity vectors are most correlated with it, computes the matching threshold that maximizes recall at the required precision on each such subset, converts those thresholds to quantiles of the calibration distributions, and takes their median. That median quantile is then mapped through the deployment distribution's inverse empirical CDF to produce the operating threshold. The paper argues and demonstrates empirically that this procedure tracks the oracle threshold more closely than static thresholds or heuristic distri
Load-bearing premise
The method rests on the assumption that the quantile of the optimal threshold in the calibration score distribution equals the quantile of the optimal threshold in the deployment distribution; if the relative position of the match/non-match boundary shifts between environments, the transferred threshold will not meet the precision requirement and the method has no mechanism to detect it.
Editorial extensions
If this is right
- VPR systems could be deployed at user-specified precision levels using only a short calibration traversal, removing per-environment manual threshold tuning.
- Dynamic per-query thresholds would replace fixed global thresholds, potentially improving recall on long traversals where score statistics drift.
- The method is descriptor-agnostic, so any improvement in VPR front-end descriptors directly compounds with the threshold selection gains.
- While demonstrated on single-frame matching, the same quantile-transfer principle could extend to sequence-based or filtering-based VPR with appropriate calibration sampling.
Reading between the lines
- Editorial inference: The core premise is quantile invariance between calibration and deployment; the paper provides empirical evidence but no theoretical or controlled distribution-shift test, so synthetic experiments with known score-distribution shifts would clarify when the method breaks.
- Editorial inference: The method assumes that calibration queries are representative of deployment queries in their ranked similarity structure; under severe appearance change or perceptual aliasing where that assumption fails, the transferred threshold could violate the precision target without any online detection mechanism.
- Editorial inference: The abstract reports five benchmark datasets while the full evaluation uses three datasets (counting two Nordland traversals separately); a reader reconciling the claims should treat the dataset count as three environments, five traversals.
- Editorial inference: If stable, the quantile-transfer idea could generalize beyond VPR to any retrieval system with an accept/reject threshold and a small labeled calibration set, such as loop closure in radar or lidar place recognition.
Signed reviews
Editorial analysis
A structured set of objections, weighed in public.
Referee Report
Summary. The paper proposes a method for automatic matching-threshold selection in visual place recognition (VPR). Using a small calibration traversal with known correspondences, the method learns thresholds that maximize recall at a user-specified precision (e.g., 100%), converts these thresholds into quantiles of the calibration similarity distribution (Eq. 1), and transfers them to deployment by applying the same quantile to the deployment similarity distribution (Eq. 2). A per-query adaptive calibration sampling step selects the most correlated calibration queries, and the median of the resulting quantiles is used as the deployment threshold. Experiments with seven VPR techniques on three benchmark datasets report improvements in Area Under the Performance Curve (AUPC) over a baseline and an ablation without quantile transfer. The paper claims the method enables reliable high-precision operation without manual threshold tuning.
Significance. If the quantile-transfer assumption holds, the method is a practical, VPR-technique-agnostic tool for maintaining high precision under environmental change, which is relevant for safety-critical V-SLAM and autonomous navigation. The paper's strengths include a broad evaluation across multiple VPR descriptors and datasets, a clean ablation isolating the quantile transfer step, reported runtime figures, and released code. The central claim is, however, contingent on an invariance assumption that is asserted rather than demonstrated, and several evaluation choices raise concerns about whether the reported improvements reflect genuine reliability gains. The paper has clear potential but needs additional validation and clarification before its conclusions can be fully accepted.
major comments (5)
- [Section III-C, Eqs. (1)-(2)] The central mechanism, quantile transfer, rests on the assertion that 'the relative ordering of similarities tends to be more stable' across environments. No theorem, formal condition, or controlled distribution-shift test is provided. The method has no way to detect or correct shifts in the match/non-match boundary between calibration and deployment. Since the paper's core claim is that a user-defined precision (e.g., 100%) is satisfied on deployment data, this assumption is load-bearing. Please provide either a theoretical characterization of when quantile transfer is valid, or an empirical analysis comparing calibration-derived quantiles with oracle quantiles on deployment chunks across different shift conditions.
- [Section IV-C] The sentence 'The number of chunks sampled from each dataset corresponds to those achieving a precision requirement, which for the evaluation in Section V is set to 100% precision' suggests that evaluation may be performed only on chunks that already satisfy the precision requirement. If chunks are selected based on outcome, the reported PSR and AUPC are biased by construction. Please clarify the chunk selection procedure, state explicitly whether all deployment queries were included, and re-run evaluations on all chunks without any precision-based filtering. If some chunks were excluded, disclose the fraction excluded and report results for the full deployment set.
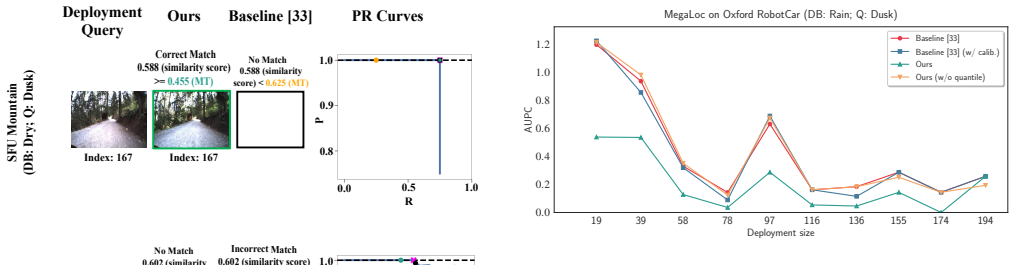
- [Section V-B] The illustrative example for Nordland Fall-Summer is misleading. The text says 'at 100% precision, the baseline correctly recalls 247 places out of 285 queries with 38 incorrect matches'; this is 247/(247+38) = 86.7% precision, not 100%. The proposed method is said to recall 57 places with no incorrect matches. This compares two different operating points and inflates the apparent advantage. Please compare both methods at the same achieved precision or clearly state that the baseline failed to meet the 100% precision requirement. Report the PSR for both methods so the reader can see how often the requirement is genuinely met.
- [Section IV-D and Table I] The evaluation reports only AUPC, a summary metric that balances recall gap and PSR across precision levels. The paper's central claim is reliable precision control, but no per-chunk PSR values at 100% precision are presented. Without knowing the proportion of deployment chunks where the method actually meets 100% precision, the reader cannot assess the method's core promise. Please include PSR tables for each VPR technique, dataset, and method at the 100% precision requirement, and provide distributions of achieved precision across chunks (e.g., box plots).
- [Section V-D, Figure 5 (bottom row)] The paper honestly presents a failure case where the proposed method underestimates the threshold and retrieves incorrect matches. This is exactly the scenario where quantile invariance fails. The paper should quantify how often such failures occur across all datasets and VPR techniques, and analyze whether they correlate with conditions that violate the invariance assumption (e.g., large appearance change or low-quality descriptors). This would provide a more complete picture of the method's reliability and guide future improvements.
minor comments (7)
- [Abstract] The abstract claims the method enables 'operating at 100% precision in approximately twice as many deployment scenarios (median improvement)' and 'up to 29% more correct matches,' but these specific statistics are not defined or reported in the results sections. Please include the corresponding quantitative results.
- [Eq. (1)] C*_k is a matrix, not a scalar random variable. Please clarify that Pr denotes the empirical fraction of scores in the matrix below MT_k, e.g., by writing out the sum over entries. Similarly, define F^{-1}_{Sval} with respect to the empirical distribution of all scores in Sval.
- [Section III-D] The sentence 'we take the median of the quantile values {Qk} obtained above' is ambiguous: is the median taken across the k selected calibration queries per deployment query, or across the deployment set? Please specify the exact aggregation.
- [Section IV-C] There is a typo: 'serve as calibration serve as calibration data' should be 'serve as calibration data'.
- [Section VI] Typo: 'user-specificed' should be 'user-specified'.
- [Section IV-B] The calibration-enhanced baseline variant is described only briefly. Please provide pseudocode or a precise description of how the baseline's threshold is transferred to deployment, so the comparison is reproducible.
- [Figure 2] The methodology diagram is dense and the font size in the matrices is very small. Consider enlarging the key elements and using clearer arrows to improve readability.
Circularity Check
No significant circularity: quantile transfer is an empirical transfer assumption, not a derivation that reduces to its inputs.
full rationale
The paper's derivation chain is not circular. Calibration thresholds MT_k are computed from labeled calibration data (C*_k, GT*_k) to meet a precision requirement, then converted to quantiles Q_k = Pr(C*_k <= MT_k) in Eq. (1), and transferred to deployment via the empirical quantile function F^{-1}_{Sval}(Q_k) in Eq. (2). Deployment ground truth is never used in estimating the operating point; precision and recall are evaluated on held-out deployment chunks. The output threshold is not equal by construction to the calibration threshold—it is a different quantity obtained by applying the calibration quantile to a different score distribution. The central assumption, that the quantile of the optimal threshold is stable across environments, is asserted rather than proven, but that is an empirical-validity concern, not a circularity. The paper's self-citations (e.g., [4], [5], [19], [20], [28], [35], [36]) are contextual related-work citations and do not carry the load of the quantile-transfer argument. No equation is equivalent to its own input, no fitted parameter is renamed as a prediction, and no uniqueness or ansatz is imported from the authors' prior work. Thus the appropriate finding is no significant circularity, score 0.
Assumptions & free parameters
free parameters (2)
- k (number of correlated calibration queries selected per deployment query) =
not specified in manuscript
- Calibration split fraction (10%) =
10% of queries
assumptions (4)
- domain assumption The quantile of the optimal threshold in the calibration score distribution equals the quantile of the optimal threshold in the deployment score distribution (quantile invariance).
- domain assumption Pearson correlation between ranked similarity vectors identifies calibration queries whose optimal operating thresholds match a given deployment query.
- domain assumption The strict one-to-one correspondence with no spatial tolerance is the correct ground truth for precision/recall evaluation.
- domain assumption The empirical score distribution of the calibration set is representative of the deployment score distribution.
Cite this review
Pith. "Pith review of Quantile Transfer for Reliable Operating Point Selection in Visual Place Recognition." pith.science (2026). https://pith.science/paper/XVTPRG6W
@misc{pith2026260204401,
  author       = {Pith},
  title        = {Pith review of: Quantile Transfer for Reliable Operating Point Selection in Visual Place Recognition},
  year         = {2026},
  howpublished = {\url{https://pith.science/paper/XVTPRG6W}},
  note         = {Machine review of arXiv:2602.04401}
}
read the original abstract
Visual Place Recognition (VPR) is a key component for localization in Global Navigation Satellite System (GNSS)-denied environments, but its performance critically depends on selecting an image matching threshold (operating point) that balances precision and recall. Thresholds are typically hand-tuned offline for a specific environment and fixed during deployment, leading to degraded performance under environmental change. We propose a method that automatically estimates the operating point of a VPR system to maximize recall whilst aiming to achieve 100% precision. The method uses a small calibration traversal with known correspondences and transfers thresholds to deployment via quantile normalization of similarity score distributions. This quantile transfer ensures that thresholds remain stable across calibration sizes and query subsets. Experiments with seven state-of-the-art VPR techniques across five benchmark datasets demonstrate that our proposed approach consistently outperforms existing baselines, enabling the underlying VPR technique to operate at 100% precision in approximately twice as many deployment scenarios (median improvement), while retrieving up to 29% more correct matches at that precision. The method eliminates manual tuning by adapting to new environments and generalizing across operating conditions. Our code is available at https://github.com/DhyeyR-007/Quantile-Transfer-for-Reliable-VPR.
Figures


Figures from the paper (3 more)


Forward citations
Cited by 1 Pith paper
-
Breaking D\'ej\`a Vu: Independent Auditing of Visual Place Recognition through Vision-Language Reasoning
VLM-based post-retrieval auditing of visual place recognition raises recall@1 by 13.6% on average while cutting false accepts to 12% and holding precision above 95%.
Reference graph
Works this paper leans on
-
[1]
Visual place recognition: A survey from deep learning perspective,
X. Zhang, L. Wang, and Y . Su, “Visual place recognition: A survey from deep learning perspective,”Pattern Recognition, vol. 113, 2021
2021
-
[2]
A Survey on Deep Visual Place Recogni- tion,
C. Masone and B. Caputo, “A Survey on Deep Visual Place Recogni- tion,”IEEE Access, vol. 9, pp. 19 516–19 547, 2021
2021
-
[3]
General Place Recognition Survey: Toward Real-World Autonomy,
P. Yinet al., “General Place Recognition Survey: Toward Real-World Autonomy,”IEEE Transactions on Robotics, vol. 41, pp. 3019–3038, 2025
2025
-
[4]
Where is your place, visual place recognition?
S. Garg, T. Fischer, and M. Milford, “Where is your place, visual place recognition?” inInternational Joint Conference on Artificial Intelligence, 8 2021, pp. 4416–4425
2021
-
[5]
Visual place recognition: A tutorial,
S. Schubert, P. Neubert, S. Garg, M. Milford, and T. Fischer, “Visual place recognition: A tutorial,”IEEE Robotics & Automation Magazine, vol. 31, no. 3, pp. 139–153, 2023
2023
-
[6]
Past, present, and future of simultaneous localization and mapping: Toward the robust-perception age,
C. Cadenaet al., “Past, present, and future of simultaneous localization and mapping: Toward the robust-perception age,”IEEE Transactions on robotics, vol. 32, no. 6, pp. 1309–1332, 2017
2017
-
[7]
A brief survey of loop closure detection: a case for rethinking evaluation of intelligent systems,
S. B. Nashed, “A brief survey of loop closure detection: a case for rethinking evaluation of intelligent systems,” inNeurIPS Workshop on ML Retrospectives, Surveys Meta-Analyses, 2020
2020
-
[8]
What makes visual place recognition easy or hard?
S. Schubert and P. Neubert, “What makes visual place recognition easy or hard?”arXiv preprint arXiv:2106.12671, 2021
arXiv 2021
Show all 38 references
-
[9]
VPR-Bench: An open-source visual place recognition evaluation framework with quantifiable viewpoint and appearance change,
M. Zaffaret al., “VPR-Bench: An open-source visual place recognition evaluation framework with quantifiable viewpoint and appearance change,”International Journal of Computer Vision, vol. 129, no. 7, pp. 2136–2174, 2021
2021
-
[10]
On the estimation of image- matching uncertainty in visual place recognition,
M. Zaffar, L. Nan, and J. F. Kooij, “On the estimation of image- matching uncertainty in visual place recognition,” inIEEE/CVF Conference on Computer Vision and Pattern Recognition, 2024, pp. 17 743–17 753
2024
-
[11]
Visual place recognition: A survey,
S. Lowryet al., “Visual place recognition: A survey,”IEEE Transactions on Robotics, vol. 32, no. 1, pp. 1–19, 2015
2015
-
[12]
Megaloc: One retrieval to place them all,
G. Berton and C. Masone, “Megaloc: One retrieval to place them all,” inIEEE Conference on Computer Vision and Pattern Recognition, 2025, pp. 2861–2867
2025
-
[13]
Optimal transport aggregation for visual place recognition,
S. Izquierdo and J. Civera, “Optimal transport aggregation for visual place recognition,” inIEEE Conference on Computer Vision and Pattern Recognition, 2024, pp. 17 658–17 668
2024
-
[14]
Boq: A place is worth a bag of learnable queries,
A. Ali-Bey, B. Chaib-draa, and P. Giguere, “Boq: A place is worth a bag of learnable queries,” inIEEE/CVF Conference on Computer Vision and Pattern Recognition, 2024, pp. 17 794–17 803
2024
-
[15]
Cricavpr: Cross-image correlation-aware representation learning for visual place recognition,
F. Lu, X. Lan, L. Zhang, D. Jiang, Y . Wang, and C. Yuan, “Cricavpr: Cross-image correlation-aware representation learning for visual place recognition,” inIEEE/CVF Conference on Computer Vision and Pattern Recognition, 2024, pp. 16 772–16 782
2024
-
[16]
MixVPR: Feature mixing for visual place recognition,
A. Ali-Bey, B. Chaib-Draa, and P. Giguere, “MixVPR: Feature mixing for visual place recognition,” inIEEE/CVF Winter Conference on Applications of Computer Vision, 2023, pp. 2998–3007
2023
-
[17]
Rethinking visual geo- localization for large-scale applications,
G. Berton, C. Masone, and B. Caputo, “Rethinking visual geo- localization for large-scale applications,” inIEEE/CVF Conference on Computer Vision and Pattern Recognition, 2022, pp. 4878–4888
2022
-
[18]
NetVLAD: CNN architecture for weakly supervised place recognition,
R. Arandjelovic, P. Gronat, A. Torii, T. Pajdla, and J. Sivic, “NetVLAD: CNN architecture for weakly supervised place recognition,” inIEEE Conference on Computer Vision and Pattern Recognition, 2016, pp. 5297–5307
2016
-
[19]
Predicting to improve: Integrity measures for assessing visual localization performance,
H. Carson, J. J. Ford, and M. Milford, “Predicting to improve: Integrity measures for assessing visual localization performance,”IEEE Robotics and Automation Letters, vol. 7, no. 4, pp. 9627–9634, 2022
2022
-
[20]
Unsupervised quality prediction for improved single-frame and weighted sequential visual place recognition,
H. Carson, J. J. Ford, and M. Milford, “Unsupervised quality prediction for improved single-frame and weighted sequential visual place recognition,” inIEEE International Conference on Robotics and Automation, 2023, pp. 3955–3961
2023
-
[21]
Improving visual place recognition based robot navigation by verifying localization estimates,
O. Claxtonet al., “Improving visual place recognition based robot navigation by verifying localization estimates,”IEEE Robotics and Automation Letters, 2024
2024
-
[22]
Integrity of visual naviga- tion—developments, challenges, and prospects,
C. Zhu, M. Meurer, and C. G ¨unther, “Integrity of visual naviga- tion—developments, challenges, and prospects,”NAVIGATION: Journal of the Institute of Navigation, vol. 69, no. 2, 2022
2022
-
[23]
Quantifying robot localization safety: A new integrity monitoring method for fixed- lag smoothing,
O. A. Hafez, G. D. Arana, M. Joerger, and M. Spenko, “Quantifying robot localization safety: A new integrity monitoring method for fixed- lag smoothing,”IEEE Robotics and Automation Letters, vol. 5, no. 2, pp. 3182–3189, 2020
2020
-
[24]
Localization safety validation for autonomous robots,
G. D. Arana, O. A. Hafez, M. Joerger, and M. Spenko, “Localization safety validation for autonomous robots,” inIEEE/RSJ International Conference on Intelligent Robots and Systems, 2020, pp. 6276–6281
2020
-
[25]
Robotics software engineering and certification: Issues and challenges,
R. Pietrantuono and S. Russo, “Robotics software engineering and certification: Issues and challenges,” inIEEE International Symposium on Software Reliability Engineering Workshops, 2018, pp. 308–312
2018
-
[26]
Learn from experience: Probabilistic prediction of perception performance to avoid failure,
C. Gur ˘au, D. Rao, C. H. Tong, and I. Posner, “Learn from experience: Probabilistic prediction of perception performance to avoid failure,” The International Journal of Robotics Research, vol. 37, no. 9, pp. 981–995, 2018
2018
-
[27]
A method for designing autonomous robots that know their limits,
A. Gautam, T. Whiting, X. Cao, M. A. Goodrich, and J. W. Crandall, “A method for designing autonomous robots that know their limits,” in IEEE International Conference on Robotics and Automation, 2022, pp. 121–127
2022
-
[28]
Unsupervised selection of optimal operating parameters for visual place recognition algorithms using gaussian mixture models,
J. Mount, M. Xu, L. Dawes, and M. Milford, “Unsupervised selection of optimal operating parameters for visual place recognition algorithms using gaussian mixture models,”IEEE Robotics and Automation Letters, vol. 6, no. 2, pp. 343–350, 2020
2020
-
[29]
SeqSLAM: Visual route-based navigation for sunny summer days and stormy winter nights,
M. J. Milford and G. F. Wyeth, “SeqSLAM: Visual route-based navigation for sunny summer days and stormy winter nights,” inIEEE International Conference on Robotics and Automation, 2012, pp. 1643– 1649
2012
-
[30]
Automatic coverage selection for surface-based visual localization,
J. Mount, L. Dawes, and M. J. Milford, “Automatic coverage selection for surface-based visual localization,”IEEE Robotics and Automation Letters, vol. 4, no. 4, pp. 3900–3907, 2019
2019
-
[31]
Are we there yet? challenging SeqSLAM on a 3000 km journey across all four seasons,
N. S ¨underhauf, P. Neubert, and P. Protzel, “Are we there yet? challenging SeqSLAM on a 3000 km journey across all four seasons,” in IEEE International Conference on Robotics and Automation Workshop on Long-term Autonomy, 2013, p. 2013
2013
-
[32]
1 year, 1000 km: The oxford robotcar dataset,
W. Maddern, G. Pascoe, C. Linegar, and P. Newman, “1 year, 1000 km: The oxford robotcar dataset,”The International Journal of Robotics Research, vol. 36, no. 1, pp. 3–15, 2017
2017
-
[33]
Beyond ann: Exploiting struc- tural knowledge for efficient place recognition,
S. Schubert, P. Neubert, and P. Protzel, “Beyond ann: Exploiting struc- tural knowledge for efficient place recognition,” inIEEE International Conference on Robotics and Automation, 2021, pp. 5861–5867
2021
-
[34]
Adaptive thresholding for sequence-based place recognition,
O. Vysotska, I. Bogoslavskyi, M. Hutter, and C. Stachniss, “Adaptive thresholding for sequence-based place recognition,” inIEEE Interna- tional Conference on Robotics and Automation, 2025
2025
-
[35]
Applications of spiking neural networks in visual place recognition,
S. Hussaini, M. Milford, and T. Fischer, “Applications of spiking neural networks in visual place recognition,”IEEE Transactions on Robotics, 2024
2024
-
[36]
Improving visual place recognition with sequence-matching receptiveness prediction,
S. Hussaini, T. Fischer, and M. Milford, “Improving visual place recognition with sequence-matching receptiveness prediction,” in IEEE/RSJ International Conference on Intelligent Robots and Systems, 2025
2025
-
[37]
Deep visual geo-localization benchmark,
G. Bertonet al., “Deep visual geo-localization benchmark,” in IEEE/CVF Conference on Computer Vision and Pattern Recognition, 2022, pp. 5396–5407
2022
-
[38]
The SFU mountain dataset: Semi-structured woodland trails under changing environmental condi- tions,
J. Bruce, J. Wawerla, and R. Vaughan, “The SFU mountain dataset: Semi-structured woodland trails under changing environmental condi- tions,” inIEEE International Conference on Robotics and Automation, 2015
2015
Reviewed August 3, 2026 · model on record in the stance chip above.
Discussion (0). Continue with ORCID to comment.