REVIEW 3 major objections 5 minor 3 cited by
The observed redshift-dependent rate of tidal disruption events is a sensitive probe of the evolving supermassive black hole mass function at masses 10^5–10^8 M_sun, and a flux-limited LSST sample can constrain the mass function's exponenti
Reviewed by Pith at T0; open to challenge. T0 means a machine referee read the full paper against a public rubric. the ladder, T0–T4 →
T0 review · deepseek-v4-flash
2026-08-03 04:23 UTC pith:LMIVF3SD
load-bearing objection A useful, transparent forecasting framework for TDE surveys whose strongest quantitative claim — LSST constraining the BHMF evolution slope to ±0.06 — rests on a known, unquantified LF/BHMF inconsistency. the 3 major comments →
Tidal disruption event rates across cosmic time: forecasts for LSST, Roman, and JWST and their constraints on the supermassive black hole mass function
The pith
A machine-rendered reading of the paper's core claim, the machinery that carries it, and where it could break.
Core claim
On its own terms, the discovery is that TDEs are not just a local phenomenon: their redshift-dependent rate is dominated by the evolving supply of black holes in the 10^5–10^8 M_sun range, so a flux-limited survey can invert the observed TDE redshift distribution into a constraint on the black-hole mass function. Fitting the density of TDE-capable black holes as an exponential decline N_BH(z) ≈ A e^{α(1+z)}, the paper predicts that LSST's annual TDE yield falls logarithmically with steeper α, while the sample's median redshift moves down; taken together these two summary statistics break the degeneracy with galaxy-scale rate enhancements and recover α to about ±0.06. The two contrasting mass
What carries the argument
The engine of the calculation is the rate integral Γ_TDE = ∫ ε(z) F(z) N_BH(z) R0(z,λ) O(z) dz, where R0 is the local ZTF-measured TDE luminosity function, N_BH(z) is the ratio of the comoving number density of Hills-mass-capable SMBHs (10^5–10^8 M_sun) at redshift z to that locally, F(z) bundles mergers, nuclear stellar density, and IMF evolution, O(z) is the dust-obscuration correction, and ε(z) is survey efficiency (unity for time-domain surveys, estimated via a light-curve visibility time for single-epoch surveys). The key move is normalizing all astrophysical scalings to unity at z=0, so uncertainties enter as multiplicative factors rather than as an absolute first-principles rate, and
Load-bearing premise
The load-bearing assumption is that the shape of the TDE luminosity function (and hence the mapping from black-hole mass to flare brightness) does not evolve with redshift even though the black-hole mass function does; the paper itself acknowledges these are fundamentally incompatible, so the forecast yields and the derived slope constraint inherit any bias from that simplification.
What would settle it
With two years of flux-limited LSST TDEs (expected to exceed 10^4 events), measure the binned redshift distribution and compare the yield-versus-median-z trend against the band spanned by the two mass-function models and the plausible galaxy-enhancement range; if the observed trend falls outside that band, the constant-luminosity-function assumption fails. A smaller decisive test is to measure the median TDE peak luminosity as a function of redshift—a statistically significant trend would directly falsify luminosity-function shape constancy.
If this is right
- A flux-limited LSST TDE sample yields thousands to tens of thousands of events per year; combining total yield with median redshift constrains the black-hole mass-function slope α to ±0.06, making TDEs a demographic probe of low-mass black holes at z>1.
- Under the AGN-calibrated mass-function prescription the annual LSST yield is roughly half the simulation-based yield, so even a single-year count discriminates between the two population models.
- The Roman HLTDS should detect dozens to roughly a hundred TDEs per year with median redshift near z~1 and reach z~2.75, with high-resolution host-galaxy imaging to separate black-hole demographics from galaxy-scale rate enhancements.
- Single-epoch JWST COSMOS-Web serendipitous discoveries are rare (0–2 TDEs), but multi-epoch monitoring of deep JWST fields provides a path to discovering z>3 TDEs and probing the seeds of the first SMBHs.
- Current ZTF data cannot distinguish the mass-function models; the limiting factor is sample size and depth, with roughly 400 TDEs at the ZTF magnitude limit needed to see the divergence.
- The volumetric TDE rate should rise through z~1–2 and then decline, with the turnover redshift depending on which black-hole mass function is correct.
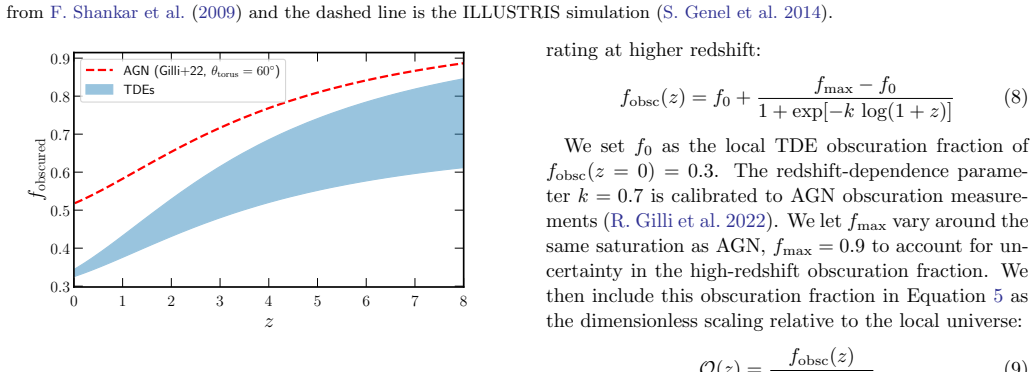
- Dust obscuration is a minor correction to the overall rate even at high redshift, while nuclear stellar density is the dominant galaxy-scale enhancement at z<3.
Where Pith is reading between the lines
- If future LSST samples show an excess of high-z TDEs relative to both model families, the first suspect will be the assumed constancy of the TDE luminosity function; the paper's own mass-luminosity scaling suggests the luminosity function should harden with redshift, which would bias the current forecasts.
- A direct test of the framework would be to use Roman host-galaxy morphologies to estimate nuclear densities and merger signatures, subtract their contribution to the redshift-dependent rate, and then fit the residual as a pure black-hole mass-function probe—bypassing part of the semi-empirical F(z) uncertainty.
- The claimed ±0.06 constraint assumes the exponential form N_BH(z) ≈ A e^{α(1+z)} and local linearity around the fiducial α; an independent mass estimate from late-time TDE plateaus could break the degeneracy between the black-hole mass function and galaxy-scale enhancements more cleanly.
- If the low-mass black-hole mass function is considerably more bottom-heavy at z>2 than either tested model, the TDE redshift distribution will peak at lower redshift than predicted—an effect LSST's median-redshift measurement could detect before Roman begins.
Editorial analysis
A structured set of objections, weighed in public.
Referee Report
Summary. This paper constructs a semi-empirical model for the cosmic evolution of the tidal disruption event (TDE) rate. The calculation starts from the local ZTF g-band TDE luminosity function (Yao et al. 2023) and applies multiplicative redshift-dependent corrections for the evolving supermassive black hole mass function (using Shankar et al. 2009 and ILLUSTRIS), nuclear stellar density, galaxy merger rate, initial mass function, and dust obscuration. The authors forecast annual TDE yields and redshift distributions for Rubin/LSST, Roman HLTDS, and JWST COSMOS-Web, and propose that the total yield plus median redshift of a flux-limited LSST sample can constrain the exponential redshift slope α of the low-mass BHMF to ±0.06. The central assertion is that the observed redshift dependence of the TDE rate is sensitive to the SMBH mass function and its evolution.
Significance. If the forecasts are robust, this work provides a new, observation-driven route to probing the 10^5–10^8 M_sun SMBH population at z > 1, a regime poorly constrained by AGN surveys. The model is transparent and the Monte Carlo propagation of parameter uncertainties is a strength, as is the explicit comparison of two contrasting BHMF models. The survey yield predictions for LSST, Roman, and JWST are useful planning numbers, and the proposed methodology for inverting TDE redshift statistics into a BHMF constraint is a valuable contribution even if the quoted precision needs revision.
major comments (3)
- [§4.2, Eq. (2)] The central forecast that LSST yield and median redshift can constrain the BHMF slope α to ±0.06 rests on a luminosity function whose shape is fixed in redshift while the BHMF evolves. Because peak TDE luminosity correlates with M_BH (Mummery et al. 2024; Yao et al. 2023), a bottom-heavy BHMF at high z should produce a fainter LF, changing both N_TDE and z_med. The paper's statement that this effect is 'a few percent' is not derived from a convolution of an M-dependent L(M) with the evolving BHMF; it is inferred from the difference with Kochanek (2016) at z ≥ 4, outside the LSST redshift range (z ≲ 1.5) that drives the α constraint. If LF evolution shifts z_med by only 0.01–0.02, it can bias α by more than the quoted 0.06. Please provide an explicit estimate with a mass-dependent luminosity relation and observed scatter, or remove the quantitative α precision claim.
- [§3.6, Fig. 11] The quoted uncertainty σ_α = 0.06 appears to be only the bootstrap statistical error on the median redshift and Poisson yield scatter. The authors themselves state that N alone gives ±0.6 because of degeneracy with galaxy-scale effects; the 'all enhancements' versus 'dust-only' models differ by ~0.3 dex in N and ~0.05 in z_med. From the right-hand panel, the α–z_med gradient is roughly 8 per unit redshift, so a 0.05 systematic shift corresponds to Δα ≈ 0.4, not 0.06. The α constraint must marginalize over F(z) parameters (E, α_density, IMF slope, obscuration) and report the total error budget; otherwise the headline precision is unsupported.
- [§3.5, Fig. 9] The 'reassuring' match to the ZTF cumulative redshift distribution is not an independent validation. The model is normalized to the Y23 local rate, and the shape of R0(z) in Eq. (2) is derived from the same Y23 luminosity function and flux limit. At z ≲ 0.5 the multiplicative corrections F(z)N_BH(z) are within tens of percent, so the CDF shape is essentially the Y23 input. A genuine out-of-sample test would use a flux-limited sample not used in the LF calibration, or hold out part of Y23.
minor comments (5)
- [§2.3] Typo: 'observationally confirmed observationally' should be 'observationally confirmed'.
- [Table 1 caption] Typo: 'T able' should be 'Table'.
- [§4.3 vs §6] The DDT program number is given as 'DDT: 9356' in §4.3 but 'DD: 3956' in the acknowledgments; please reconcile.
- [§2.4, Eq. (15)] The definition f_enh = f_pair (t_enh/T_pair) is followed by Eq. (19), which repeats the same ratio explicitly. Since t_enh/T_pair ≈ 1 is adopted, consider simplifying to avoid the impression that f_enh and the ratio are independent.
- [Fig. 10] The TNG100/TNG50 fits are shown but not used in the rate forecasts; their role in the argument should be stated more clearly.
Circularity Check
Central derivation is independent forward modeling; only the ZTF redshift-CDF check is an in-sample consistency test.
specific steps
-
fitted input called prediction
[§3.5 (Figure 9)]
"As expected, these align almost exactly because we calibrate all of our rate predictions to the observations from ZTF. However, it is reassuring that the shape of the CDF matches the observed shape, which is not calibrated into our model. This confirms that the only factor influencing the redshift distribution of the ZTF-observed TDEs is the volume probed by the survey."
The model's predicted cumulative redshift distribution is computed from R0(z) in Eq. (2), which integrates the Y23 g-band luminosity function φ_L(L_g). That luminosity function was fitted to the same ZTF sample whose observed cumulative redshift distribution is displayed in Figure 9. The redshifts and luminosities of that sample are the inputs from which φ_L is derived, so the CDF match is a consistency check built into the construction, not an independent confirmation. The further conclusion that 'the only factor influencing the redshift distribution ... is the volume probed' cannot be established from this in-sample comparison. The paper is transparent that the alignment follows from calibration, so this is a minor validation issue rather than a hidden derivation, and it is not load-bear
full rationale
The main derivation chain is not circular. Equation (1) is a forward model: the local Y23 TDE luminosity function is multiplied by external BHMF models (Shankar+09; Illustris/TNG) and empirically motivated scalings for nuclear density, mergers, IMF, and dust. The BHMF enters as an input through Eqs. (6)-(7), so the claimed sensitivity of the TDE rate to the BHMF is a model prediction obtained by varying external inputs, not a result derived from the conclusion being claimed. The proposed LSST constraint in §3.6 is a forecasting/inversion exercise for future data; the quoted σ_α≈0.06 is a model-based statistical estimate, not a claim that α has already been measured, and it does not reduce to the input by definition. No load-bearing self-citation chain appears: M. Karmen et al. (2025) is cited for JWST detectability and the COSMOS-Web search context, but the rate predictions do not reduce to that citation. The §4.2 limitation—constant LF shape versus evolving BHMF—is explicitly acknowledged as 'fundamentally incompatible,' and the few-percent magnitude is asserted rather than derived; that is a model systematic and correctness risk, not a circular reduction under the hard rules. The only mild circularity is the in-sample ZTF CDF check in §3.5, which is non-independent but transparently acknowledged and does not support the central forecasts.
Axiom & Free-Parameter Ledger
free parameters (7)
- Obscuration fraction logistic parameters (f0, k, fmax) =
f0=0.3, k=0.7, fmax=0.9
- Nuclear density–TDE rate exponent alpha =
uniform prior 1–2
- Central density redshift scaling exponent =
0.9
- IMF slope alpha_IMF(z) =
linear 2.35 (z=0) to 2.081 (z~8)
- IMF mass limits Mmin, Mmax =
unspecified
- Merger rate enhancement E =
uniform prior 10–100
- Enhanced-phase duration / pair timescale ratio t_enh/T_pair =
1
axioms (7)
- domain assumption TDE luminosity function shape is redshift-invariant
- domain assumption TDE rate scales as rho^alpha with 1<=alpha<=2
- domain assumption Central 1 kpc surface density traces density at r_inf with constant profile shape to z=6
- domain assumption AGN obscuration redshift evolution applies to TDE host galaxies
- domain assumption TDE rate enhancement after mergers follows simulation range E=10–100 for t_enh/T_pair~1
- domain assumption Top-heavy IMF inferred from UV-luminous galaxies at high z is real and evolves linearly
- domain assumption Input BHMFs (Shankar+09, ILLUSTRIS) bracket the true BHMF
read the original abstract
Measuring the mass distribution of supermassive black holes (SMBHs) over cosmic time remains particularly challenging for the low mass (M_BH<10^8 M_sun) population at z>1. This population is also the most sensitive to SMBH seeding and early growth models. In this work we construct a semi-empirical model for the redshift evolution of the TDE rate under multiple SMBH mass function prescriptions, and show that the observed redshift-dependent rate of TDEs is very sensitive to the SMBH mass function and its evolution with redshift. We further incorporate galaxy-scale processes that evolve with redshift -- namely, increasing galaxy nuclear stellar densities, enhanced galaxy-galaxy merger rates, dust obscuration, and a possible top-heavy IMF at early cosmic times -- and quantify their combined impact on the TDE rate. We find that including these effects generally results in a volumetric TDE rate that increases with redshift until a maximum near cosmic noon, before declining at higher redshift where SMBHs that can disrupt stars become increasingly scarce. We forecast TDE rates in the Rubin LSST and the Roman High Latitude Time Domain Survey, alongside expectations for serendipitous TDE rates in the JWST COSMOS-Web survey. Finally, we provide a methodology for using a flux-limited survey of TDEs in LSST to directly constrain the redshift evolution of the SMBH mass function.
Figures



Forward citations
Cited by 3 Pith papers
-
TDEs on FIRE: Illuminating the Cosmic Evolution of Tidal Disruption Rates
FIRE-2 simulations show per-galaxy tidal disruption rates peak near z=2.5 at 4e-4 per year, correlate with SFR and central density, and remain high in satellite galaxies at early times.
-
TDE 2025abcr: A Tidal Disruption Event in the Outskirts of a Massive Galaxy
TDE 2025abcr is the first optical tidal disruption event found more than 30,000 light-years from its host galaxy's center, implying a wandering black hole.
-
The Lazuli Space Observatory: Opportunities for time-domain and multi-messenger astronomy
Lazuli is proposed as a space observatory combining flagship sensitivity with response times one to two orders of magnitude faster than current large facilities to enable new time-domain and multi-messenger science.
Reference graph
Works this paper leans on
-
[1]
Adamo, A., Bradley, L. D., Vanzella, E., et al. 2024, Nature, 632, 513, doi: 10.1038/s41586-024-07703-7
-
[2]
2017, ARA&A, 55, 17, doi: 10.1146/annurev-astro-091916-055306
Alexander, T. 2017, ARA&A, 55, 17, doi: 10.1146/annurev-astro-091916-055306
-
[3]
Andreoni, I., Coughlin, M. W., Perley, D. A., et al. 2022, Nature, 612, 430, doi: 10.1038/s41586-022-05465-8
-
[4]
2014, ApJ, 793, 38, doi: 10.1088/0004-637X/793/1/38
Arcavi, I., Gal-Yam, A., Sullivan, M., et al. 2014, ApJ, 793, 38, doi: 10.1088/0004-637X/793/1/38
-
[5]
Baggen, J. F. W., van Dokkum, P., Labb´ e, I., et al. 2023, ApJL, 955, L12, doi: 10.3847/2041-8213/acf5ef
-
[6]
2025,, v2.12.1 Zenodo, doi: 10.5281/zenodo.15019859
Barbary, K., Bailey, S., Barentsen, G., et al. 2025,, v2.12.1 Zenodo, doi: 10.5281/zenodo.15019859
-
[7]
Barro, G., Faber, S. M., Koo, D. C., et al. 2017, ApJ, 840, 47, doi: 10.3847/1538-4357/aa6b05
-
[8]
Bellm, E. C., Kulkarni, S. R., Graham, M. J., et al. 2019, PASP, 131, 018002, doi: 10.1088/1538-3873/aaecbe
-
[9]
Bertemes, C., Wylezalek, D., Rupke, D. S. N., et al. 2025, A&A, 693, A176, doi: 10.1051/0004-6361/202450451
-
[10]
Bezanson, R., van Dokkum, P. G., Tal, T., et al. 2009, ApJ, 697, 1290, doi: 10.1088/0004-637X/697/2/1290
-
[11]
Bianco, F. B., Ivezi´ c,ˇZ., Jones, R. L., et al. 2022, ApJS, 258, 1, doi: 10.3847/1538-4365/ac3e72
-
[12]
2017, ApJ, 844, 46, doi: 10.3847/1538-4357/aa7579
Blagorodnova, N., Gezari, S., Hung, T., et al. 2017, ApJ, 844, 46, doi: 10.3847/1538-4357/aa7579
-
[13]
1952, MNRAS, 112, 195, doi: 10.1093/mnras/112.2.195
Bondi, H. 1952, MNRAS, 112, 195, doi: 10.1093/mnras/112.2.195
-
[14]
Bricman, K., & Gomboc, A. 2020, ApJ, 890, 73, doi: 10.3847/1538-4357/ab6989 Buˇ car Bricman, K., van Velzen, S., Nicholl, M., & Gomboc, A. 2023, ApJS, 268, 13, doi: 10.3847/1538-4365/ace1e7
-
[15]
Medvedev, P. S. 2025, MNRAS, 540, 30, doi: 10.1093/mnras/staf686
-
[16]
Carnall, A. C., McLure, R. J., Dunlop, J. S., et al. 2023, Nature, 619, 716, doi: 10.1038/s41586-023-06158-6
-
[17]
Casey, C. M., Kartaltepe, J. S., Drakos, N. E., et al. 2023, ApJ, 954, 31, doi: 10.3847/1538-4357/acc2bc
-
[18]
2025, ApJL, 983, L39, doi: 10.3847/2041-8213/adc2f8
Chakraborty, J., Kara, E., Arcodia, R., et al. 2025, ApJL, 983, L39, doi: 10.3847/2041-8213/adc2f8
-
[19]
Damjanov, I., Abraham, R. G., Glazebrook, K., et al. 2011, ApJL, 739, L44, doi: 10.1088/2041-8205/739/2/L44 de Graaff, A., Setton, D. J., Brammer, G., et al. 2025, Nature Astronomy, 9, 280, doi: 10.1038/s41550-024-02424-3 D’Orazio, D. J., Loeb, A., & Guillochon, J. 2019, MNRAS, 485, 4413, doi: 10.1093/mnras/stz652
-
[20]
2021, A&A, 651, A109, doi: 10.1051/0004-6361/202039429
Dubois, Y., Beckmann, R., Bournaud, F., et al. 2021, A&A, 651, A109, doi: 10.1051/0004-6361/202039429
-
[21]
Duncan, K., Conselice, C. J., Mundy, C., et al. 2019, ApJ, 876, 110, doi: 10.3847/1538-4357/ab148a
-
[22]
Fan, X., Strauss, M. A., Richards, G. T., et al. 2001, AJ, 121, 31, doi: 10.1086/318032
-
[23]
Finkelstein, S. L., Bagley, M. B., Ferguson, H. C., et al. 2023, ApJL, 946, L13, doi: 10.3847/2041-8213/acade4
-
[24]
Finkelstein, S. L., Leung, G. C. K., Bagley, M. B., et al. 2024, ApJL, 969, L2, doi: 10.3847/2041-8213/ad4495
-
[25]
Fox, O. D., Rest, A., Pierel, J. D. R., et al. 2026, arXiv e-prints, arXiv:2601.08931, doi: 10.48550/arXiv.2601.08931
-
[26]
Zabludoff, A. I. 2020, SSRv, 216, 32, doi: 10.1007/s11214-020-00657-y
-
[27]
2014, MNRAS, 445, 175, doi: 10.1093/mnras/stu1654
Genel, S., Vogelsberger, M., Springel, V., et al. 2014, MNRAS, 445, 175, doi: 10.1093/mnras/stu1654
-
[28]
2026, MNRAS, 545, staf1979, doi: 10.1093/mnras/staf1979
Geris, S., Maiolino, R., Isobe, Y., et al. 2026, MNRAS, 545, staf1979, doi: 10.1093/mnras/staf1979
-
[29]
2021, ARA&A, 59, 21, doi: 10.1146/annurev-astro-111720-030029
Gezari, S. 2021, ARA&A, 59, 21, doi: 10.1146/annurev-astro-111720-030029
-
[30]
2022, A&A, 666, A17, doi: 10.1051/0004-6361/202243708
Gilli, R., Norman, C., Calura, F., et al. 2022, A&A, 666, A17, doi: 10.1051/0004-6361/202243708
-
[31]
Graur, O., French, K. D., Zahid, H. J., et al. 2018, ApJ, 853, 39, doi: 10.3847/1538-4357/aaa3fd
-
[32]
A., Pacucci, F., & Kocevski, D
Guia, C. A., Pacucci, F., & Kocevski, D. D. 2024, Research Notes of the American Astronomical Society, 8, 207, doi: 10.3847/2515-5172/ad7262
-
[33]
2024, ApJ, 966, 160, doi: 10.3847/1538-4357/ad2f9f
Guolo, M., Gezari, S., Yao, Y., et al. 2024, ApJ, 966, 160, doi: 10.3847/1538-4357/ad2f9f
-
[34]
2025, arXiv e-prints, arXiv:2510.26774, doi: 10.48550/arXiv.2510.26774
Guolo, M., Mummery, A., van Velzen, S., et al. 2025, arXiv e-prints, arXiv:2510.26774, doi: 10.48550/arXiv.2510.26774
-
[35]
Habouzit, M., Li, Y., Somerville, R. S., et al. 2021, MNRAS, 503, 1940, doi: 10.1093/mnras/stab496
-
[36]
2021, ApJL, 908, L20, doi: 10.3847/2041-8213/abdcb4
Hammerstein, E., Gezari, S., van Velzen, S., et al. 2021, ApJL, 908, L20, doi: 10.3847/2041-8213/abdcb4
-
[37]
2025, in American Astronomical Society Meeting Abstracts, Vol
Hannah, C., Seth, A., Stone, N., & van Velzen, S. 2025, in American Astronomical Society Meeting Abstracts, Vol. 245, American Astronomical Society Meeting Abstracts #245, 447.04D
2025
-
[38]
Hannah, C. H., Stone, N. C., Seth, A. C., & van Velzen, S. 2025, ApJ, 988, 29, doi: 10.3847/1538-4357/addd1b
-
[39]
2023, ApJ, 959, 39, doi: 10.3847/1538-4357/ad029e
Harikane, Y., Zhang, Y., Nakajima, K., et al. 2023, ApJ, 959, 39, doi: 10.3847/1538-4357/ad029e
-
[40]
M., Kauffmann, G., Brinchmann, J., et al
Heckman, T. M., Kauffmann, G., Brinchmann, J., et al. 2004, ApJ, 613, 109, doi: 10.1086/422872
doi:10.1086/422872 2004
-
[41]
Hills, J. G. 1975, Nature, 254, 295, doi: 10.1038/254295a0
doi:10.1038/254295a0 1975
-
[42]
Hopkins, P. F., Hernquist, L., Cox, T. J., & Kereˇ s, D. 2008, ApJS, 175, 356, doi: 10.1086/524362 22Karmen et al
doi:10.1086/524362 2008
-
[43]
Hopkins, P. F., Richards, G. T., & Hernquist, L. 2007, ApJ, 654, 731, doi: 10.1086/509629
doi:10.1086/509629 2007
-
[44]
Inayoshi, K., Harikane, Y., Inoue, A. K., Li, W., & Ho, L. C. 2022, ApJL, 938, L10, doi: 10.3847/2041-8213/ac9310
-
[45]
2024, ApJ, 966, 164, doi: 10.3847/1538-4357/ad344c
Inayoshi, K., Kashiyama, K., Li, W., et al. 2024, ApJ, 966, 164, doi: 10.3847/1538-4357/ad344c
-
[46]
2020, ARA&A, 58, 27, doi: 10.1146/annurev-astro-120419-014455 Ivezi´ c,ˇZ., Kahn, S
Inayoshi, K., Visbal, E., & Haiman, Z. 2020, ARA&A, 58, 27, doi: 10.1146/annurev-astro-120419-014455 Ivezi´ c,ˇZ., Kahn, S. M., Tyson, J. A., et al. 2019, ApJ, 873, 111, doi: 10.3847/1538-4357/ab042c
-
[47]
W., Casetti-Dinescu, D
Jha, S. W., Casetti-Dinescu, D. I., Bernstein, G. M., et al. 2024,, STScI Technical Note / internal document https://outerspace.stsci.edu/spaces/HPR/pages/ 173148154/Long- term+variability+monitoring+strategies+for+HST+ and+JWST?preview=/173148154/251887753/ltvm.pdf
2024
-
[48]
Kakiichi, K., Egami, E., Fan, X., et al. 2024,, JWST Proposal. Cycle 3, ID. #5893 Kar Chowdhury, R., Chang, J. N. Y., Dai, L., & Natarajan, P. 2024, ApJL, 966, L33, doi: 10.3847/2041-8213/ad41b7
-
[49]
2025, ApJ, 990, 149, doi: 10.3847/1538-4357/adf216
Karmen, M., Gezari, S., Lambrides, E., et al. 2025, ApJ, 990, 149, doi: 10.3847/1538-4357/adf216
-
[50]
2017, MNRAS, 467, 4739, doi: 10.1093/mnras/stx126
Kaviraj, S., Laigle, C., Kimm, T., et al. 2017, MNRAS, 467, 4739, doi: 10.1093/mnras/stx126
-
[51]
Kelly, B. C., & Merloni, A. 2012, Advances in Astronomy, 2012, 970858, doi: 10.1155/2012/970858
-
[52]
C., Vestergaard, M., Fan, X., et al
Kelly, B. C., Vestergaard, M., Fan, X., et al. 2010, ApJ, 719, 1315, doi: 10.1088/0004-637X/719/2/1315
-
[53]
1994, Stellar Structure and Evolution
Kippenhahn, R., & Weigert, A. 1994, Stellar Structure and Evolution
1994
-
[54]
Kochanek, C. S. 2016, MNRAS, 461, 371, doi: 10.1093/mnras/stw1290
-
[55]
2025, arXiv e-prints, arXiv:2510.21709, doi: 10.48550/arXiv.2510.21709
Kritos, K., & Silk, J. 2025, arXiv e-prints, arXiv:2510.21709, doi: 10.48550/arXiv.2510.21709
-
[56]
Law-Smith, J., Ramirez-Ruiz, E., Ellison, S. L., & Foley, R. J. 2017, ApJ, 850, 22, doi: 10.3847/1538-4357/aa94c7
-
[57]
Lightman, A. P., & Shapiro, S. L. 1977, ApJ, 211, 244, doi: 10.1086/154925
doi:10.1086/154925 1977
-
[58]
Lotz, J. M., Jonsson, P., Cox, T. J., et al. 2011, ApJ, 742, 103, doi: 10.1088/0004-637X/742/2/103
-
[59]
2018, ApJ, 853, 141, doi: 10.3847/1538-4357/aaa714
Madigan, A.-M., Halle, A., Moody, M., et al. 2018, ApJ, 853, 141, doi: 10.3847/1538-4357/aaa714
-
[60]
1999, MNRAS, 309, 447, doi: 10.1046/j.1365-8711.1999.02853.x
Magorrian, J., & Tremaine, S. 1999, MNRAS, 309, 447, doi: 10.1046/j.1365-8711.1999.02853.x
arXiv 1999
-
[61]
2024a, A&A, 691, A145, doi: 10.1051/0004-6361/202347640
Maiolino, R., Scholtz, J., Curtis-Lake, E., et al. 2024a, A&A, 691, A145, doi: 10.1051/0004-6361/202347640
-
[62]
2024b, Nature, 627, 59, doi: 10.1038/s41586-024-07052-5
Maiolino, R., Scholtz, J., Witstok, J., et al. 2024b, Nature, 627, 59, doi: 10.1038/s41586-024-07052-5
-
[63]
2024, ApJ, 961, 211, doi: 10.3847/1538-4357/ad18bb
Masterson, M., De, K., Panagiotou, C., et al. 2024, ApJ, 961, 211, doi: 10.3847/1538-4357/ad18bb
-
[64]
2018, ApJS, 237, 5, doi: 10.3847/1538-4365/aac724
Matsuoka, Y., Iwasawa, K., Onoue, M., et al. 2018, ApJS, 237, 5, doi: 10.3847/1538-4365/aac724
-
[65]
2025, ApJL, 992, L21, doi: 10.3847/2041-8213/ae0a2e
Melchor, D., Naoz, S., Gezari, S., & Mockler, B. 2025, ApJL, 992, L21, doi: 10.3847/2041-8213/ae0a2e
-
[66]
2008, MNRAS, 388, 1011, doi: 10.1111/j.1365-2966.2008.13472.x
Merloni, A., & Heinz, S. 2008, MNRAS, 388, 1011, doi: 10.1111/j.1365-2966.2008.13472.x
arXiv 2008
-
[67]
Mo, H. J., Mao, S., & White, S. D. M. 1998, MNRAS, 295, 319, doi: 10.1046/j.1365-8711.1998.01227.x
arXiv 1998
-
[68]
2025, MNRAS, 541, 429, doi: 10.1093/mnras/staf938
Mummery, A., & van Velzen, S. 2025, MNRAS, 541, 429, doi: 10.1093/mnras/staf938
-
[69]
2024, MNRAS, 527, 2452, doi: 10.1093/mnras/stad3001
Mummery, A., van Velzen, S., Nathan, E., et al. 2024, MNRAS, 527, 2452, doi: 10.1093/mnras/stad3001
-
[70]
2015, ARA&A, 53, 365, doi: 10.1146/annurev-astro-082214-122302
Netzer, H. 2015, ARA&A, 53, 365, doi: 10.1146/annurev-astro-082214-122302
-
[71]
Nicholl, M., Pasham, D. R., Mummery, A., et al. 2024, Nature, 634, 804, doi: 10.1038/s41586-024-08023-6 Observations Time Allocation Committee, R., & Community Survey Definition Committees, C. 2025, arXiv e-prints, arXiv:2505.10574, doi: 10.48550/arXiv.2505.10574
-
[72]
Ormerod, K., Conselice, C. J., Adams, N. J., et al. 2024, MNRAS, 527, 6110, doi: 10.1093/mnras/stad3597
-
[73]
A., Fremling, C., Sollerman, J., et al
Perley, D. A., Fremling, C., Sollerman, J., et al. 2020, ApJ, 904, 35, doi: 10.3847/1538-4357/abbd98
-
[74]
Capelo, P. R. 2019, MNRAS, 488, L29, doi: 10.1093/mnrasl/slz091
-
[75]
Pfister, H., Dai, J. L., Volonteri, M., et al. 2021, MNRAS, 500, 3944, doi: 10.1093/mnras/staa3471
-
[76]
Pfister, H., Volonteri, M., Dai, J. L., & Colpi, M. 2020, MNRAS, 497, 2276, doi: 10.1093/mnras/staa1962 Planck Collaboration, Aghanim, N., Akrami, Y., et al. 2020, A&A, 641, A6, doi: 10.1051/0004-6361/201833910
-
[77]
Ramsden, P., Nicholl, M., McGee, S. L., & Mummery, A. 2025, MNRAS, 541, 1218, doi: 10.1093/mnras/staf1059
-
[78]
Rees, M. J. 1978, in IAU Symposium, Vol. 77, Structure and Properties of Nearby Galaxies, ed. E. M. Berkhuijsen & R. Wielebinski, 237
1978
-
[79]
M., Baltay, C., Hounsell, R., et al
Rose, B. M., Baltay, C., Hounsell, R., et al. 2021, arXiv e-prints, arXiv:2111.03081, doi: 10.48550/arXiv.2111.03081
-
[80]
Salpeter, E. E. 1955, ApJ, 121, 161, doi: 10.1086/145971
doi:10.1086/145971 1955
discussion (0)
Sign in with ORCID, Apple, or X to comment. Anyone can read and Pith papers without signing in.