REVIEW 3 major objections 5 minor 52 references
Excitation function measurement of $^{144}$Sm($\alpha$,n) reaction at sub-Coulomb energies and detailed covariance analysis
T0 review · 3 major / 5 minor · reviewed 2026-08-02 · deepseek-v4-flash
Pith's one-line read New cross sections for 144Sm(alpha,n)147Gd at five sub-Coulomb energies are reported, together with the first complete covariance analysis for this reaction, giving data relevant to p-process nucleosynthesis and the medical isotope 147Gd.
desk verdict New sub-Coulomb 144Sm(α,n) cross sections with a careful covariance treatment; the energy-binning bias at the lowest points is real and should be addressed before publication. read the letter →
The pith
A machine-rendered reading of the paper's core claim, the machinery that carries it, and where it could break.
The reading
What carries the argument
The carrying mechanism is the stacked-foil activation measurement combined with a covariance analysis. A single 28 MeV alpha beam is sent through a series of thin, isotopically enriched 144Sm2O3 targets separated by aluminium degraders, so that one irradiation produces five different sub-Coulomb bombarding energies. A Monte Carlo simulation of energy loss and straggling through the degraders and targets fixes the mean energy and its 1σ spread at each foil. Each cross section is then derived from the offline gamma-ray activity of the 147Gd product (mainly the 229.3 keV line) using the activation formula, and the uncertainties of all inputs — beam current, detector efficiency, gamma-ray intens
What would settle it
Re-measure the target thicknesses with an independent method (e.g., ion-beam backscattering) or re-measure the cross sections at the same five energies using a different target preparation; if the new thickness values fall outside the reported 15–25% range, or if an independent cross-section point at 14.1 MeV differs from 0.79 mb by more than 0.20 mb, the absolute scale of the data would be in question.
Extended reading notes
Core claim
On its own terms, the paper reports five absolute cross sections for 144Sm(alpha,n)147Gd below the Coulomb barrier: 594.61 ± 154.38 mb at 20.90 ± 0.18 MeV, 431.44 ± 112.03 mb at 19.34 ± 0.20 MeV, 124.53 ± 32.45 mb at 17.68 ± 0.22 MeV, 20.52 ± 5.35 mb at 16.03 ± 0.27 MeV, and 0.79 ± 0.20 mb at 14.09 ± 0.30 MeV. The measurements were obtained by degrading one 28 MeV alpha beam through a stack of aluminium foils and five thin 144Sm2O3 targets, with the effective energy at each target determined by Monte Carlo simulation. The paper's methodological claim is that it is the first measurement of this reaction to include a full covariance analysis, so that the uncertainties (dominated by target thic
Load-bearing premise
The entire normalization of the five cross sections rests on the measured thickness (areal density) of the thin 144Sm2O3 targets; if that measurement is systematically off by some factor, every reported cross section is off by the same factor.
Editorial extensions
If this is right
- The five cross-section points can be inserted directly into stellar nucleosynthesis networks, updating the production/destruction balance for 144Sm and neighboring p-nuclei.
- Because the full covariance matrix is given, reaction-rate calculations for this channel can correctly propagate the common systematic components (beam flux, efficiency, gamma intensity) instead of assuming the points are independent.
- The finding that the alpha optical-model potential dominates the theoretical spread suggests that these data can serve as a new constraint on alpha-nucleus potentials at sub-Coulomb energies.
- For applied purposes, the cross sections give a quantitative basis for predicting 147Gd yields from alpha irradiation of enriched 144Sm, relevant to SPET imaging.
- The two lowest-energy points, where the cross section drops steeply, provide a sharp test for any statistical-model calculation in the far-sub-Coulomb regime.
Reading between the lines
- The authors' 15–25% target-thickness uncertainty is the largest single contribution; an independent thickness measurement (for example by backscattering spectrometry) would directly test the absolute scale of all five cross sections, since the cross section is inversely proportional to target thickness.
- The reported ~7–8% correlations imply that ignoring correlations when these points feed into a reaction network would slightly understate the uncertainty on the derived stellar reaction rate; the provided matrix allows that error to be handled exactly.
- If the two lowest-energy points are confirmed by an independent measurement, they could become benchmarks for the alpha optical potential in a regime where theoretical predictions are strongly divergent.
- The paper's use of a single 28 MeV beam and Monte Carlo energy determination could be validated by directly measuring the degraded beam energy at each target position with a detector, which would check the simulation's energy-loss and straggling model.
Editorial analysis
A structured set of objections, weighed in public.
Referee Report
Summary. The paper reports new activation measurements of the 144Sm(α,n)147Gd cross section at five sub-Coulomb energies between 14.09 and 20.90 MeV, using stacked Sm2O3 targets on aluminium backings, GEANT4-simulated beam-energy distributions, offline γ-ray spectroscopy, and a detailed covariance/correlation analysis. The results are compared with earlier measurements and with a 432-combination Hauser-Feshbach spread from TALYS-2.0. The authors state that this is the first covariance analysis for this reaction and that the data are relevant for p-process nucleosynthesis and 147Gd production.
Significance. If the systematic issues below are addressed, the data set fills a gap at sub-Coulomb energies for a p-process nucleus and provides a useful covariance framework for future reaction-rate evaluations. The authors are to be credited for running GEANT4 energy-straggling simulations, applying EFFTRAN summing and extended-geometry corrections, and scanning a wide model space in TALYS. The covariance matrices appear internally consistent with the quoted uncertainty budget. However, the absolute normalization and the treatment of energy spreading over the target are currently not sufficiently quantified for the reported cross sections to be used as final nuclear-data values.
major comments (3)
- [Sec. 3.1 / Table 5] Eq. (3) evaluates σ at the fitted mean energy Ē, but the measured activity is the yield average ⟨σ⟩ = ∫σ(E)φ(E)dE / ∫φ(E)dE over the GEANT4 energy distribution. For a sub-Coulomb (α,n) reaction lnσ ≈ πη/E, so at 14.09 MeV b ≈ 2.3 MeV⁻¹; with the Table 5 width 0.30 MeV this gives ⟨σ⟩/σ(Ē) ≈ 1.25, and ≈ 1.13, 1.06, 1.04, 1.025 at 16.03, 17.68, 19.34, 20.90 MeV. The bias is not included in Table 7 or the covariance matrix of Table 8, and it steepens the low-energy tail in Fig. 9. The authors should correct for this by folding a trial σ(E) through the simulated distributions, or at least quote the model-dependent correction as a systematic uncertainty.
- [Sec. 2.1 / Eq. (3)] N_target is never explicitly defined as the areal density of 144Sm nuclei. The targets are 67% enriched Sm2O3; if the weighed 280–350 μg/cm² layer thickness were used directly in Eq. (3), all five cross sections would be incorrect by a factor related to the enrichment and stoichiometry. Because σ ∝ 1/N_target and the target thickness is the dominant 15–25% uncertainty, the paper must state the conversion from mass per area to N_target(144Sm), and include the uncertainties in enrichment, stoichiometry, and the 229Th thickness measurement. This is needed to assess the absolute scale of the data.
- [Sec. 3.3 / Table 7] The target-thickness contribution is entered as a purely uncorrelated uncertainty. However, if the 67% enrichment fraction, the Sm2O3 stoichiometry, or the calibration of the 229Th thickness method is common to all five targets, these components are common-mode and should appear in the covariance matrix as a correlated systematic. As written, the reported 7–8% correlations may underestimate the normalization correlations. Separate the thickness uncertainty into random (weighing/deposition) and common (enrichment/stoichiometry/calibration) components.
minor comments (5)
- [Eq. (3)] The text says 'proton flux' but the beam is 4He2+. Clarify that φ_b is the alpha-particle flux in particles/s, not the electrical beam current, and state how the 5% beam-current uncertainty accounts for charge-state and electron-suppression effects.
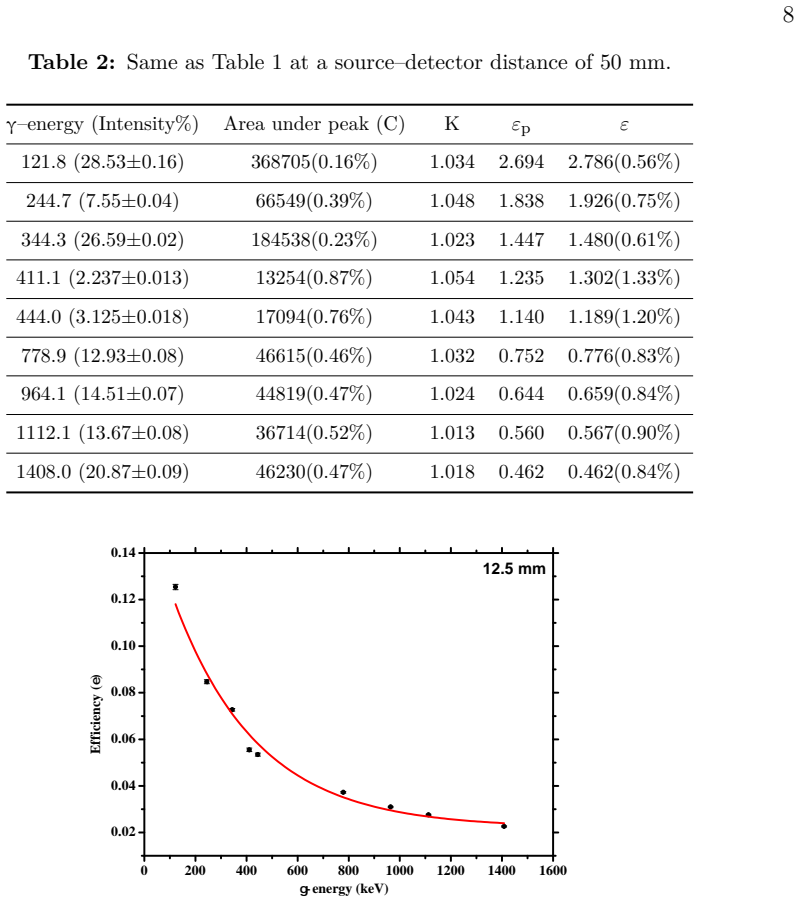
- [Tables 1 and 2] Units are inconsistent: Table 1 lists efficiencies as fractions (0.1293), while Table 2 lists values such as 2.694 and 2.786, apparently in percent. Use the same convention and state it explicitly in the captions.
- [Sec. 2.3] The initial beam-energy spread is generated as a uniform random distribution with 0.2 MeV FWHM, but Table 5 reports 1σ uncertainties. State how the 0.2 MeV FWHM was converted to the Gaussian 1σ widths used in the simulation and whether the energy distributions were actually Gaussian.
- [Sec. 4 / Fig. 9] The grey band is the max–min envelope of 432 TALYS combinations; this is not a statistical confidence interval. Define its interpretation and, if possible, add a residual or ratio panel to quantify the agreement of the present data with the selected AOMP curves and with the literature data.
- [Data availability] For a nuclear-data measurement paper, raw peak areas, individual target thicknesses, irradiation/counting times, and simulation outputs should be provided in a supplement. The statement that data are 'available upon request' is not sufficient for independent verification.
Circularity Check
No significant circularity: cross sections are obtained from measured activities and independently calibrated detector efficiency; theoretical comparison is external.
full rationale
The derivation chain is a standard activation measurement. Eq. (3) computes sigma from measured peak counts C, beam flux phi_b, target thickness N_target, gamma intensity I_gamma, and detector efficiency epsilon_det. Each input is determined independently: N_target by weighing and a 229Th alpha source; epsilon_det from a 152Eu standard via Eq. (1) and an efficiency curve fitted to that standard (Eq. 2, Tables 1-4), not to the reaction data; beam energy distributions from GEANT4; decay parameters from literature. The covariance matrix (Eq. 5, Table 8) propagates these independent input uncertainties; it does not fit any parameter to the measured cross sections. The TALYS band is a grid of model combinations and is compared with, rather than fitted to, the new data. Self-citations (e.g., Refs. [4,20] for target preparation) support experimental methods but are not load-bearing for the central cross-section result. The reviewer's concern about assigning measured activation yields to mean beam energy is a physics/statistical-bias question about energy averaging, not a circularity of the paper's derivation; it does not make the output equivalent to an input by construction. No circular step satisfying the quoted-reduction criterion was found.
Assumptions & free parameters
free parameters (6)
- 12.5 mm efficiency curve epsilon_0 =
0.002205
- 12.5 mm efficiency curve epsilon_1 =
0.13897
- 12.5 mm efficiency curve E_0 =
329.427
- 50 mm efficiency curve epsilon_0 =
0.00458
- 50 mm efficiency curve epsilon_1 =
0.03187
- 50 mm efficiency curve E_0 =
319.27841
assumptions (5)
- domain assumption The activation equation (Eq. 3) correctly relates measured 229.3 keV gamma counts to the reaction cross section (thin-target approximation, known decay and gamma-emission data).
- domain assumption Target layers are stoichiometric Sm2O3 with the stated 67% 144Sm enrichment and the measured areal thickness.
- domain assumption GEANT4 physics lists and the geometry model correctly simulate energy loss and straggling through Al degraders, Sm2O3 layers and Al backings.
- domain assumption The 152Eu source activity, EFFTRAN summing corrections and point-to-extended geometry corrections yield accurate detector efficiency.
- domain assumption Hauser-Feshbach statistical model (TALYS) is an appropriate framework for predicting the (alpha,n) cross section in this mass/energy region.
Cite this review
Pith. "Pith review of Excitation function measurement of $^{144}$Sm($\alpha$,n) reaction at sub-Coulomb energies and detailed covariance analysis." pith.science (2026). https://pith.science/paper/4JD6AV7Y
@misc{pith2026260221011,
  author       = {Pith},
  title        = {Pith review of: Excitation function measurement of $^144$Sm($\alpha$,n) reaction at sub-Coulomb energies and detailed covariance analysis},
  year         = {2026},
  howpublished = {\url{https://pith.science/paper/4JD6AV7Y}},
  note         = {Machine review of arXiv:2602.21011}
}
abstract
The cross-section measurement of $^{144}$Sm($\alpha$,n)$^{147}$Gd (T$_{1/2}=$38.06(12) h) reaction has been performed at sub-Coulomb energies around 14$-$21 MeV ($V_{coul}\approx 21.8$ MeV) using the stacked foil activation technique. Irradiated targets were prepared from enriched (67\%) $^{144}$Sm$_2$O$_3$ powder using molecular deposition technique between thickness 280$-$350 $\mu$g/cm$^2$ on high purity Al backing. A detailed simulation has been carried out to address the energy uncertainty in the irradiated beam energy followed by a comprehensive discussion of various uncertainties in the form of covariance and correlation matrices. Finally the excitation functions are compared with the previously measured experimental data from literature and the theoretical predictions obtained using Hauser-Feshbach statistical model code.
Figures


Figures from the paper (6 more)



Reference graph
Works this paper leans on
-
[1]
Qaim S M, Spahn I, Scholten B and Neumaier B 2016 Radiochimica acta 104 601–624
2016
-
[2]
Uddin M, Hermanne A, Sudár S, Aslam M, Scholten B, Coenen H and Qaim S 2011 Applied radiation and isotopes 69 699–704
2011
-
[3]
Choudhary M, Gandhi A, Sharma A, Singh N, Dubey P, Upadhyay M, Dasgupta S, Datta J and Kumar A 2022 The European Physical Journal A 58 95
2022
-
[4]
Bar T, Basak D, Sahoo L K, Saha S, Datta J, Dasgupta S and Basu C 2024 Journal of Physics G: Nuclear and Particle Physics 51 075104
2024
-
[5]
Basak D, Bar T, Sahoo L K, Saha S, Datta J, Dasgupta S, Roy A, Kinoshita N and Basu C 2024 Physical Review C 110 065807
2024
-
[6]
Saha S, Basak D, Bar T, Sahoo L K, Datta J, Dasgupta S, Kinoshita N and Basu C 2025 Journal of Physics G: Nuclear and Particle Physics 52 065101
2025
-
[7]
Upadhyay M, Choudhary M, Singh N, Gandhi A, Dubey P, Dasgupta S, Datta J, Kopatch Y N, Ruskov I and Kumar A 2025 Journal of Radioanalytical and Nuclear Chemistry 334 6423–6429
2025
-
[8]
2018 Nuclear Data Sheets 148 338–382
Hermanne A, Ignatyuk A V, Capote R, Carlson B V, Engle J W, Kellett M A, Kibedi T, Kim G, Kondev F G, Hussain M et al. 2018 Nuclear Data Sheets 148 338–382
2018
Show all 52 references
-
[9]
Mukhopadhyay B and Mukhopadhyay K 2011 J. Nucl. Med. Radiat. Ther 2 1000115
2011
-
[10]
Denzler F O, Lebedev N, Novgorodov A, Rösch F and Qaim S 1997 Applied radiation and isotopes 48 319–326
1997
-
[11]
Denzler F O, Roesch F and Qaim S M 1995 Radiochimica Acta 69 209–213
1995
-
[12]
Nica N and Singh B 2022 Nuclear Data Sheets 181 1–474
2022
-
[13]
Arnould M and Goriely S 2003 Physics Reports 384 1–84
2003
-
[14]
Woosley S and Howard W 1978 Astrophysical Journal Supplement Series, vol. 36, Feb. 1978, p. 285-304. 36 285–304
1978
-
[15]
Gyürky G, Mohr P, Angyal A, Halász Z, Kiss G, Mátyus Z, Szegedi T, Szücs T and Fülöp Z 2023 Physical Review C 107 025803
2023
-
[16]
Archenti A, Ozafran M and Nassiff S 1989 Journal of radioanalytical and nuclear chemistry 132 139–151
1989
-
[17]
Koning A, Hilaire S and Goriely S 2023 The European Physical Journal A 59 131
2023
-
[18]
Nica N 2026 Nuclear Data Sheets 208 1–396
2026
-
[19]
Parker W, Bildstein H and Getoff N 1964 Nuclear Instruments and Methods 26 55–60
1964
-
[20]
Bar T, Basak D, Saha S and Basu C 2022 Preparation of targets by electro-deposition Proceedings of the DAE-BRNS symposium on nuclear physics. V. 66
2022
-
[21]
Apostolakis J, Wright D H and Collaboration G 2007 An overview of the geant4 toolkit AIP Conference Proceedings vol 896 (American Institute of Physics) pp 1–10
2007
-
[22]
Brun R and Rademakers F 1997 Nuclear instruments and methods in physics research section A: accelerators, spectrometers, detectors and associated equipment 389 81–86
1997
-
[23]
sciencedirect.com/science/article/pii/S0090375213000744
Martin M 2013 Nuclear Data Sheets 114 1497–1847 ISSN 0090-3752 URL https://www. sciencedirect.com/science/article/pii/S0090375213000744
2013
-
[24]
Punte L R M, Lalremruata B, Otuka N, Suryanarayana S V, Iwamoto Y, Pachuau R, Satheesh B, Thanga H H, Danu L S, Desai V V, Hlondo L R, Kailas S, Ganesan S, Nayak B K and Saxena A 2017 Phys. Rev. C 95(2) 024619 URL https://link.aps.org/doi/10.1103/PhysRevC.95. 024619
2017 doi
-
[25]
Demetriou P, Grama C and Goriely S 2002 Nuclear Physics A 707 253–276 17
2002
-
[26]
Gilbert A and Cameron A 1965 Canadian Journal of Physics 43 1446–1496
1965
-
[27]
Ericson T 1960 Advances in Physics 9 425–511
1960
-
[28]
Kopecky J and Uhl M 1990 Physical Review C 41 1941
1990
-
[29]
A vrigeanu V, A vrigeanu M and Mănăilescu C 2014 Physical Review C 90 044612
2014
-
[30]
Goriely S 2006 http://www-nds. iaea. org/RIPL-2/densities. html
2006
-
[31]
Brink D 1957 Nuclear Physics 4 215–220
1957
-
[32]
Axel P 1962 Physical Review 126 671
1962
-
[33]
Koning A and Delaroche J 2003 Nuclear Physics A 713 231–310
2003
-
[34]
Watanabe S 1958 Nuclear Physics 8 484–492
1958
-
[35]
McFadden L and Satchler G 1966 Nuclear Physics 84 177–200
1966
-
[36]
Nolte M, Machner H and Bojowald J 1987 Physical Review C 36 1312
1987
-
[37]
A vrigeanu V, Hodgson P and A vrigeanu M 1994 Physical Review C 49 2136
1994
-
[38]
Dilg W, Schantl W, Vonach H and Uhl M 1973 Nuclear Physics A 217 269–298
1973
-
[39]
Ignatyuk A 1979 Sov. J. Nucl. Phys 30 626
1979
-
[40]
Ignatyuk A, Weil J, Raman S and Kahane S 1993 Physical Review C 47 1504
1993
-
[41]
Hilaire S, Girod M, Goriely S and Koning A J 2012 Physical Review C 86 064317
2012
-
[42]
Goriely S and Khan E 2002 Nuclear Physics A 706 217–232
2002
-
[43]
Goriely S, Khan E and Samyn M 2004 Nuclear Physics A 739 331–352
2004
-
[44]
Goriely S 1998 Physics Letters B 436 10–18
1998
-
[45]
Daoutidis I and Goriely S 2012 Physical Review C 86 034328
2012
-
[46]
Goriely S, Hilaire S, Péru S and Sieja K 2018 Physical Review C 98 014327
2018
-
[47]
Plujko V, Gorbachenko O and Solodovnyk K 2019 The European Physical Journal A 55 210
2019
-
[48]
Smith D and Otuka N 2012 Nuclear Data Sheets 113 3006–3053
2012
-
[49]
Lawriniang B, Ghosh R, Badwar S, Yerraguntla S S, Jyrwa B, Naik H, Naik Y and Suryanarayana S 2019 Journal of Radioanalytical and Nuclear Chemistry 319 695–701
2019
-
[50]
Bevington P R and Robinson D K 2003 Data Reduction and Error Analysis for the Physical Sciences 3rd ed (McGraw-Hill)
2003
-
[51]
Otuka N, Lalremruata B, Khandaker M, Usman A and Punte L 2017 Radiation Physics and Chemistry 140 502–510
2017
-
[52]
Cowan G 1998 Statistical Data Analysis (Oxford University Press)
1998
Reviewed August 2, 2026 · model on record in the stance chip above.
Discussion (0). Continue with ORCID to comment.