Recognition: 2 theorem links
· Lean TheoremLearning relaxation time distributions from spectral induced polarization data with a complex-valued variational autoencoder
Pith reviewed 2026-05-15 11:37 UTC · model grok-4.3
The pith
A conditional variational autoencoder learns continuous relaxation time distributions directly from complex resistivity spectra.
A machine-rendered reading of the paper's core claim, the machinery that carries it, and where it could break.
Core claim
The authors claim that a conditional variational autoencoder trained on complex resistivity spectra learns a shared mapping to continuous relaxation time distributions, achieving reconstruction errors of 0.45 percent for the imaginary component and 0.24 percent for the phase, with statistically significant gains over conventional methods, while the inferred distributions remain physically consistent and their total chargeability and mean relaxation time correlate with polarizable grain content and grain size at coefficients of determination up to 0.98.
What carries the argument
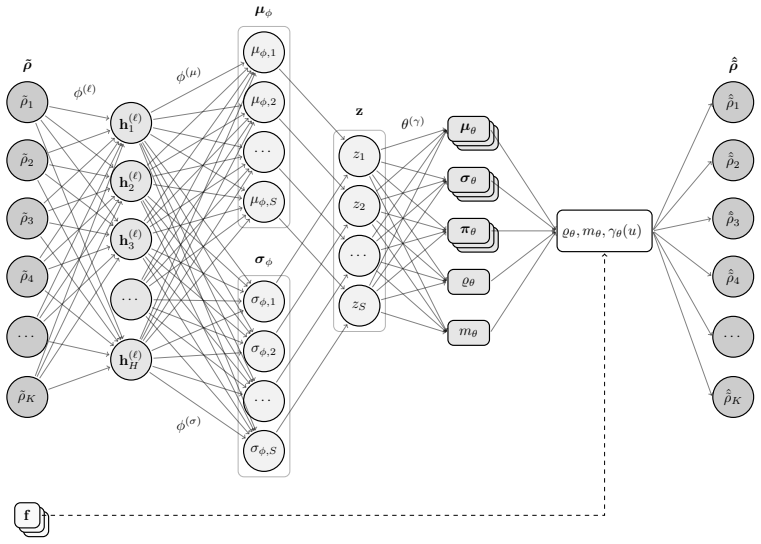
A conditional variational autoencoder (CVAE) that encodes complex resistivity spectra into a latent representation and decodes them to continuous relaxation time distributions.
If this is right
- The inferred relaxation time distributions remain stable and physically consistent across the tested granular mixtures, mineralized rocks, and cementitious materials.
- Total chargeability of the distributions correlates with polarizable grain content and mean relaxation time correlates with grain size, reaching coefficients of determination up to 0.98.
- The learned latent representation organizes spectra such that unsupervised clustering in two dimensions improves the Davies-Bouldin index by nearly a factor of three relative to conventional parameters.
- Reconstruction of the imaginary and phase components shows statistically significant improvement over conventional methods with p-values of 4 times 10 to the minus 6 and 2 times 10 to the minus 3.
Where Pith is reading between the lines
- If the latent space remains structured on broader field datasets, it could support automated grouping of subsurface materials without requiring labeled examples.
- The continuous output distributions may reduce manual parameter choices when processing streaming SIP data from long-term monitoring arrays.
- Extending the model to joint inversion with other geophysical measurements could tighten uncertainty bounds on subsurface property estimates.
Load-bearing premise
The unsupervised CVAE learns a generalizable mapping from resistivity spectra to physically consistent relaxation time distributions that holds for data outside the 140-sample training set without overfitting or artifacts.
What would settle it
Applying the trained model to a fresh collection of SIP spectra from materials absent from the training set and finding reconstruction errors no lower than those of standard Debye decomposition would falsify the performance claim.
Figures


read the original abstract
Spectral induced polarization (SIP) is a geophysical method used to characterize subsurface materials. It measures the frequency-dependent complex resistivity of rocks and soils through the application of a small alternating current in the subsurface or in laboratory samples. Debye decomposition (DD) is a standard method for analyzing and interpreting SIP data, as it allows estimation of the relaxation time distribution (RTD) of geomaterials. However, conventional DD approaches treat measurements independently, work in real-valued spaces despite the complex-valued nature of SIP data, and provide limited uncertainty quantification. These limitations reduce the effectiveness of conventional DD on heterogeneous datasets. We reformulate DD as an unsupervised machine learning problem and introduce a conditional variational autoencoder (CVAE) that learns a shared mapping from resistivity spectra to continuous RTDs. The model is validated on a dataset comprising 140 laboratory and field SIP measurements of granular mixtures, mineralized rocks, and cementitious materials. The CVAE operates in complex-valued data space and achieves reconstruction errors of 0.45 % and 0.24 % for the imaginary and phase components of resistivity, respectively, with statistically significant improvements over conventional methods (p-values of 4x10^-6 and 2x10^-3). The inferred RTDs are stable and physically consistent, and their total chargeability and mean relaxation time correlate with polarizable grain content and grain size, respectively, with coefficients of determination up to 0.98. An additional contribution of the proposed method is the learned latent representation, which organizes SIP spectra into a structured space. Unsupervised clustering in a two-dimensional projection of this space improves the Davies--Bouldin index by nearly a factor of three relative to conventional RTD parameters.
Editorial analysis
A structured set of objections, weighed in public.
Referee Report
Summary. The paper reformulates Debye decomposition of spectral induced polarization (SIP) data as an unsupervised learning task and proposes a conditional variational autoencoder (CVAE) that maps complex resistivity spectra to continuous relaxation time distributions (RTDs). Validated on 140 laboratory and field SIP measurements of granular mixtures, mineralized rocks, and cementitious materials, the CVAE achieves reconstruction errors of 0.45% (imaginary) and 0.24% (phase), statistically significant improvements over conventional methods, RTD-derived parameters correlating with grain content and size (R² up to 0.98), and a latent space that improves unsupervised clustering by nearly a factor of three.
Significance. If the central claims hold, the work would introduce a data-driven, complex-valued framework for SIP interpretation that learns shared mappings across heterogeneous datasets, yields stable and physically consistent RTDs, and provides a structured latent representation for clustering, offering a clear advance over independent, real-valued Debye decomposition approaches in geophysical characterization.
major comments (2)
- [Abstract] Abstract: the validation reports reconstruction errors, p-values, R² correlations, and clustering improvements exclusively on the full set of 140 samples with no mention of train/test splits, cross-validation, or external test data. This directly undermines the claim of a generalizable mapping from spectra to physically consistent RTDs, as the CVAE could overfit dataset-specific artifacts rather than learn a robust unsupervised representation.
- [Abstract] Abstract: the comparison to conventional DD baselines is performed on the identical 140-sample set used for CVAE training and evaluation, so the reported statistically significant improvements (p=4e-6 and 2e-3) do not yet demonstrate out-of-distribution performance or robustness on unseen SIP spectra.
Simulated Author's Rebuttal
We thank the referee for the constructive feedback. We agree that the abstract should more clearly describe the evaluation strategy to support claims of generalizability. We will revise the manuscript to address both major comments.
read point-by-point responses
-
Referee: [Abstract] Abstract: the validation reports reconstruction errors, p-values, R² correlations, and clustering improvements exclusively on the full set of 140 samples with no mention of train/test splits, cross-validation, or external test data. This directly undermines the claim of a generalizable mapping from spectra to physically consistent RTDs, as the CVAE could overfit dataset-specific artifacts rather than learn a robust unsupervised representation.
Authors: We acknowledge that the abstract does not specify the train/test procedure. The reported metrics reflect performance on the full 140-sample collection to demonstrate learning across heterogeneous SIP data. In the revised version we will update the abstract and add a dedicated evaluation subsection that reports 5-fold cross-validation results (training on 112 samples, testing on 28 held-out samples per fold) with average reconstruction errors, p-values, and clustering metrics computed only on the unseen folds. This will directly address generalizability within the available dataset. revision: yes
-
Referee: [Abstract] Abstract: the comparison to conventional DD baselines is performed on the identical 140-sample set used for CVAE training and evaluation, so the reported statistically significant improvements (p=4e-6 and 2e-3) do not yet demonstrate out-of-distribution performance or robustness on unseen SIP spectra.
Authors: We agree that out-of-distribution testing would strengthen the robustness claim. In the revision we will add an explicit out-of-sample experiment: a material-type hold-out (e.g., all cementitious samples) is excluded from training, the CVAE is retrained on the remaining data, and reconstruction error, RTD stability, and parameter correlations are compared against DD on the held-out spectra. These new results will be summarized in the abstract and detailed in the results section. revision: yes
Circularity Check
No significant circularity in CVAE-based RTD mapping
full rationale
The paper reformulates Debye decomposition as an unsupervised CVAE learning problem that reconstructs complex resistivity spectra while producing RTDs and a latent space. Reconstruction errors (0.45%/0.24%) are standard autoencoder training metrics on the 140-sample set, but the load-bearing claims rest on independent external correlations (R^2 up to 0.98 with measured grain content/size) and clustering improvements versus conventional DD baselines. No equations reduce by construction to inputs, no fitted parameters are relabeled as predictions, and no self-citation chain or ansatz smuggling supports the central mapping. The derivation remains self-contained against external physical benchmarks.
Axiom & Free-Parameter Ledger
free parameters (1)
- CVAE architecture and training hyperparameters
axioms (1)
- domain assumption A neural network can learn a shared mapping from complex resistivity spectra to continuous relaxation time distributions without explicit physical equations.
Lean theorems connected to this paper
-
Cost.FunctionalEquationwashburn_uniqueness_aczel unclear?
unclearRelation between the paper passage and the cited Recognition theorem.
We reformulate DD as an unsupervised machine learning problem and introduce a conditional variational autoencoder (CVAE) that learns a shared mapping from resistivity spectra to continuous RTDs... The CVAE operates in complex-valued data space and achieves reconstruction errors of 0.45 % and 0.24 %...
-
Foundation.RealityFromDistinctionreality_from_one_distinction unclear?
unclearRelation between the paper passage and the cited Recognition theorem.
The decoder... maps latent distribution samples z to the parameters of a logarithmic RTD γθ and its associated complex resistivity spectrum ˆρ̃.
What do these tags mean?
- matches
- The paper's claim is directly supported by a theorem in the formal canon.
- supports
- The theorem supports part of the paper's argument, but the paper may add assumptions or extra steps.
- extends
- The paper goes beyond the formal theorem; the theorem is a base layer rather than the whole result.
- uses
- The paper appears to rely on the theorem as machinery.
- contradicts
- The paper's claim conflicts with a theorem or certificate in the canon.
- unclear
- Pith found a possible connection, but the passage is too broad, indirect, or ambiguous to say the theorem truly supports the claim.
Reference graph
Works this paper leans on
-
[1]
Hydrology and Earth System Sciences 17, 4079–4094
Spectral induced polarization measurements for predicting the hydraulic conductivity in sandy aquifers. Hydrology and Earth System Sciences 17, 4079–4094. doi:10.5194/hess-17-4079-2013. Bairlein, K., Hördt, A., Nordsiek, S.,
-
[2]
Near Surface Geophysics 12, 667–678
The influence on sample preparation on spectral induced polarization of unconsolidated sediments. Near Surface Geophysics 12, 667–678. doi:https://doi.org/10.3997/ 1873-0604.2014023. Benzetta, R.,
-
[3]
Bayesian inference of petrophysical properties with generative spectral induced polarization models. Geophysics 88, E79– E90. doi:10.1190/geo2022-0495.1. 38 Bérubé, C.L., Chouteau, M., Shamsipour, P., Enkin, R.J., Olivo, G.R.,
-
[4]
Computers & Geosciences 105, 51–64
Bayesian inference of spectral induced polarization parameters for labora- tory complex resistivity measurements of rocks and soils. Computers & Geosciences 105, 51–64. doi:10.1016/j.cageo.2017.05.001. Bérubé, C.L., Gagnon, S., Kenko, E.R., Gagnon, J.L., Nagasingha, L.M.A., Ghanati, R., Baron, F.,
-
[5]
Geophysical Journal International 243, ggaf348
Complex-valued neural networks for spectral induced polarization applications. Geophysical Journal International 243, ggaf348. doi:10.1093/gji/ggaf348. Bérubé, C.L., Olivo, G.R., Chouteau, M., Perrouty, S.,
-
[6]
Mineralog- ical and textural controls on spectral induced polarization signatures of the Canadian Malartic gold deposit: Applications to mineral exploration. Geophysics 84, B135–B151. doi:10.1190/geo2018-0404.1. Flores Orozco, A., Kemna, A., Oberdörster, C., Zschornack, L., Leven, C., Dietrich, P., Weiss, H.,
-
[7]
Journal of Contaminant Hydrology 136-137, 131–144
Delineation of subsurface hydrocarbon con- tamination at a former hydrogenation plant using spectral induced po- larization imaging. Journal of Contaminant Hydrology 136-137, 131–144. doi:10.1016/j.jconhyd.2012.06.001. Florsch, N., Revil, A., Camerlynck, C.,
-
[8]
Journal of Applied Geophysics 109, 119–132
Inversion of generalized relax- ation time distributions with optimized damping parameter. Journal of Applied Geophysics 109, 119–132. doi:10.1016/j.jappgeo.2014.07.013. Ghorbani, A., Camerlynck, C., Florsch, N., Cosenza, P., Revil, A.,
-
[9]
Geophysical Prospecting 55, 589–605
Bayesian inference of the Cole–Cole parameters from time- and frequency- domain induced polarization. Geophysical Prospecting 55, 589–605. doi:10.1111/j.1365-2478.2007.00627.x. Grenon, C.,
-
[10]
Journal of Applied Geophysics 98, 44–53
Time domain spectral in- duced polarization of disseminated electronic conductors: Laboratory data analysis through the Debye decomposition approach. Journal of Applied Geophysics 98, 44–53. doi:10.1016/j.jappgeo.2013.07.008. Gurin, G., Tarasov, A., Il’in, Y., Titov, K.,
-
[11]
Russian Geology and Geophysics 56, 1757–1771
Application of the De- bye decomposition approach to analysis of induced-polarization profiling 39 data (Julietta gold-silver deposit, Magadan Region). Russian Geology and Geophysics 56, 1757–1771. doi:10.1016/j.rgg.2015.11.008. Hase, J., Gurin, G., Titov, K., Kemna, A.,
-
[12]
Markov-chain Monte Carlo estimation of distributed Debye relaxations in spectral induced po- larization. Geophysics 77, E159–E170. doi:10.1190/geo2011-0244.1. Khajehnouri, Y., Chouteau, M., Rivard, P., Bérubé, C.L.,
-
[13]
Construction and Building Materials 210, 1–12
Measuring electrical properties of mortar and concrete samples using the spectral in- duced polarization method: laboratory set-up. Construction and Building Materials 210, 1–12. doi:10.1016/j.conbuildmat.2019.03.160. Khajehnouri, Y., Chouteau, M., Rivard, P., Bérubé, C.L., 2020a. Non- destructive non-invasive assessment of the development of alkali-silic...
-
[14]
Adam: A Method for Stochastic Optimization, in: Bengio, Y., LeCun, Y. (Eds.), 3rd International Conference on Learn- ing Representations, ICLR 2015, San Diego, CA, USA, May 7-9, 2015, Conference Track Proceedings, pp. 8024–8035. Kingma, D.P., Welling, M.,
work page 2015
-
[15]
Auto-Encoding Variational Bayes, in: Bengio, Y., LeCun, Y. (Eds.), 2nd International Conference on Learning Representations, ICLR 2014, Banff, AB, Canada, April 14-16, 2014, Con- ference Track Proceedings, pp. 1–14. Martin, T., Weller, A., Behling, L.,
work page 2014
-
[16]
Geophysical Journal Interna- tional 228, 275–290
Desaturation effects of pyrite–sand mixtures on induced polarization signals. Geophysical Journal Interna- tional 228, 275–290. doi:10.1093/gji/ggab333. 40 McInnes, L., Healy, J., Saul, N., Großberger, L.,
-
[17]
doi:10.21105/joss.00861. Morgan, F.D., Lesmes, D.P.,
-
[18]
The Journal of Chemical Physics 100, 671–681
Inversion for dielectric relaxation spectra. The Journal of Chemical Physics 100, 671–681. doi:10.1063/1.466932. Nordsiek, S., Weller, A.,
-
[19]
Anewapproachtofittinginduced-polarization spectra. Geophysics 73, F235–F245. doi:10.1190/1.2987412. Paszke, A., Gross, S., Massa, F., Lerer, A., Bradbury, J., Chanan, G., Killeen, T., Lin, Z., Gimelshein, N., Antiga, L., Desmaison, A., Kopf, A., Yang, E., DeVito, Z., Raison, M., Tejani, A., Chilamkurthy, S., Steiner, B., Fang, L., Bai, J., Chintala, S.,
-
[20]
IEEE Transactions on Signal Processing 44, 2637–2640
Second-order complex random vectors and normal distributions. IEEE Transactions on Signal Processing 44, 2637–2640. doi:10.1109/78.539051. Revil, A., Florsch, N., Camerlynck, C.,
-
[21]
Near Sur- face Geophysics 10, 503–515
Spectral Induced Polarization (SIP) signatures of clayey soils containing toluene. Near Sur- face Geophysics 10, 503–515. doi:https://doi.org/10.3997/1873-0604. 2012015. Virtue, P., Yu, S.X., Lustig, M.,
-
[22]
Better than real: Complex-valued neural nets for MRI fingerprinting, in: 2017 IEEE International Con- ference on Image Processing (ICIP), pp. 3953–3957. doi:10.1109/ICIP. 2017.8297024. iSSN: 2381-8549. Volkmann, J., Klitzsch, N.,
-
[23]
Journal of Applied Geophysics 114, 191–201
Wideband impedance spectroscopy from 1 mHz to 10 MHz by combination of four- and two-electrode methods. Journal of Applied Geophysics 114, 191–201. doi:10.1016/j.jappgeo. 2015.01.012. Weigand, M., Kemna, A.,
-
[24]
Computers & Geosciences 86, 34–45
Debye decomposition of time-lapse spectral induced polarisation data. Computers & Geosciences 86, 34–45. doi:10. 1016/j.cageo.2015.09.021. Weller, A., Nordsiek, S., Debschütz, W., 2010a. Estimating permeability of sandstone samples by nuclear magnetic resonance and spectral-induced polarization. Geophysics 75, E215–E226. doi:10.1190/1.3507304. Weller, A.,...
-
[25]
On the relationship between in- duced polarization and surface conductivity: Implications for petrophysi- cal interpretation of electrical measurements. Geophysics 78, D315–D325. doi:10.1190/geo2013-0076.1. Weller, A., Slater, L., Nordsiek, S., Ntarlagiannis, D., 2010b. On the estima- tion of specific surface per unit pore volume from induced polarization...
- [26]
discussion (0)
Sign in with ORCID, Apple, or X to comment. Anyone can read and Pith papers without signing in.