Recognition: 2 theorem links
· Lean TheoremDMR effect on drag reduction of a streamlined body measured by Magnetic Suspension and Balance System
Pith reviewed 2026-05-15 01:14 UTC · model grok-4.3
The pith
Distributed micro-roughness coatings reduce drag by up to 43.6 percent in transitional flow on a streamlined body.
A machine-rendered reading of the paper's core claim, the machinery that carries it, and where it could break.
Core claim
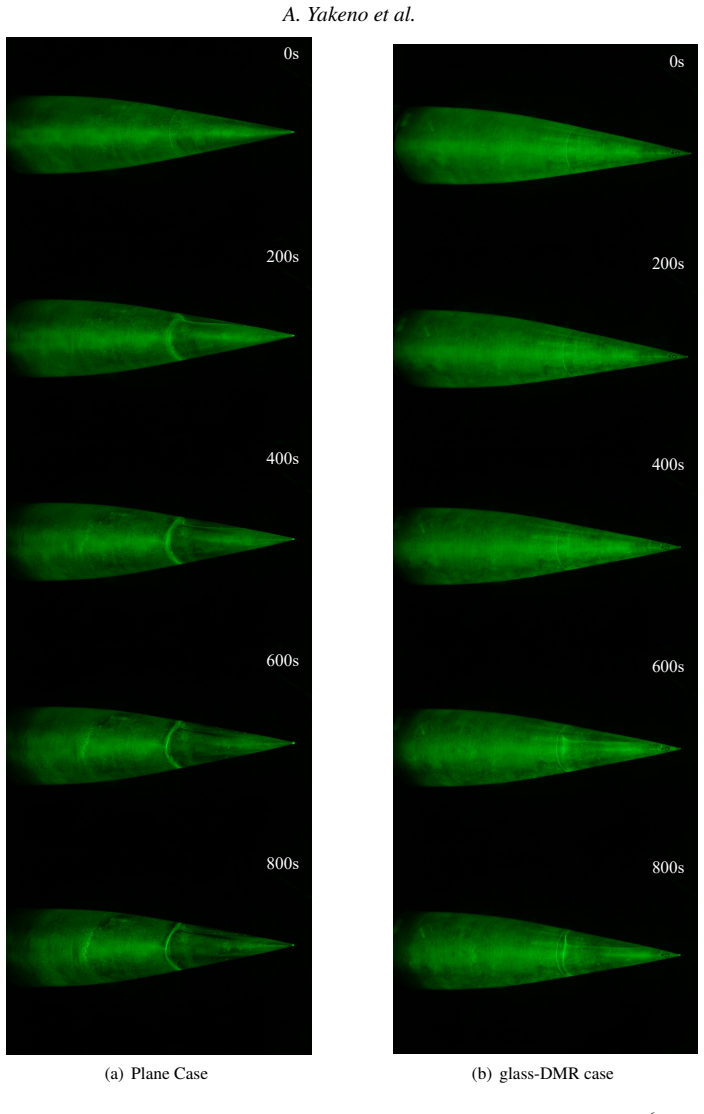
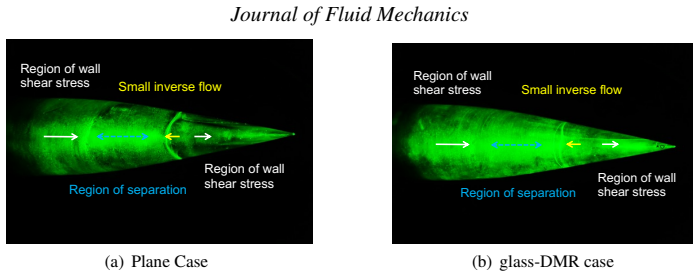
Direct aerodynamic drag measurements using the magnetic suspension and balance system revealed a substantial reduction of up to 43.6% within the transitional flow regime. The total pressure-drag budget is subordinate to skin friction according to large-eddy simulation decomposition. Oil-flow observations revealed qualitatively similar flow patterns regardless of the surface condition. Consequently, the observed drag reduction is primarily ascribed to friction drag reduction achieved through the modification of the boundary layer state.
What carries the argument
The interference-free 1-m magnetic suspension and balance system for direct drag measurement, paired with wall-resolved large-eddy simulation drag decomposition that isolates skin friction from pressure drag.
Load-bearing premise
The drag reduction originates primarily from friction drag modification of the boundary layer state rather than suppression of flow separation.
What would settle it
If direct local skin-friction measurements or higher-resolution simulations at the same conditions showed that differences in separation location or pressure drag account for most of the 43.6 percent reduction.
Figures


read the original abstract
This study experimentally investigates the aerodynamic drag reduction capabilities of distributed micro-roughness (DMR) coatings on a streamlined model, utilising the 1-m magnetic suspension and balance system (MSBS) at Tohoku University. Previous direct numerical simulations (DNS) indicated that DMR can mitigate turbulent-energy growth by suppressing Tollmien--Schlichting (TS) waves and influencing the breakdown of streamwise vortices. The present work provides the first experimental validation of these effects using an interference-free MSBS, which is essential for accurate measurement in the laminar and transitional regimes. A streamlined model was tested with two rows of artificial tripping tape to induce transition; the DMR height was approximately 1% of the local boundary layer thickness, significantly smaller than typical roughness elements. Direct aerodynamic drag measurements using the MSBS revealed a substantial reduction of up to 43.6% within the transitional flow regime. Crucially, integrated analysis using wall-resolved large-eddy simulations (LES) and dynamic oil-flow visualisation confirmed that this benefit does not mainly originate from the suppression of flow separation. The LES drag decomposition established that the total pressure-drag budget is subordinate to skin friction, a finding complemented by oil-flow observations, which revealed qualitatively similar flow patterns regardless of the surface condition. Consequently, the observed drag reduction is primarily ascribed to friction drag reduction achieved through the modification of the boundary layer state. These findings provide compelling experimental evidence for the efficacy of DMR and offer valuable insights for optimising surface designs for passive flow control.
Editorial analysis
A structured set of objections, weighed in public.
Referee Report
Summary. This paper experimentally investigates the aerodynamic drag reduction of distributed micro-roughness (DMR) coatings on a streamlined body using the 1-m Magnetic Suspension and Balance System (MSBS) at Tohoku University. It reports a maximum drag reduction of 43.6% in the transitional regime, supported by wall-resolved LES drag decomposition and dynamic oil-flow visualization, and concludes that the benefit arises primarily from skin-friction modification of the boundary-layer state rather than suppression of flow separation.
Significance. If the attribution to friction-drag modification is confirmed, the work supplies the first interference-free experimental validation of DMR effects in the transitional regime, strengthening the case for passive surface-based flow control. The MSBS approach and integration of LES decomposition with visualization are methodological strengths that could be extended to other roughness-based control strategies.
major comments (3)
- [Results section (MSBS drag measurements)] Results section (MSBS drag measurements): the 43.6% reduction is stated without error bars, full data tables, or explicit uncertainty analysis; this is load-bearing for the central experimental claim and prevents assessment of statistical significance in a regime known for high variability.
- [LES drag decomposition section] LES drag decomposition section: the attribution of reduction to skin friction (rather than pressure/separation) rests on the simulation showing pressure drag as subordinate, yet no experimental cross-validation (pressure integration, local shear, or wake surveys) is reported for the DMR case; if the LES under-resolves the transitional separation bubble or transition shift, the mechanistic conclusion fails.
- [Oil-flow visualization section] Oil-flow visualization section: patterns are described as qualitatively similar across surface conditions, but without quantitative metrics (e.g., measured separation-point locations or bubble extents), this evidence is insufficient to rule out separation suppression as a contributing mechanism.
minor comments (2)
- [Model and surface preparation] The statement that DMR height is ~1% of local boundary-layer thickness should include the exact measurement technique, streamwise station, and Reynolds-number dependence.
- [Experimental setup] Clarify the placement and height of the two rows of artificial tripping tape and their interaction with the DMR coating.
Simulated Author's Rebuttal
We thank the referee for the constructive and detailed comments. We address each major point below, indicating where revisions will be made to improve clarity and rigor.
read point-by-point responses
-
Referee: Results section (MSBS drag measurements): the 43.6% reduction is stated without error bars, full data tables, or explicit uncertainty analysis; this is load-bearing for the central experimental claim and prevents assessment of statistical significance in a regime known for high variability.
Authors: We agree that the drag reduction results require explicit uncertainty quantification. In the revised manuscript we will add error bars to all drag coefficient figures, include a table of raw and processed drag data with uncertainties derived from repeated runs and MSBS calibration, and add a dedicated subsection describing the uncertainty analysis. These additions will allow proper evaluation of statistical significance. revision: yes
-
Referee: LES drag decomposition section: the attribution of reduction to skin friction (rather than pressure/separation) rests on the simulation showing pressure drag as subordinate, yet no experimental cross-validation (pressure integration, local shear, or wake surveys) is reported for the DMR case; if the LES under-resolves the transitional separation bubble or transition shift, the mechanistic conclusion fails.
Authors: The attribution relies on wall-resolved LES showing pressure drag as a minor fraction of total drag, corroborated by oil-flow images that show qualitatively unchanged separation patterns. We will expand the discussion to address possible LES resolution sensitivities in the transitional regime. However, wake surveys, local shear, or pressure-tap data were not acquired during the original MSBS campaign, so direct experimental cross-validation cannot be added. revision: partial
-
Referee: Oil-flow visualization section: patterns are described as qualitatively similar across surface conditions, but without quantitative metrics (e.g., measured separation-point locations or bubble extents), this evidence is insufficient to rule out separation suppression as a contributing mechanism.
Authors: We will revise the oil-flow section to report quantitative metrics extracted from the images, including measured separation-point locations and estimated bubble extents for each surface condition. These additions will strengthen the argument that separation behavior is not materially altered by the DMR coating. revision: yes
- We cannot supply new experimental cross-validation data (wake surveys, local shear, or pressure distributions) for the DMR cases, as these measurements were not part of the original experimental campaign.
Circularity Check
No circularity: direct experimental force measurement stands independent of any derivation chain
full rationale
The paper's central claim rests on direct MSBS total-force measurements of drag reduction (up to 43.6%), which are raw experimental data rather than outputs of any model, fit, or equation. The attribution to friction-drag modification (versus separation) is supported by separate LES decomposition and oil-flow visualization; these are presented as complementary evidence and do not reduce the measured total drag to a fitted parameter or self-citation by construction. No self-definitional steps, fitted-input predictions, or load-bearing self-citation chains appear in the derivation. The result is therefore self-contained against external benchmarks.
Axiom & Free-Parameter Ledger
free parameters (1)
- DMR height relative to local boundary layer thickness =
approximately 1%
axioms (1)
- domain assumption The 1-m magnetic suspension and balance system at Tohoku University provides interference-free aerodynamic force measurements essential for laminar and transitional regimes.
Lean theorems connected to this paper
-
IndisputableMonolith/Cost/FunctionalEquation.leanwashburn_uniqueness_aczel unclear?
unclearRelation between the paper passage and the cited Recognition theorem.
LES drag decomposition established that the total pressure-drag budget is subordinate to skin friction... observed drag reduction is primarily ascribed to friction drag reduction achieved through the modification of the boundary layer state.
-
IndisputableMonolith/Foundation/RealityFromDistinction.leanreality_from_one_distinction unclear?
unclearRelation between the paper passage and the cited Recognition theorem.
maximum aerodynamic drag reduction of 43.6%... at approximately Re=2.25×10^6 in the transition region
What do these tags mean?
- matches
- The paper's claim is directly supported by a theorem in the formal canon.
- supports
- The theorem supports part of the paper's argument, but the paper may add assumptions or extra steps.
- extends
- The paper goes beyond the formal theorem; the theorem is a base layer rather than the whole result.
- uses
- The paper appears to rely on the theorem as machinery.
- contradicts
- The paper's claim conflicts with a theorem or certificate in the canon.
- unclear
- Pith found a possible connection, but the passage is too broad, indirect, or ambiguous to say the theorem truly supports the claim.
Reference graph
Works this paper leans on
-
[1]
Airbus2017 Airbus’ “BLADE” laminar flow wing demonstrator makes first flight.https: //www.airbus.com/en/newsroom/press-releases/2017-09-airbus-blade-laminar-flow\ -wing-demonstrator-makes-first-flight, accessed on June 26,
work page 2017
-
[2]
Asai, M., Shinohara, R. & Nishizawa, H.2019 Riblet Transfer Sheet, Riblet Transfer Sheet Manufacturing Method, Riblet Molding Method, and Transfer Sheet. Japanese Patent, patent no. JP6511612B2, Issued in Japan. Assignee: National Research and Development Agency Japan Aerospace Exploration Agency, O-Well Corp, Tokyo Metropolitan Univ. Bhaganagar, K., Kim,...
work page 2019
-
[3]
0X0-35 A. Yakeno et al. Kohama, Y ., Kobayashi, R. & Ito, H.1982 Performance of small-scale low-turbulence wind tunnel.The Memoirs of the Institute of High Speed Mechanics (Tohoku University)48, 119–142, (In Japanese). Kohama, Y ., Kobayashi, R. & Ito, H.1992 Tohoku University Low-Turbulence Wind Tunnel. In28th Joint Propulsion Conference and Exhibit of AIAA, p
work page 1982
-
[4]
Kohama, Y . & Motegi, D.1994 Traveling disturbance appearing in boundary layer transition in a yawed cylinder.Experimental Thermal and Fluid Science8(4), 273–278. Lawing, P . L., Dress, D. A. & Kilgore, R. A.1987 Potential benefits of magnetic suspension and balance systems. NASA Technical Memorandum NASA TM-89079. NASA Langley Research Center. Li, J., W ...
work page 1994
-
[5]
Lim, J., Kim, M., Bae, H., Lin, R. S. & Jee, S.2023 Turbulent transition control using porous surfaces in hypersonic boundary layer.International Journal of Aeronautical and Space Sciences24(4), 972–984. Lim, J., Kim, M., Park, J., Kim, T., Jee, S. & Park, D.2022 Simulation of hypersonic boundary layer on porous surfaces using OpenFOAM.Computers & Fluids2...
work page 2023
-
[6]
M.1984 Boundary-layer linear stability theory.Tech
Mack, L. M.1984 Boundary-layer linear stability theory.Tech. Rep.. Jet Propulsion Laboratory, California Institute of Technology, Pasadena, CA. Malmuth, N., Fedorov , A., Shalaev , V ., Cole, J., Hites, M., Williams, D. & Khokhlov , A.1998 Problems in high speed flow prediction relevant to control. In2nd AIAA, Theoretical Fluid Mechanics Meeting, p
work page 1984
-
[7]
Mori, Y ., Yakeno, A. & Obayashi, S.2024aDNS of boundary-layer transition over a transonic swept wing under real flight condition. InAIAA AVIATION FORUM AND ASCEND 2024, p
work page 2024
-
[8]
Mori, Y ., Yakeno, A. & Obayashi, S.2024bEffects of surface roughness and free-stream turbulence on transitions in the swept-wing boundary layer. InAIAA SciTech Forum 2024, p
work page 2024
-
[9]
Mori, Y ., Yakeno, A., Ogawa, T. & Obayashi, S.2024cNumerical simulation of transition over a transonic swept wing with distributed roughness. InIUTAM Symposium on Laminar-Turbulent Transition. Nagano, Japan. Morkovin, Mark V1969 On the many faces of transition. InViscous Drag Reduction: Proceedings of the Symposium on Viscous Drag Reduction held at the L...
work page 1968
-
[10]
Pankhurst, R. C. & Holder, D. W .1952Wind-tunnel technique. Pitman Publishing. 0X0-36 Journal of Fluid Mechanics Perry , A. E., Schofield, W . H. & Joubert, P . N.1969 Roughness-induced skin friction in turbulent boundary layers.Journal of Fluid Mechanics37(2), 383–401. Rasheed, A., Hornung, H. G., Fedorov , A. V . & Malmuth, N. D.2002 Experiments on pass...
work page 1969
-
[11]
S.1994 Low-speed boundary-layer transition.Annual Review of Fluid Mechanics26(1), 379–409
Saric, W . S.1994 Low-speed boundary-layer transition.Annual Review of Fluid Mechanics26(1), 379–409. Saric, W . S., Hoos, J. A. & Radeztsky , R. H.1991 Boundary-layer receptivity of sound with roughness. In Boundary Layer Stability and Transition to Turbulence; Proceedings of the Symposium, ASME and JSME Joint Fluids Engineering Conference, 1st, pp. 17–2...
work page 1994
-
[12]
Tani, I.1935 Effect of wing deflection surface on wing performance (In Japanese).Mechanical Engineering Journalpp. 743–744. Tani, I.1989 Re-evaluation of Nikuradse’s experimental data for rough pipes.Proceedings of the Japan Academy, Series B65(6), 133–136. Tani, I., Hama, R. & Mitsuisi, S.1940 On the permissible roughness in the laminar boundary layer (I...
work page 1935
discussion (0)
Sign in with ORCID, Apple, or X to comment. Anyone can read and Pith papers without signing in.