Recognition: 2 theorem links
· Lean TheoremAligning Validation with Deployment: Target-Weighted Cross-Validation for Spatial Prediction
Pith reviewed 2026-05-13 23:37 UTC · model grok-4.3
The pith
Target-weighted cross-validation reduces bias in spatial prediction performance estimates by aligning validation tasks with the full deployment domain.
A machine-rendered reading of the paper's core claim, the machinery that carries it, and where it could break.
Core claim
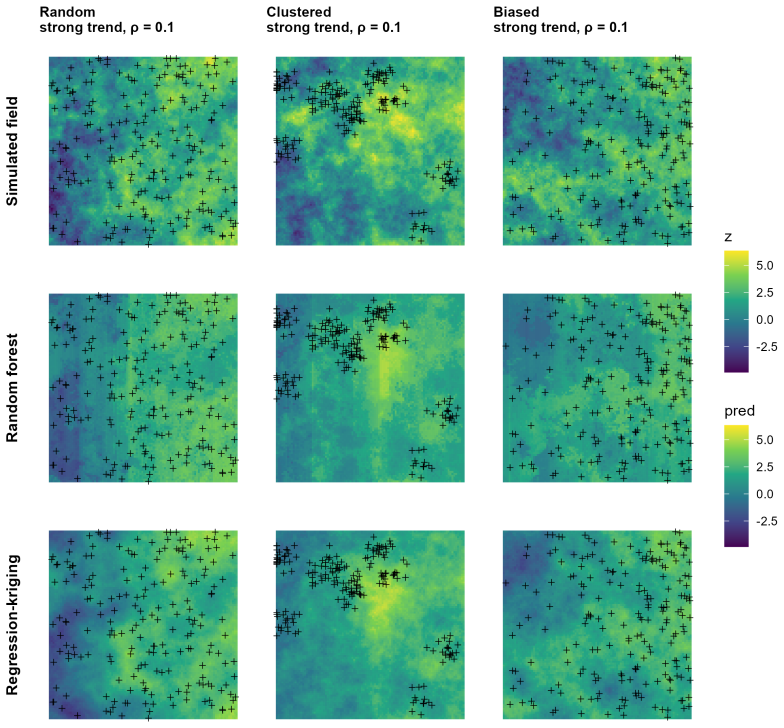
The authors introduce a deployment-oriented validation framework based on weighted cross-validation. Importance-weighted CV (IWCV) and Target-Weighted Cross-Validation (TWCV) reweight validation tasks using spatially meaningful descriptors such as environmental covariates and prediction distance so that the validation distribution matches the distribution of prediction tasks across the target domain. The framework separates validation-task generation from risk estimation. Simulation experiments show that non-spatial and spatial CV exhibit substantial bias under clustered or preferential sampling, whereas weighted CV substantially reduces this bias when validation tasks cover the deployment-t
What carries the argument
Target-Weighted Cross-Validation (TWCV), a calibration-based weighting scheme that adjusts each validation task's contribution according to its similarity to the distribution of prediction tasks defined by environmental covariates and prediction distance.
If this is right
- Standard non-spatial and spatial CV strategies produce substantially biased performance estimates when sampling is preferential or clustered.
- Weighted CV approaches substantially reduce bias provided validation tasks adequately cover the deployment-task space.
- In the NO2 mapping case study across Germany, standard CV overestimates prediction error due to sampling bias while weighted CV yields estimates aligned with deployment conditions.
- The framework separates validation task generation from risk estimation, allowing flexible definition of the target domain.
Where Pith is reading between the lines
- If suitable descriptors exist, the same weighting logic could be applied to temporal or non-spatial shift problems where validation and deployment distributions differ.
- TWCV estimates could be used to guide model selection or to adjust uncertainty bands on the final maps rather than only for reporting accuracy.
- A practical next test would be to withhold a true deployment region, compute both standard and weighted CV on the rest, and check which one better matches the actual error in the withheld region.
- The method's performance will degrade if important unmeasured factors affect prediction difficulty but are absent from the chosen descriptors.
Load-bearing premise
Spatially meaningful task descriptors such as environmental covariates and prediction distance are sufficient to represent and cover the full deployment-task space for weighting purposes.
What would settle it
Measure the true out-of-sample prediction error on an independent deployment set whose task distribution is fully known; if the TWCV estimate differs substantially from that true error even when descriptors cover the space, the alignment claim fails.
Figures


read the original abstract
Reliable estimation of predictive performance is essential for spatial environmental modeling, where machine-learning models are used to generate maps from unevenly distributed observations. Standard cross-validation (CV) assumes that validation data are representative of prediction conditions across the target domain. In practice, this assumption is often violated due to preferential or clustered sampling, leading to biased performance and uncertainty estimates. We introduce a deployment-oriented validation framework based on weighted CV that aligns validation tasks with the distribution of prediction tasks across a specified domain. The framework includes importance-weighted cross-validation (IWCV) and a calibration-based approach, Target-Weighted Cross-Validation (TWCV), which uses spatially meaningful task descriptors such as environmental covariates and prediction distance. Simulation experiments show that conventional non-spatial and spatial CV strategies can exhibit substantial bias under realistic sampling designs, whereas weighted CV approaches substantially reduce this bias when validation tasks adequately cover the deployment-task space. A case study on mapping nitrogen dioxide (NO$_2$) concentrations across Germany demonstrates that standard CV can overestimate prediction error due to sampling bias, while weighted CV yields estimates more consistent with deployment conditions. The framework separates validation task generation from risk estimation and provides a practical approach for improving performance assessment in spatial prediction settings where sample distributions differ from prediction domains.
Editorial analysis
A structured set of objections, weighed in public.
Referee Report
Summary. The paper introduces a deployment-oriented validation framework for spatial environmental modeling using importance-weighted cross-validation (IWCV) and Target-Weighted Cross-Validation (TWCV). These methods align validation tasks with the distribution of prediction tasks across a domain by leveraging task descriptors such as environmental covariates and prediction distance. Standard CV is shown to produce biased performance estimates under preferential or clustered sampling, while the weighted approaches reduce this bias in simulations when validation tasks adequately cover the deployment space and yield more consistent estimates in a NO2 mapping case study across Germany.
Significance. If the central results hold, the framework offers a practical advance for reliable performance assessment in spatial ML applications, particularly where sampling distributions diverge from target domains. By separating validation task generation from risk estimation and grounding claims in both simulations and a real-world environmental case study, it addresses a common source of over-optimism in predictive mapping and could improve uncertainty quantification in fields like air-quality modeling.
major comments (2)
- [Abstract] Abstract and simulation section: The headline result that weighted CV substantially reduces bias is explicitly conditional on 'validation tasks adequately cover the deployment-task space,' yet no diagnostic (e.g., effective sample size after weighting, coverage metric, or sensitivity to omitted covariates) is supplied to test whether a given set of descriptors actually spans the relevant dimensions of the deployment distribution.
- [Case Study] Case study section: The NO2 mapping application asserts that weighted CV estimates are 'more consistent with deployment conditions,' but provides no quantitative verification such as a check on the weighting matrix calibration, comparison of effective sample sizes, or analysis of sensitivity to unmodeled spatial factors that could violate the coverage assumption.
minor comments (1)
- [Methods] The distinction between IWCV and TWCV is introduced in the abstract but would benefit from an explicit algorithmic comparison or pseudocode early in the methods to clarify how the calibration step in TWCV differs from standard importance weighting.
Simulated Author's Rebuttal
We thank the referee for these constructive comments highlighting the need for explicit diagnostics to support the coverage assumption underlying our weighted CV methods. We agree that adding such checks will improve the manuscript and will revise accordingly.
read point-by-point responses
-
Referee: [Abstract] Abstract and simulation section: The headline result that weighted CV substantially reduces bias is explicitly conditional on 'validation tasks adequately cover the deployment-task space,' yet no diagnostic (e.g., effective sample size after weighting, coverage metric, or sensitivity to omitted covariates) is supplied to test whether a given set of descriptors actually spans the relevant dimensions of the deployment distribution.
Authors: We agree that the paper would benefit from practical diagnostics for the coverage assumption. In revision we will add a dedicated subsection to the simulation experiments that reports (i) effective sample size after reweighting, (ii) a quantitative coverage metric based on the overlap of validation and deployment task descriptors, and (iii) sensitivity results when key covariates are deliberately omitted from the descriptor set. These additions will give readers concrete tools to verify the assumption on their own data. revision: yes
-
Referee: [Case Study] Case study section: The NO2 mapping application asserts that weighted CV estimates are 'more consistent with deployment conditions,' but provides no quantitative verification such as a check on the weighting matrix calibration, comparison of effective sample sizes, or analysis of sensitivity to unmodeled spatial factors that could violate the coverage assumption.
Authors: We accept that the current case-study presentation lacks the requested quantitative verification. We will expand the NO2 section to include: calibration diagnostics for the weighting matrix, direct comparison of effective sample sizes between standard and weighted CV, and a sensitivity experiment that introduces plausible unmodeled spatial factors (e.g., additional topographic or traffic covariates) to test robustness of the performance estimates. These results will be reported alongside the existing maps and error metrics. revision: yes
Circularity Check
No significant circularity detected
full rationale
The paper introduces IWCV and TWCV as new weighted validation procedures grounded in task descriptors (covariates and prediction distance) and demonstrates bias reduction via separate simulation experiments and an NO2 case study. No load-bearing step reduces by construction to a fitted parameter, self-citation chain, or input definition; the central conditional claim is supported by external evidence rather than tautological equivalence.
Axiom & Free-Parameter Ledger
axioms (1)
- domain assumption Validation tasks can be generated or weighted using environmental covariates and prediction distance to match the deployment-task distribution.
Lean theorems connected to this paper
-
IndisputableMonolith/Foundation/Cost/FunctionalEquation.leanwashburn_uniqueness_aczel unclear?
unclearRelation between the paper passage and the cited Recognition theorem.
TWCV assigns weights w_i to validation tasks such that the weighted distribution of task descriptors matches these target margins... calibration equations nval Σ w_i g(T_i) = m
-
IndisputableMonolith/Foundation/RealityFromDistinction.leanreality_from_one_distinction unclear?
unclearRelation between the paper passage and the cited Recognition theorem.
We propose Target-Weighted Cross-Validation (TWCV)... accounts for both covariate shift and task-difficulty shift
What do these tags mean?
- matches
- The paper's claim is directly supported by a theorem in the formal canon.
- supports
- The theorem supports part of the paper's argument, but the paper may add assumptions or extra steps.
- extends
- The paper goes beyond the formal theorem; the theorem is a base layer rather than the whole result.
- uses
- The paper appears to rely on the theorem as machinery.
- contradicts
- The paper's claim conflicts with a theorem or certificate in the canon.
- unclear
- Pith found a possible connection, but the passage is too broad, indirect, or ambiguous to say the theorem truly supports the claim.
Forward citations
Cited by 1 Pith paper
-
Moving beyond spatial and random cross-validation in environmental modelling: a call for prediction-domain adaptive evaluation
Prediction-domain adaptive cross-validation is proposed as a flexible alternative to fixed random or spatial methods for reliably estimating accuracy in environmental maps.
Reference graph
Works this paper leans on
-
[1]
J. Pohjankukka, T. Pahikkala, P. Nevalainen, and J. Heikkonen. Estimating the prediction performance of spatial models via spatial k-fold cross validation.International Journal of Geographical Information Science, 31(10):2001–2019, 2017
work page 2001
-
[2]
D. R. Roberts, V. Bahn, S. Ciuti, M. S. Boyce, J. Elith, G. Guillera-Arroita, S. Hauenstein, J. J. Lahoz-Monfort, B. Schr¨ oder, W. Thuiller, D. I. Warton, B. A. Wintle, F. Hartig, and C. F. Dormann. Cross-validation strategies for data with temporal, spatial, hierarchical, or phylogenetic structure.Ecography, 40(8):913–929, 2017
work page 2017
-
[3]
P. Schratz, J. Muenchow, E. Iturritxa, J. Richter, and A. Brenning. Hyperparameter tuning and performance assessment of statistical and machine-learning algorithms using spatial data.Ecological Modelling, 406:109–120, 2019
work page 2019
-
[4]
P. Ploton, F. Mortier, M. R´ ejou-M´ echain, N. Barbier, N. Picard, V. Rossi, C. Dormann, G. Cornu, G. Viennois, N. Bayol, A. Lyapustin, S. Gourlet-Fleury, and R. P´ elissier. Spatial validation reveals poor predictive performance of large-scale ecological mapping models. Nature Communications, 11:4540, 2020
work page 2020
- [5]
-
[6]
J. Qui˜ nonero-Candela, M. Sugiyama, A. Schwaighofer, and N. Lawrence.Dataset Shift in Machine Learning. MIT Press, Cambridge, MA, 2009
work page 2009
-
[7]
M. Sugiyama, M. Krauledat, and K.-R. M¨ uller. Covariate shift adaptation by importance weighted cross validation.Journal of Machine Learning Research, 8:985–1005, 2007
work page 2007
- [8]
-
[9]
S. de Bruin, D. J. Brus, G. B. M. Heuvelink, T. van Ebbenhorst Tengbergen, and A. M. J.- C. Wadoux. Dealing with clustered samples for assessing map accuracy by cross-validation. Ecological Informatics, 69:101665, 2022
work page 2022
- [10]
-
[11]
N. Karasiak, J.-F. Dejoux, C. Monteil, and D. Sheeren. Spatial dependence between train- ing and test sets: another pitfall of classification accuracy assessment in remote sensing. Machine Learning, 111:2715–2740, 2021
work page 2021
- [12]
- [13]
-
[14]
P. Schratz, M. Becker, M. Lang, and A. Brenning. mlr3spatiotempcv: Spatiotemporal resampling methods for machine learning in R.Journal of Statistical Software, 111(7):1– 36, 2024. 27
work page 2024
-
[15]
J. Linnenbrink, C. Mil` a, M. Ludwig, and H. Meyer. kNNDM CV:k-fold nearest-neighbour distance matching cross-validation for map accuracy estimation.Geoscientific Model De- velopment, 17(15):5897–5912, 2024
work page 2024
-
[16]
H. Meyer and E. Pebesma. Predicting into unknown space? Estimating the area of ap- plicability of spatial prediction models.Methods in Ecology and Evolution, 12:1620–1633, 2021
work page 2021
-
[17]
J.-C. Deville and C.-E. S¨ arndal. Calibration estimators in survey sampling.Journal of the American Statistical Association, 87(418):376–382, 1992
work page 1992
-
[18]
T. Lumley. Analysis of complex survey samples.Journal of Statistical Software, 9(1):1–19, 2004
work page 2004
-
[19]
R. Webster and M. A. Oliver.Geostatistics for Environmental Scientists. John Wiley & Sons, Inc., Chichester, 2007
work page 2007
-
[20]
J. K. Frank, T. Suesse, and A. Brenning. An assessment of spatial random forests for environmental mapping: the case of groundwater nitrate concentration.Environmental Modelling & Software, 193:106626, 2025
work page 2025
-
[21]
A. M. J.-C. Wadoux, G. B. M. Heuvelink, S. de Bruin, and D. J. Brus. Spatial cross- validation is not the right way to evaluate map accuracy.Ecological Modelling, 457:109692, 2021
work page 2021
-
[22]
G. Shaddick and J. V. Zidek. A case study in preferential sampling: Long term monitoring of air pollution in the UK.Spatial Statistics, 9:51–65, 2014
work page 2014
-
[23]
H. Shimodaira. Improving predictive inference under covariate shift by weighting the log- likelihood function.Journal of Statistical Planning and Inference, 90(2):227–244, 2000
work page 2000
-
[24]
M. Sugiyama, T. Suzuki, and T. Kanamori.Density Ratio Estimation in Machine Learning. Cambridge University Press, Cambridge, 2012
work page 2012
-
[25]
L. Breiman. Random forests.Machine Learning, pages 5–32, 2001
work page 2001
-
[26]
M. N. Wright and A. Ziegler. ranger: A fast implementation of random forests for high dimensional data in C++ and R.Journal of Statistical Software, 77:1–17, 2017
work page 2017
-
[27]
E.J. Pebesma. Multivariable geostatistics in S: the gstat package.Computers & Geo- sciences, 30:683–691, 2004
work page 2004
-
[28]
S. L. Lohr.Sampling: Design and Analysis. Chapman and Hall/CRC, Boca Raton, 3rd edition, 2022
work page 2022
-
[29]
Monitoring station metadata, 2018
Umweltbundesamt. Monitoring station metadata, 2018. Downloaded from https://www.env-it.de/stationen/public/downloadRequest.do on 2018-12-10
work page 2018
-
[30]
Stickstoffdioxid (no 2) im jahr 2018.https://www.umweltbundesamt
Umweltbundesamt. Stickstoffdioxid (no 2) im jahr 2018.https://www.umweltbundesamt. de/themen/luft/luftschadstoffe/stickstoffoxide, 2020. Air quality monitoring data from German federal and state networks; accessed 2020-08-31
work page 2018
-
[31]
P. Vizcaino and C. Lavalle. Development of European NO 2 land use regression model for present and future exposure assessment: Implications for policy analysis.Environmental Pollution, 240:140–154, 2018. 28
work page 2018
-
[32]
G. Hoek, R. Beelen, K. de Hoogh, D. Vienneau, J. Gulliver, P. Fischer, and D. Briggs. A review of land-use regression models to assess spatial variation of outdoor air pollution. Atmospheric Environment, 42(33):7561–7578, 2008
work page 2008
-
[33]
S. Kessinger and A. C. Mues. Air quality to go: UBA’s “Air Quality” app.UMID: Environmental and Human Health Information Service, (1):59–64, 2020. Original title: Luftqualit¨ at f¨ ur unterwegs: Die UBA-App “Luftqualit¨ at”
work page 2020
-
[34]
World Health Organization. WHO global air quality guidelines: particulate matter (PM2.5 and PM10), ozone, nitrogen dioxide, sulfur dioxide and carbon monoxide.https://www. who.int/publications/i/item/9789240034228, 2021
-
[35]
Earth Resources Observation and Science (EROS) Center, U.S. Geological Survey. Global topographic 30 arc-second digital elevation model: Released 1996, 2023. USGS data release
work page 1996
-
[36]
Gridded population of the world, version 4 (gpwv4): Population density, revision 10, 2017
Center for International Earth Science Information Network (CIESIN), Columbia Univer- sity. Gridded population of the world, version 4 (gpwv4): Population density, revision 10, 2017
work page 2017
-
[37]
Corine land cover 2018 (vector/raster 100 m), europe, 6-yearly, 2020
European Environment Agency. Corine land cover 2018 (vector/raster 100 m), europe, 6-yearly, 2020. Version V2020 20u1; reference year 2018
work page 2018
- [38]
-
[39]
Y. Wang, M. Khodadadzadeh, and R. Zurita-Milla. A dissimilarity-adaptive cross- validation method for evaluating geospatial machine learning predictions with clustered samples.Ecological Informatics, 90:103287, 2025
work page 2025
-
[40]
J. Huang, A. Gretton, K. Borgwardt, B. Sch¨ olkopf, and A. Smola. Correcting sample selec- tion bias by unlabeled data. In B. Sch¨ olkopf, J. Platt, and T. Hoffman, editors,Advances in Neural Information Processing Systems 19: Proceedings of the 2006 Conference, pages 601–608, 2007
work page 2006
- [41]
-
[42]
F. L. Schumacher, C. Knoth, M. Ludwig, and H. Meyer. Estimation of local training data point densities to support the assessment of spatial prediction uncertainty.Geoscientific Model Development, 18(24):10185–10202, 2025
work page 2025
-
[43]
R. J. Hyndman and G. Athanasopoulos.Forecasting: Principles and Practice. OTexts, Melbourne, 3 edition, 2021
work page 2021
-
[44]
S. B. Taieb, G. Bontempi, A. F. Atiya, and A. Sorjamaa. A review and comparison of strategies for multi-step ahead time series forecasting based on the NN5 forecasting competition.Expert Systems with Applications, 39(8):7067–7083, 2012
work page 2012
-
[45]
D. Chen, Y. Lin, L. Li, X. Ren, P. Li, J. Zhou, and X. Sun. Rethinking the promotion brought by contrastive learning to semi-supervised node classification, 2022
work page 2022
-
[46]
J. Wang, C. Lan, C. Liu, Y. Ouyang, T. Qin, W. Lu, Y. Chen, W. Zeng, and P. S. Yu. Generalizing to unseen domains: A survey on domain generalization.IEEE Transactions on Knowledge & Data Engineering, 35(08):8052–8072, 2023
work page 2023
-
[47]
Cressie.Statistics for Spatial Data
N. Cressie.Statistics for Spatial Data. Wiley, New York, revised edition, 1993. 29
work page 1993
discussion (0)
Sign in with ORCID, Apple, or X to comment. Anyone can read and Pith papers without signing in.