Recognition: 2 theorem links
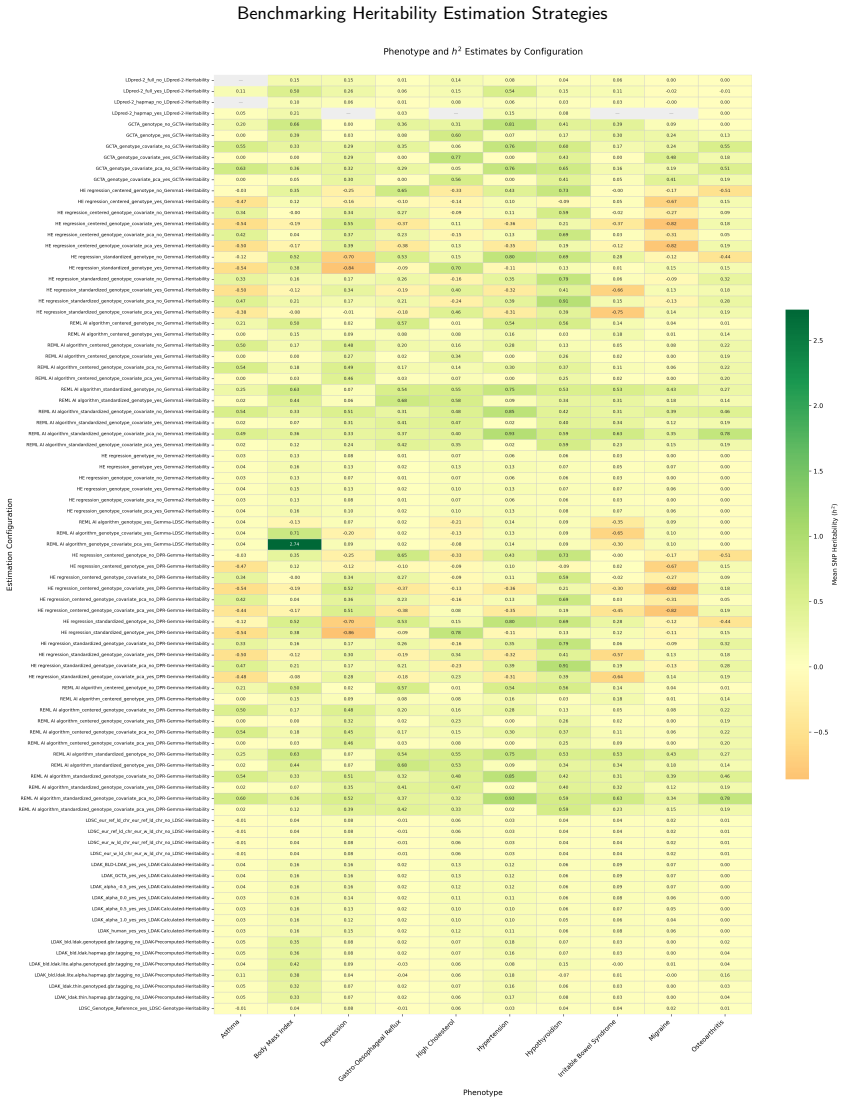
· Lean TheoremBenchmarking Heritability Estimation Strategies Across 86 Configurations and Their Downstream Effect on Polygenic Risk Score Performance
Pith reviewed 2026-05-13 21:03 UTC · model grok-4.3
The pith
SNP heritability estimates vary widely across methods but couple only weakly to polygenic risk score accuracy.
A machine-rendered reading of the paper's core claim, the machinery that carries it, and where it could break.
Core claim
SNP heritability is best interpreted as a configuration-sensitive modelling parameter rather than a universally stable scalar input. Across 844 estimates from 86 configurations, heritability ranged from -0.862 to 2.735, with 15.8 percent negative and concentrated in unconstrained regimes. Ten of eleven analytical contrasts significantly affected magnitude, yet pooled correlations between h² and PRS test AUC were near zero and non-significant for both GCTA-SBLUP and LDpred2-lassosum2.
What carries the argument
The benchmarking pipeline that applies 86 heritability configurations spanning six tool families to ten phenotypes and propagates each resulting estimate into GCTA-SBLUP and LDpred2-lassosum2 PRS frameworks for cross-validated evaluation.
If this is right
- Heritability estimates should always be reported with their complete estimation specification.
- Downstream PRS performance is comparatively robust to moderate variation in the heritability input.
- Algorithm choice and GRM standardisation produce the largest shifts in heritability magnitude.
- Negative heritability estimates occur frequently in unconstrained estimation regimes.
- PRS test performance remains stable even when upstream h² inputs differ substantially.
Where Pith is reading between the lines
- PRS pipelines may be more tolerant of noisy heritability inputs than previously assumed, shifting attention toward other tuning parameters.
- The observed decoupling could be tested by measuring how much PRS accuracy changes when heritability is deliberately set to extreme values outside the estimated range.
- If the pattern holds in independent datasets, routine reporting of heritability without method details may be less informative for clinical translation.
- Future work could check whether the same weak coupling appears when heritability estimates are used for genetic correlation or variance-component analyses rather than PRS.
Load-bearing premise
That the weak coupling between heritability magnitude and PRS AUC observed for GCTA-SBLUP and LDpred2-lassosum2 on these ten UK Biobank phenotypes generalizes to other PRS methods, phenotypes, and populations.
What would settle it
Repeating the full 86-configuration benchmark on a third PRS method or on non-European ancestry cohorts and observing a statistically significant Pearson correlation above 0.3 between h² and AUC.
Figures


read the original abstract
Objective: SNP heritability estimates vary substantially across estimation strategies, yet the downstream consequences for polygenic risk score (PRS) construction remain poorly characterised. We systematically benchmarked heritability estimation configurations and assessed their propagation into downstream PRS performance. Methods: We benchmarked 86 heritability-estimation configurations spanning six tool families (GEMMA, GCTA, LDAK, DPR, LDSC, and SumHer) and ten method groups across 10 UK Biobank phenotypes, yielding 844 configuration-level estimates. Each estimate was propagated into GCTA-SBLUP and LDpred2-lassosum2 PRS frameworks and evaluated across five cross-validation folds using null, PRS-only, and full models. Eleven binary analytical contrasts were tested using Mann-Whitney U tests to identify drivers of heritability variability. Results: Heritability ranged from -0.862 to 2.735 (mean = 0.134, SD = 0.284), with 133 of 844 estimates (15.8%) being negative and concentrated in unconstrained estimation regimes. Ten of eleven analytical contrasts significantly affected heritability magnitude, with algorithm choice and GRM standardisation showing the largest effects. Despite this upstream variability, downstream PRS test performance was only weakly coupled to heritability magnitude: pooled Pearson correlations between h^2 and test AUC were r = -0.023 for GCTA-SBLUP and r = +0.014 for LDpred2-lassosum2, with both being non-significant. Conclusion: SNP heritability is best interpreted as a configuration-sensitive modelling parameter rather than a universally stable scalar input. Heritability estimates should always be reported alongside their full estimation specification, and downstream PRS performance is comparatively robust to moderate variation in the heritability input.
Editorial analysis
A structured set of objections, weighed in public.
Referee Report
Summary. The paper benchmarks 86 heritability-estimation configurations spanning six tool families (GEMMA, GCTA, LDAK, DPR, LDSC, SumHer) across 10 UK Biobank phenotypes, yielding 844 estimates. Each estimate is propagated into GCTA-SBLUP and LDpred2-lassosum2 PRS frameworks and evaluated via five-fold cross-validation on null, PRS-only, and full models. Eleven analytical contrasts are tested with Mann-Whitney U tests. Results show heritability ranging from -0.862 to 2.735 (15.8% negative), with algorithm choice and GRM standardisation as major drivers, yet pooled Pearson correlations between h² and test AUC are near-zero and non-significant (r = -0.023 for GCTA-SBLUP; r = +0.014 for LDpred2-lassosum2). The conclusion states that SNP heritability is configuration-sensitive but downstream PRS performance is comparatively robust.
Significance. If the results hold, the work supplies a large-scale empirical map of how estimation choices affect SNP heritability and demonstrates that, at least for the two tested PRS engines, this upstream variability does not materially degrade AUC. The scale (844 estimates, 11 contrasts with explicit statistical tests) and the concrete reporting of negative estimates and non-significant correlations are strengths that could inform reporting standards in genetic epidemiology.
major comments (1)
- [Abstract/Results] Abstract and Results: The claim that 'downstream PRS performance is comparatively robust' rests exclusively on GCTA-SBLUP and LDpred2-lassosum2. Methods that treat h² as an explicit variance-component multiplier or shrinkage prior scale (e.g., PRS-CS, SBayesR, or LDpred2-auto variants) are not evaluated, so the near-zero correlations cannot be taken as general evidence of robustness across PRS frameworks.
minor comments (2)
- [Abstract] Abstract: The reported mean (0.134) and SD (0.284) of heritability estimates would be more informative if accompanied by the median and interquartile range, given the 15.8% negative values and wide range.
- [Methods/Results] Methods/Results: Full details on phenotype-specific data exclusions, exact cross-validation fold construction, and whether error bars accompany the AUC values are not visible in the provided summary; adding these would strengthen reproducibility.
Simulated Author's Rebuttal
We thank the referee for this constructive comment on the scope of our PRS evaluations. We agree that the robustness claim requires qualification and will revise the manuscript accordingly.
read point-by-point responses
-
Referee: [Abstract/Results] Abstract and Results: The claim that 'downstream PRS performance is comparatively robust' rests exclusively on GCTA-SBLUP and LDpred2-lassosum2. Methods that treat h² as an explicit variance-component multiplier or shrinkage prior scale (e.g., PRS-CS, SBayesR, or LDpred2-auto variants) are not evaluated, so the near-zero correlations cannot be taken as general evidence of robustness across PRS frameworks.
Authors: We agree that the observed near-zero correlations between heritability estimates and PRS AUC are specific to the two PRS frameworks evaluated (GCTA-SBLUP and LDpred2-lassosum2). In the revised manuscript we will modify the abstract, results, and conclusion to explicitly state that downstream performance was comparatively robust within these two methods. We will also add a sentence in the discussion noting that PRS approaches which treat heritability as an explicit variance-component multiplier or shrinkage prior (e.g., PRS-CS, SBayesR, LDpred2-auto) were not tested and may exhibit greater sensitivity to upstream h² variability. revision: yes
Circularity Check
No circularity: purely empirical benchmarking with direct computation on external data
full rationale
The paper reports direct statistical computations of 844 heritability estimates from UK Biobank phenotypes using standard tools, followed by propagation into two PRS frameworks and Pearson correlations with AUC. No equations, ansatzes, fitted parameters, or self-citations reduce any claim to its own inputs by construction. The central result (near-zero correlations) is a measured outcome on held-out folds, not a definitional identity or forced prediction. The study is self-contained against external benchmarks with no load-bearing self-citation chains or uniqueness theorems.
Axiom & Free-Parameter Ledger
axioms (1)
- domain assumption The 10 selected UK Biobank phenotypes are representative of typical heritability estimation behavior across human traits.
Lean theorems connected to this paper
-
IndisputableMonolith/Cost/FunctionalEquation.leanwashburn_uniqueness_aczel unclear?
unclearRelation between the paper passage and the cited Recognition theorem.
Pooled Pearson correlations between h² and test AUC were r = -0.023 for GCTA-SBLUP and r = +0.014 for LDpred2-lassosum2
-
IndisputableMonolith/Foundation/RealityFromDistinction.leanreality_from_one_distinction unclear?
unclearRelation between the paper passage and the cited Recognition theorem.
Heritability ranged from -0.862 to 2.735 (mean = 0.134, SD = 0.284)
What do these tags mean?
- matches
- The paper's claim is directly supported by a theorem in the formal canon.
- supports
- The theorem supports part of the paper's argument, but the paper may add assumptions or extra steps.
- extends
- The paper goes beyond the formal theorem; the theorem is a base layer rather than the whole result.
- uses
- The paper appears to rely on the theorem as machinery.
- contradicts
- The paper's claim conflicts with a theorem or certificate in the canon.
- unclear
- Pith found a possible connection, but the passage is too broad, indirect, or ambiguous to say the theorem truly supports the claim.
Reference graph
Works this paper leans on
-
[1]
International Journal of Epidemiology 53
, 2024. International Journal of Epidemiology 53. URL:http://dx.doi.org/10.1093/ije/dyae039, doi:10.1093/ije/dyae039
-
[2]
Population structure can inflate snp-based heritability estimates
Browning, S.R., Browning, B.L., 2011. Population structure can inflate snp-based heritability estimates. The American Journal of Human Genetics 89, 191–193. URL:http://dx.doi.org/10.1016/j.ajhg.2011.05.025, doi:10.1016/j.ajhg.2011.05.025
-
[3]
Ld score regression distinguishes confounding from polygenicity in genome-wide association studies
Bulik-Sullivan, B., Finucane, H.K., Anttila, V., Gusev, A., Day, F.R., Loh, P.R., ReproGen, C., et al., 2015. Ld score regression distinguishes confounding from polygenicity in genome-wide association studies. Nature genetics 47, 291–295. doi:10.1038/ng.3211
-
[4]
Tutorial:aguidetoperformingpolygenicriskscoreanalyses
Choi,S.W.,Mak,T.S.H.,O’Reilly,P.F.,2020. Tutorial:aguidetoperformingpolygenicriskscoreanalyses. NatureProtocols15,2759–2772. URL:https://doi.org/10.1038/s41596-020-0353-1, doi:10.1038/s41596-020-0353-1
-
[5]
Statistical models and computational tools for predicting complex traits and diseases
Chung, W., 2021. Statistical models and computational tools for predicting complex traits and diseases. Genomics and; Informatics 19, e36. URL:http://dx.doi.org/10.5808/gi.21053, doi:10.5808/gi.21053
-
[6]
Calculating polygenic risk scores (PRS) in UK biobank: A practical guide for epidemiologists
Collister, J.A., Liu, X., Clifton, L., 2022. Calculating polygenic risk scores (PRS) in UK biobank: A practical guide for epidemiologists. Frontiers in Genetics 13. URL:https://doi.org/10.3389/fgene.2022.818574, doi:10.3389/fgene.2022.818574
-
[7]
URL:http://dx.doi.org/10.2307/1267913, doi:10.2307/1267913
Corbeil,R.R.,Searle,S.R.,1976.Restrictedmaximumlikelihood(reml)estimationofvariancecomponentsinthemixedmodel.Technometrics 18, 31. URL:http://dx.doi.org/10.2307/1267913, doi:10.2307/1267913
-
[8]
Eijsbouts, C., Zheng, T., Kennedy, N.A., Bonfiglio, F., Anderson, C.A., Moutsianas, L., Holliday, J., Shi, J., Shringarpure, S., Agee, M., Aslibekyan, S., Auton, A., Bell, R.K., Bryc, K., Clark, S.K., Elson, S.L., Fletez-Brant, K., Fontanillas, P., Furlotte, N.A., Gandhi, P.M., Heilbron, K., Hicks, B., Hinds, D.A., Huber, K.E., Jewett, E.M., Jiang, Y., Kl...
-
[9]
Guan, Y., Stephens, M., 2011. Bayesian variable selection regression for genome-wide association studies and other large-scale problems URL:https://arxiv.org/abs/1110.6019, doi:10.48550/ARXIV.1110.6019
-
[10]
Many sequence variants affecting diversity of adult human height
Gudbjartsson, D.F., Walters, G.B., Thorleifsson, G., Stefansson, H., Halldorsson, B.V., Zusmanovich, P., Sulem, P., Thorlacius, S., Gylfason, A., Steinberg, S., Helgadottir, A., Ingason, A., Steinthorsdottir, V., Olafsdottir, E.J., Olafsdottir, G.H., Jonsson, T., Borch-Johnsen, K., Hansen, T., Andersen, G., Jorgensen, T., Pedersen, O., Aben, K.K., Witjes,...
-
[11]
Theimpactofnon-additivegeneticassociationsonage-relatedcomplexdiseases
Guindo-Martínez, M., Amela, R., Bonàs-Guarch, S., Puiggròs, M., Salvoro, C., Miguel-Escalada, I., Carey, C.E., Cole, J.B., Rüeger, S., Atkinson,E.,Leong,A.,Sanchez,F.,Ramon-Cortes,C.,Ejarque,J.,Palmer,D.S.,Kurki,M.,Aragam,K.,Florez,J.C.,Badia,R.M.,Mercader, J.M.,Torrents,D.,2021. Theimpactofnon-additivegeneticassociationsonage-relatedcomplexdiseases. Natu...
-
[12]
Linearmixedmodelforheritabilityestimationthatexplicitlyaddressesenvironmentalvariation
Heckerman, D., Gurdasani, D., Kadie, C., Pomilla, C., Carstensen, T., Martin, H., Ekoru, K., Nsubuga, R.N., Ssenyomo, G., Kamali, A., Kaleebu,P.,Widmer,C.,Sandhu,M.S.,2016. Linearmixedmodelforheritabilityestimationthatexplicitlyaddressesenvironmentalvariation. Proceedings of the National Academy of Sciences 113, 7377–7382. URL:http://dx.doi.org/10.1073/pn...
-
[13]
Howard, D.M., Adams, M.J., Shirali, M., Clarke, T.K., Marioni, R.E., Davies, G., Coleman, J.R.I., Alloza, C., Shen, X., Barbu, M.C., Wigmore, E.M., Gibson, J., Agee, M., Alipanahi, B., Auton, A., Bell, R.K., Bryc, K., Elson, S.L., Fontanillas, P., Furlotte, N.A., Hinds, D.A., Huber, K.E., Kleinman, A., Litterman, N.K., McCreight, J.C., McIntyre, M.H., Mou...
-
[14]
Incorporating family history of disease improves polygenic risk scores in diverse populations
Hujoel, M.L., Loh, P.R., Neale, B.M., Price, A.L., 2022. Incorporating family history of disease improves polygenic risk scores in diverse populations. Cell Genomics 2, 100152. URL:http://dx.doi.org/10.1016/j.xgen.2022.100152, doi:10.1016/j.xgen.2022.10 0152
-
[15]
A generalized linear mixed model association tool for biobank-scale data
Jiang, L., Zheng, Z., Fang, H., Yang, J., 2021. A generalized linear mixed model association tool for biobank-scale data. Nature Genetics 53, 1616–1621. URL:http://dx.doi.org/10.1038/s41588-021-00954-4, doi:10.1038/s41588-021-00954-4
-
[16]
Estimating missing heritability for disease from genome-wide association studies
Lee, S.H., Wray, N.R., Goddard, M.E., Visscher, P.M., 2011. Estimating missing heritability for disease from genome-wide association studies. The American Journal of Human Genetics 88, 294–305. URL:http://dx.doi.org/10.1016/j.ajhg.2011.02.002, doi:10.1016/j.ajhg.2011.02.002
-
[17]
Polygenic risk scores: from research tools to clinical instruments
Lewis, C.M., Vassos, E., 2020. Polygenic risk scores: from research tools to clinical instruments. Genome Medicine 12. URL:https: //doi.org/10.1186/s13073-020-00742-5, doi:10.1186/s13073-020-00742-5
-
[18]
Li, H., Mazumder, R., Lin, X., 2023. Accurate and efficient estimation of local heritability using summary statistics and the linkage disequilibrium matrix. Nature Communications 14. URL:http://dx.doi.org/10.1038/s41467- 023- 43565-9, doi:10.1038/ s41467-023-43565-9
-
[19]
Lindsay, B.G., 2005. Method of moments. URL:http://dx.doi.org/10.1002/0470011815.b2a15089, doi:10.1002/0470011815 .b2a15089
-
[20]
Mixed-model association for biobank-scale datasets
Loh, P.R., Kichaev, G., Gazal, S., Schoech, A.P., Price, A.L., 2018. Mixed-model association for biobank-scale datasets. Nature Genetics 50, 906–908. URL:http://dx.doi.org/10.1038/s41588-018-0144-6, doi:10.1038/s41588-018-0144-6
-
[21]
Finding the missing heritability of complex diseases
Manolio,T.A.,Collins,F.S.,Cox,N.J.,Goldstein,D.B.,Hindorff,L.A.,Hunter,D.J.,McCarthy,M.I.,Ramos,E.M.,Cardon,L.R.,Chakravarti, A., Cho, J.H., Guttmacher, A.E., Kong, A., Kruglyak, L., Mardis, E., Rotimi, C.N., Slatkin, M., Valle, D., Whittemore, A.S., Boehnke, M., Clark, A.G., Eichler, E.E., Gibson, G., Haines, J.L., Mackay, T.F.C., McCarroll, S.A., Vissch...
-
[22]
Maximumlikelihoodestimationofmodelsforresidualcovarianceinspatialregression
MARDIA,K.V.,MARSHALL,R.J.,1984. Maximumlikelihoodestimationofmodelsforresidualcovarianceinspatialregression. Biometrika 71, 135–146. URL:http://dx.doi.org/10.1093/biomet/71.1.135, doi:10.1093/biomet/71.1.135
-
[23]
Assessingtheheritabilityofcomplextraitsinhumans:Methodologicalchallengesandopportunities
Mayhew,A.J.,Meyre,D.,2017. Assessingtheheritabilityofcomplextraitsinhumans:Methodologicalchallengesandopportunities. Current Genomics 18. URL:http://dx.doi.org/10.2174/1389202918666170307161450, doi:10.2174/1389202918666170307161450
-
[24]
McDonald, M.L.N., Lakshman Kumar, P., Srinivasasainagendra, V., Nair, A., Rocco, A.P., Wilson, A.C., Chiles, J.W., Richman, J.S., Pinson, S.A., Dennis, R.A., Jagadale, V., Brown, C.J., Pyarajan, S., Tiwari, H.K., Bamman, M.M., Singh, J.A., 2022. Novel genetic loci associated with osteoarthritis in multi-ancestry analyses in the million veteran program and...
-
[25]
Muneeb, M., Feng, S., Henschel, A., 2022a. An empirical comparison between polygenic risk scores and machine learning for case/control classification URL:https://doi.org/10.21203/rs.3.rs-1298372/v1, doi:10.21203/rs.3.rs-1298372/v1
-
[26]
Muneeb, M., Feng, S.F., Henschel, A., 2022b. Heritability, genetic variation, and the number of risk snps effect on deep learning and polygenic risk scores auc, in: 2022 14th International Conference on Bioinformatics and Biomedical Technology, ACM. URL:http: //dx.doi.org/10.1145/3543377.3543387, doi:10.1145/3543377.3543387
-
[27]
A bayesian mixed modeling approach for estimating heritability
Nustad, H.E., Page, C.M., Reiner, A.H., Zucknick, M., LeBlanc, M., 2018. A bayesian mixed modeling approach for estimating heritability. BMC Proc. 12, 31
work page 2018
-
[28]
Ldpred2: better, faster, stronger
Privé, F., Arbel, J., Vilhjálmsson, B.J., 2020. Ldpred2: better, faster, stronger. Bioinformatics 36, 5424–5431. URL:http://dx.doi.org /10.1093/bioinformatics/btaa1029, doi:10.1093/bioinformatics/btaa1029
-
[29]
A cross-population atlas of genetic associations for 220 human phenotypes
Sakaue, S., Kanai, M., Tanigawa, Y., Karjalainen, J., Kurki, M., Koshiba, S., Narita, A., Konuma, T., Yamamoto, K., Akiyama, M., Ishigaki, K., Suzuki, A., Suzuki, K., Obara, W., Yamaji, K., Takahashi, K., Asai, S., Takahashi, Y., Suzuki, T., Shinozaki, N., Yamaguchi, H., Minami, S., Murayama, S., Yoshimori, K., Nagayama, S., Obata, D., Higashiyama, M., Ma...
-
[30]
Sumher better estimates the snp heritability of complex traits from summary statistics
Speed, D., Balding, D.J., 2018. Sumher better estimates the snp heritability of complex traits from summary statistics. Nature Genetics 51, 277–284. URL:http://dx.doi.org/10.1038/s41588-018-0279-5, doi:10.1038/s41588-018-0279-5
-
[31]
Evaluating and improving heritability models using summary statistics
Speed, D., Holmes, J., Balding, D.J., 2020. Evaluating and improving heritability models using summary statistics. Nature Genetics 52, 458–462. URL:http://dx.doi.org/10.1038/s41588-020-0600-y, doi:10.1038/s41588-020-0600-y
-
[32]
Heritabilityestimationapproachesutilizinggenome-widedata
Srivastava,A.K.,Williams,S.M.,Zhang,G.,2023. Heritabilityestimationapproachesutilizinggenome-widedata. CurrentProtocols3. URL: http://dx.doi.org/10.1002/cpz1.734, doi:10.1002/cpz1.734
-
[33]
Sun, S., Zhu, J., Mozaffari, S., Ober, C., Chen, M., Zhou, X., 2019. Heritability estimation and differential analysis of count data with generalized linear mixed models in genomic sequencing studies. Bioinformatics 35, 487–496
work page 2019
-
[34]
Common snps explain a large proportion of the heritability for human height
Yang, J., Benyamin, B., McEvoy, B.P., Gordon, S., Henders, A.K., Nyholt, D.R., Madden, P.A., Heath, A.C., Martin, N.G., Montgomery, G.W., Goddard, M.E., Visscher, P.M., 2010. Common snps explain a large proportion of the heritability for human height. Nature Genetics 42, 565–569. URL:http://dx.doi.org/10.1038/ng.608, doi:10.1038/ng.608
-
[35]
Gcta: a tool for genome-wide complex trait analysis
Yang, J., Lee, S.H., Goddard, M.E., Visscher, P.M., 2011. Gcta: a tool for genome-wide complex trait analysis. The American Journal of Human Genetics doi:10.1016/j.ajhg.2010.11.011
-
[36]
Gcta-gremlaccountsforlinkagedisequilibriumwhenestimatinggenetic variance from genome-wide snps
Yang,J.,Lee,S.H.,Wray,N.R.,Goddard,M.E.,Visscher,P.M.,2016. Gcta-gremlaccountsforlinkagedisequilibriumwhenestimatinggenetic variance from genome-wide snps. Proceedings of the National Academy of Sciences 113. URL:http://dx.doi.org/10.1073/pnas.16 02743113, doi:10.1073/pnas.1602743113. Muneeb and Ascher:Preprint submitted to ElsevierPage 20 of 21 Benchmark...
-
[37]
Non-parametric genetic prediction of complex traits with latent dirichlet process regression models
Zeng, P., Zhou, X., 2017. Non-parametric genetic prediction of complex traits with latent dirichlet process regression models. Nature Communications 8. URL:http://dx.doi.org/10.1038/s41467-017-00470-2, doi:10.1038/s41467-017-00470-2
-
[38]
Polygenic modeling with bayesian sparse linear mixed models
Zhou, X., Carbonetto, P., Stephens, M., 2013. Polygenic modeling with bayesian sparse linear mixed models. PLoS Genetics 9, e1003264. URL:http://dx.doi.org/10.1371/journal.pgen.1003264, doi:10.1371/journal.pgen.1003264
-
[39]
Genome-wide efficient mixed-model analysis for association studies
Zhou, X., Stephens, M., 2012. Genome-wide efficient mixed-model analysis for association studies. Nature genetics 44, 821–824. doi:10.1038/ng.2310
-
[40]
Statistical methods for snp heritability estimation and partition: A review
Zhu, H., Zhou, X., 2020. Statistical methods for snp heritability estimation and partition: A review. Computational and Structural Biotechnology Journal 18, 1557–1568. URL:https://www.sciencedirect.com/science/article/pii/S2001037020303007, doi:https://doi.org/10.1016/j.csbj.2020.06.011
-
[41]
Themysteryofmissingheritability:Geneticinteractionscreatephantomheritability
Zuk,O.,Hechter,E.,Sunyaev,S.R.,Lander,E.S.,2012. Themysteryofmissingheritability:Geneticinteractionscreatephantomheritability. Proceedings of the National Academy of Sciences 109, 1193–1198. URL:http://dx.doi.org/10.1073/pnas.1119675109, doi:10.1073/pnas.1119675109. Muneeb and Ascher:Preprint submitted to ElsevierPage 21 of 21
discussion (0)
Sign in with ORCID, Apple, or X to comment. Anyone can read and Pith papers without signing in.